En+ Group: EBITDA up 45.8% in H1, but leverage remains high

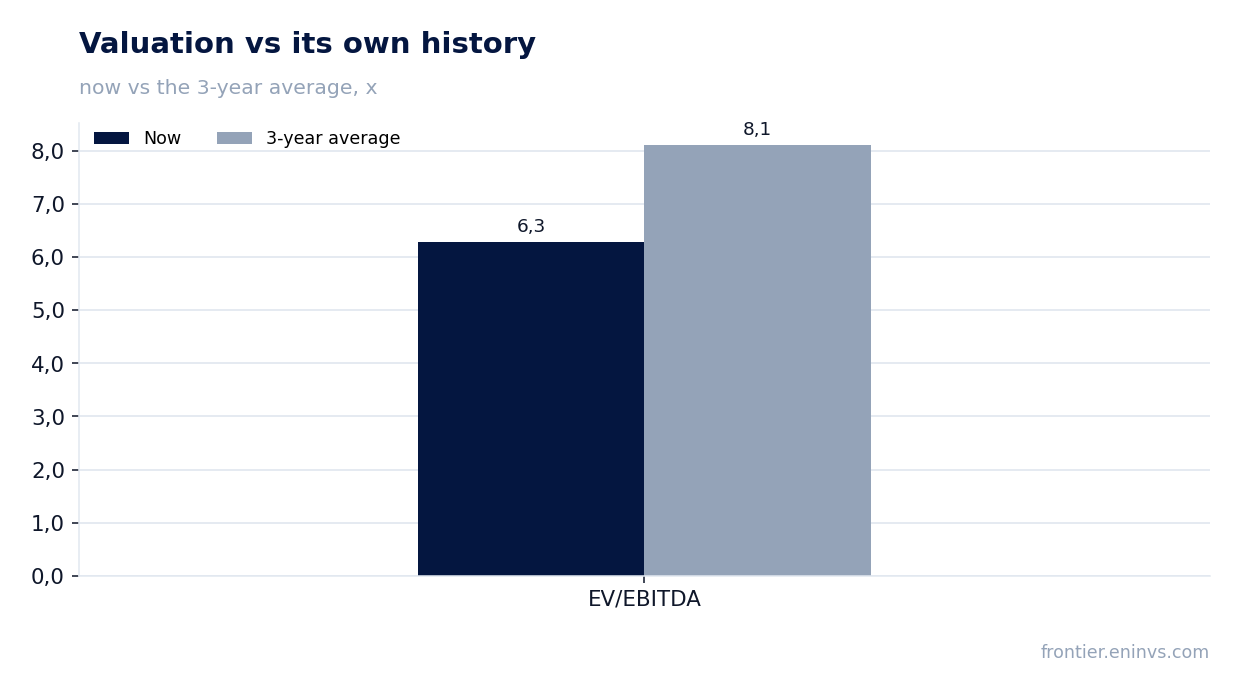
On July 31, En+ Group released its H1 2026 results. Revenue was nearly flat (-0.8% YoY), but EBITDA grew 45.8% and net profit surged 138.4%. The shares look attractive at the current level: EV/EBITDA (LTM) is 6.4 versus the three-year average of 8.1, and the portal's model implies +72% upside.
Key takeaways
— EBITDA grew 45.8% on margin expansion in both segments
— Net profit rose 138.4% on operating leverage and one-off items
— Leverage remains high: net debt / EBITDA LTM – 5.48
— Operating cash flow grew, but capex and interest consume free cash flow
— Valuation below its own history: EV/EBITDA LTM – 6.4 vs 8.1 three-year average
— Portal's model implies +72% upside
Attractiveness
Key figures, RUB bn
| Metric | H1 2025 | H1 2026 | Change |
|---|---|---|---|
| Revenue | 781 | 774 | -0.8% |
| EBITDA | 118 | 172 | +45.8% |
| Operating profit | 78.0 | 131 | +67.7% |
| Net profit | 29.1 | 69.3 | +138.4% |
| Operating cash flow | 153 | 124 | -18.7% |
| Capex | 84.1 | 76.8 | -8.7% |
| EBITDA margin | 15.1% | 22.2% | +7.1 pp |
| Net margin | 3.7% | 9.0% | +5.3 pp |
EBITDA grew 45.8% on margin expansion in both segments
For H1 2026, En+ Group's EBITDA reached RUB 227,178.5 million (LTM), up 45.8% YoY. Revenue was nearly flat, down just 0.8%. This gap indicates that profit growth was driven not by volumes but by margin expansion.
EBITDA margin for the reported period rose to 22.2% from 15.1% a year earlier. The segment breakdown shows both segments improved: Metals segment adjusted EBITDA grew from $748 million to $1,230 million, Energy – from $813 million to $1,102 million (in USD reporting).
The main driver of EBITDA growth, judging by revenue structure, was the Metals segment – higher aluminium prices and a larger share of value-added products. The Energy segment also performed well, supported by higher tariffs and electricity sales volumes.
Net profit rose 138.4% on operating leverage and one-off items
Net profit for H1 2026 grew 138.4% YoY. In the USD-based financials, profit for the period was $905 million versus $333 million a year earlier. Growth was driven by operating leverage – EBITDA grew faster than revenue – and by several non-operating items.
The report shows one-off factors: impairment of non-current assets fell from $178 million to $83 million, and share of profit of associates and joint ventures rose from $291 million to $499 million. Finance costs, in contrast, increased from $641 million to $1,133 million – mainly due to foreign exchange losses ($350 million loss versus $1 million a year earlier).
Net margin for the reported period was 9.0% versus 3.7% a year earlier. Profit growth significantly outpaced EBITDA growth, typical for companies with high operating leverage and volatile non-operating items.
Leverage remains high: net debt / EBITDA LTM – 5.48
Net debt at the latest balance sheet date was RUB 1,244,479 million, and net debt / EBITDA for the last twelve months stood at 5.48. This is a high level, especially given the interest rate environment.
Over the last twelve months, net debt increased by RUB 167.0 billion, and since the previous reporting date – by RUB 104.7 billion. The increase is related to financing of capital expenditures and working capital, as well as currency revaluations.
The high debt level is a key risk: it limits dividend capacity and makes the company sensitive to rising interest rates. However, EBITDA growth is outpacing debt growth, which gradually reduces the burden.
Operating cash flow grew, but capex and interest consume free cash flow
Operating cash flow for the last twelve months was RUB 273,600 million – a strong figure that covers capital expenditures and interest expenses. However, free cash flow after investments and interest remains limited.
In H1 2026 (in USD), operating cash flow was $1,276 million versus $1,506 million a year earlier. The decline was due to higher tax payments and working capital outflows. Capital expenditures increased from $950 million to $996 million for the half-year, reflecting the company's investment program.
Interest paid for the half-year was $635 million versus $808 million a year earlier – a decline thanks to debt refinancing. Nevertheless, given the high debt, the interest burden remains significant.
Valuation below its own history: EV/EBITDA LTM – 6.4 vs 8.1 three-year average
Current EV/EBITDA (LTM) is 6.35, notably below the three-year average of 8.11. This means the market values the company at a discount to its own history, despite improving profitability.
P/E (LTM) is 3.37 – an extremely low level, reflecting both high earnings and subdued market valuation. ROE is 14.8%, above the cost of equity for emerging markets.
The discount to history may be justified by high debt and geopolitical risks, but at current profitability levels and growth prospects it looks excessive. If the company continues to generate strong cash flow and reduce debt, the multiple could expand.
Portal's model implies +72% upside
Our portal's model, which re-prices EBITDA at current commodity prices and applies a target EV/EBITDA multiple, shows +72% upside for the share relative to current market capitalization. This is our own model's calculation, not market consensus.
The share is held in the portal's strategy 'RU Commodity-Upside', reflecting its fit with value and momentum factors in the commodity sector. This is a statement of fact, not an argument for a recommendation.
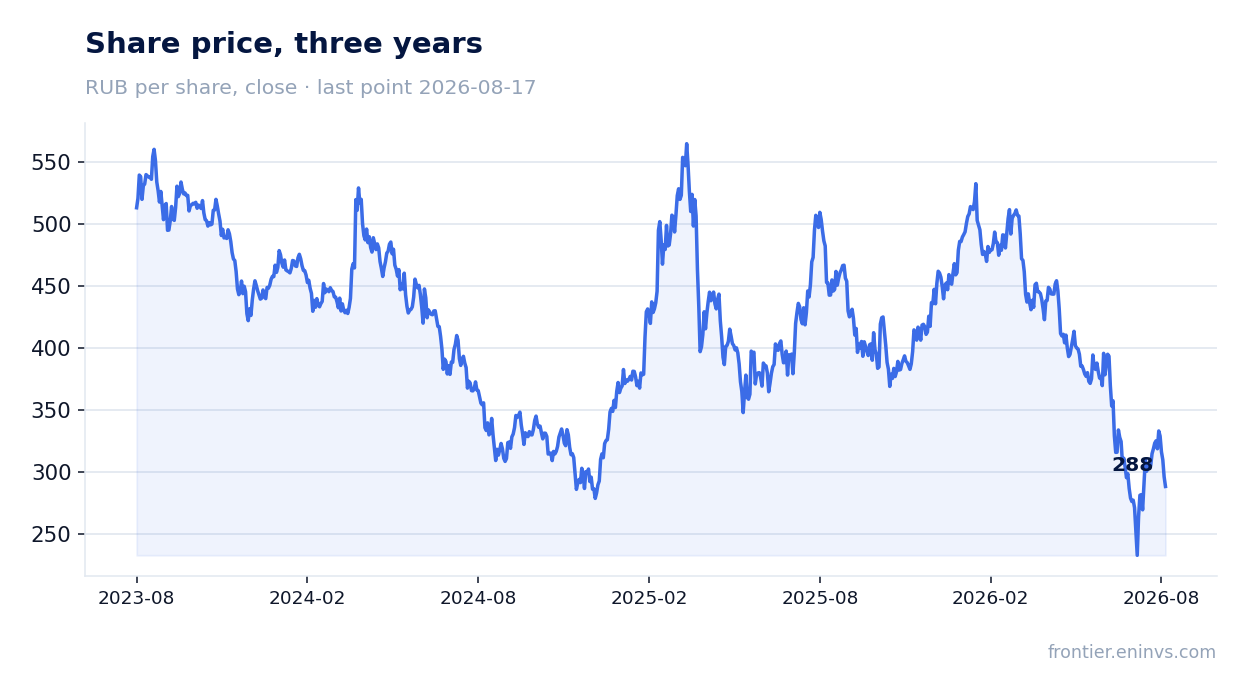
Since the release, the share has declined 5.0% (as of August 17), increasing potential returns. On the release day, the share rose 0.5%, indicating a neutral market reaction to the results.
Valuation on the latest reported figures
| Metric | Value |
|---|---|
| Market cap | 199 bn ₽ |
| P/E (LTM) | 3.4 |
| EV/EBITDA (LTM) | 6.4 |
| P/B | 0.18 |
| Net debt / EBITDA (LTM) | 5.48 |
| Operating cash flow (LTM) | 245 bn |
| ROE | 14.8% |
| EV/EBITDA, 3-year average | 8.1 |
Bottom line
En+ Group delivered strong H1 2026 results: EBITDA grew 45.8%, net profit surged 138.4%, and margins expanded significantly. Profit growth was driven by operating leverage and improved market conditions, not one-off items, although part of the profit came from lower impairment and higher income from associates. The key question for holders is the company's ability to service and reduce debt, which remains high (5.48 EBITDA LTM). At the current valuation (EV/EBITDA 6.4 vs 8.1 three-year average) and +72% upside on the portal's model, the share looks attractive. To confirm the trend, watch aluminium prices and the company's ability to generate free cash flow after interest payments.
Open the company's financial profile ENPG →
See also: market overview · valuation map · stock screeners