FGC UES: FY 2026 profit collapsed 97.5% and no dividend was paid over the last 12 months

FGC UES's FY 2026 report showed operating profit of RUB 2.2 bn and net profit of RUB 2.4 bn, while a year earlier net profit was many times higher – a decline of 97.5%. No dividend was paid over the last 12 months, and the stock trades at a P/E LTM of 62.9 with EV/EBITDA at 3.0, its own three-year average. At the current price the share looks rather unattractive: profit has almost vanished, there is no dividend stream, and the earnings-based valuation remains high.
Key takeaways
— FY 2026 net profit fell 97.5% to RUB 2.4 bn from a level many times higher a year earlier
— FY 2026 operating profit was only RUB 2.2 bn, not enough to justify the current earnings-based valuation
— A P/E LTM of 62.9x is a high price for profit that has almost disappeared
— EV/EBITDA at 3.0x matches its own three-year average, so on this multiple the stock does not look overvalued
— No dividend was paid over the last 12 months, and the 12.0% yield we consider fair for the name remains out of reach with the key rate at 14.0%
— Net debt at end-2026 was RUB 873.1 bn, and it remains the main constraint on returning profit and payouts
— On the portal's model the upside to fair value is +61%, but it rests on an EBITDA recovery, not on current profit
Attractiveness
Key figures, RUB bn
| Metric | FY 2025 | FY 2026 | Change |
|---|---|---|---|
| Revenue | 1 834 | — | — |
| EBITDA | 488 | — | — |
| Operating profit | 118 | 2.20 | -98.1% |
| Net profit | 96.2 | 2.40 | -97.5% |
| Operating cash flow | 581 | — | — |
| Capex | 599 | — | — |
| EBITDA margin | 26.6% | — | — |
| Net margin | 5.2% | — | — |
FY 2026 net profit fell 97.5% to RUB 2.4 bn from a level many times higher a year earlier
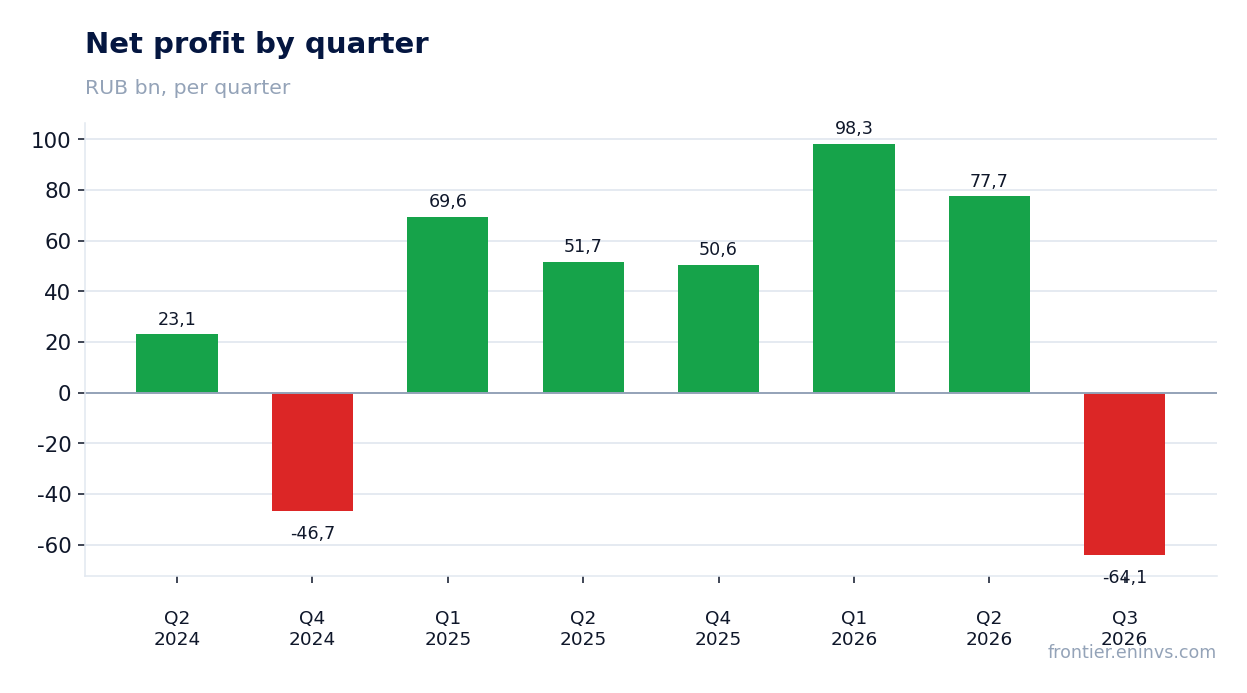
FGC UES's FY 2026 net profit was RUB 2.4 bn, down 97.5% from a year earlier. This is an almost complete disappearance of profit while the scale of the business is preserved: the company remains profitable, but earns an order of magnitude less.
Operating profit for the same period was RUB 2.2 bn, meaning core operations delivered only a small positive amount. On such a base, any one-off items – revaluations, provisions, financial lines – can swing the result disproportionately.
For a holder this means profit has ceased to be the anchor of valuation. Earnings per share in such a situation is almost impossible to forecast, and one has to rely on cash flows and debt load.
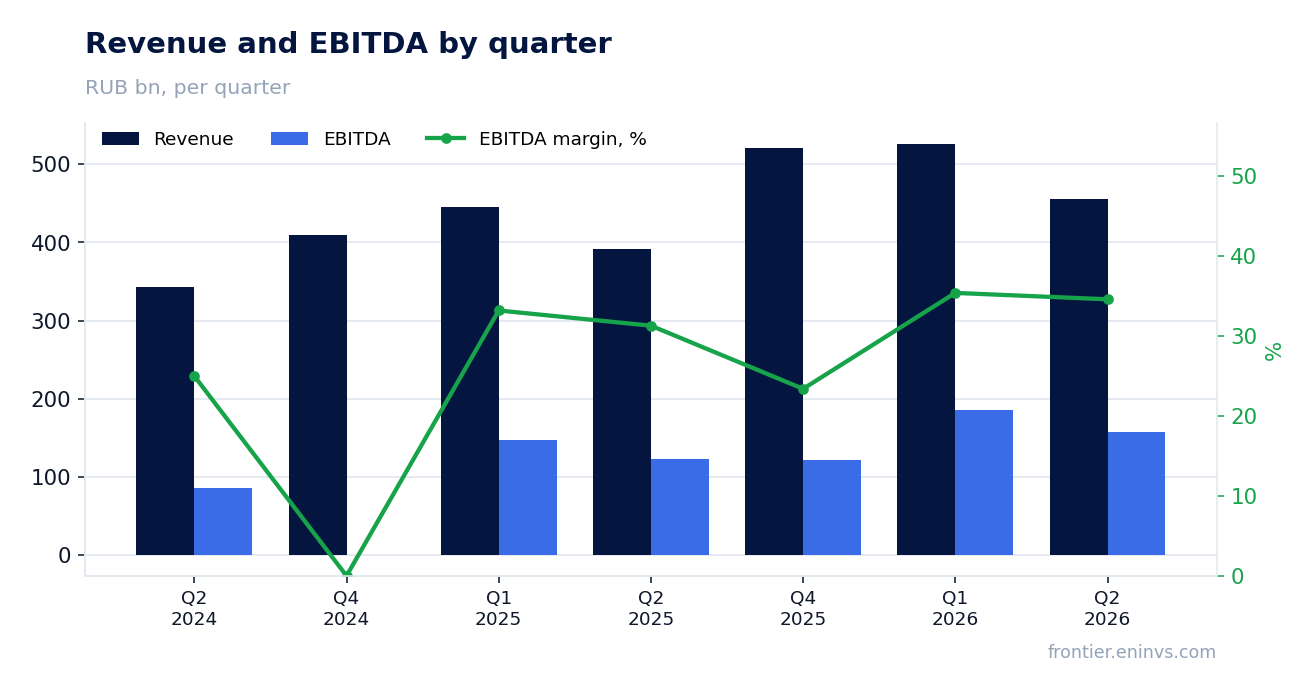
FY 2026 operating profit was only RUB 2.2 bn, not enough to justify the current earnings-based valuation
Operating profit of RUB 2.2 bn for FY 2026 is the level from which the whole downstream chain is calculated: interest, taxes, net profit. With revenue measured in hundreds of billions of roubles, the operating margin turns out to be negligible.
That is why net profit of RUB 2.4 bn should not mislead: it is close to operating profit, meaning financial lines did not rescue the result. Profit rests on a very thin base.
For valuation this is the key point: earnings multiples lose their informative value in such a situation, and the market has to look at EBITDA and debt.
A P/E LTM of 62.9x is a high price for profit that has almost disappeared
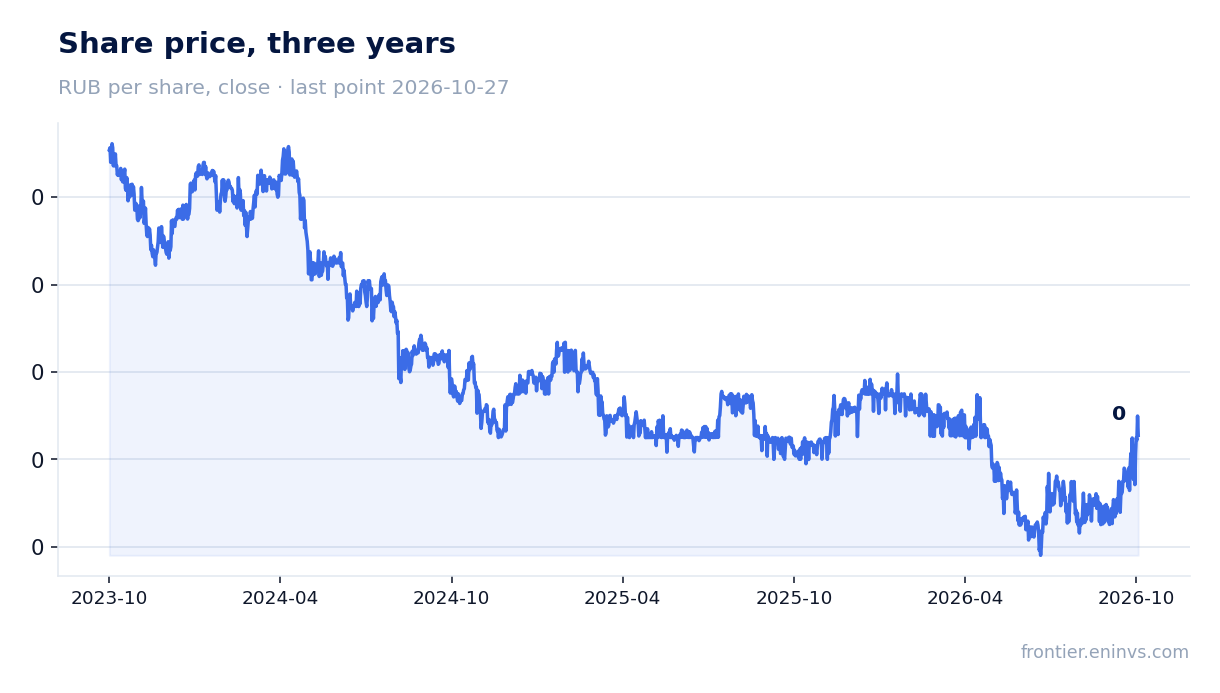
P/E LTM stands at 62.9 with trailing-twelve-month profit of RUB 2.4 bn and a market capitalisation of RUB 151.0 bn. Such a multiple means the investor pays a very high price for each rouble of current profit.
A high P/E is not a verdict in itself – it may reflect an expectation of profit recovery. But here profit fell 97.5%, and the multiple rose mechanically, not because the business became more valuable.
Comparing P/E with its own history is not possible from the facts: they contain only a three-year average for EV/EBITDA. So we limit ourselves to stating: on earnings the stock is priced dearly.
EV/EBITDA at 3.0x matches its own three-year average, so on this multiple the stock does not look overvalued
EV/EBITDA at 3.0x is exactly the three-year average for this multiple. On this measure the stock sits at its customary level, not above it.
This is the only metric in the facts that allows a comparison of the current valuation with history. And it says the market is not overpaying for EBITDA, even despite the profit collapse.
However, EV/EBITDA includes debt, and net debt at end-2026 was RUB 873.1 bn. With such a load, a low multiple reflects debt risk rather than business cheapness.
No dividend was paid over the last 12 months, and the 12.0% yield we consider fair for the name remains out of reach with the key rate at 14.0%
No dividend was paid over the last 12 months: the payout per share was RUB 0.0. No payments were made this calendar year either, and no further payout is pencilled in.
Our estimate of the fair yield for this name is 12.0%. With the key rate at 14.0%, such a yield would have to compensate for risk, but in practice it is absent.
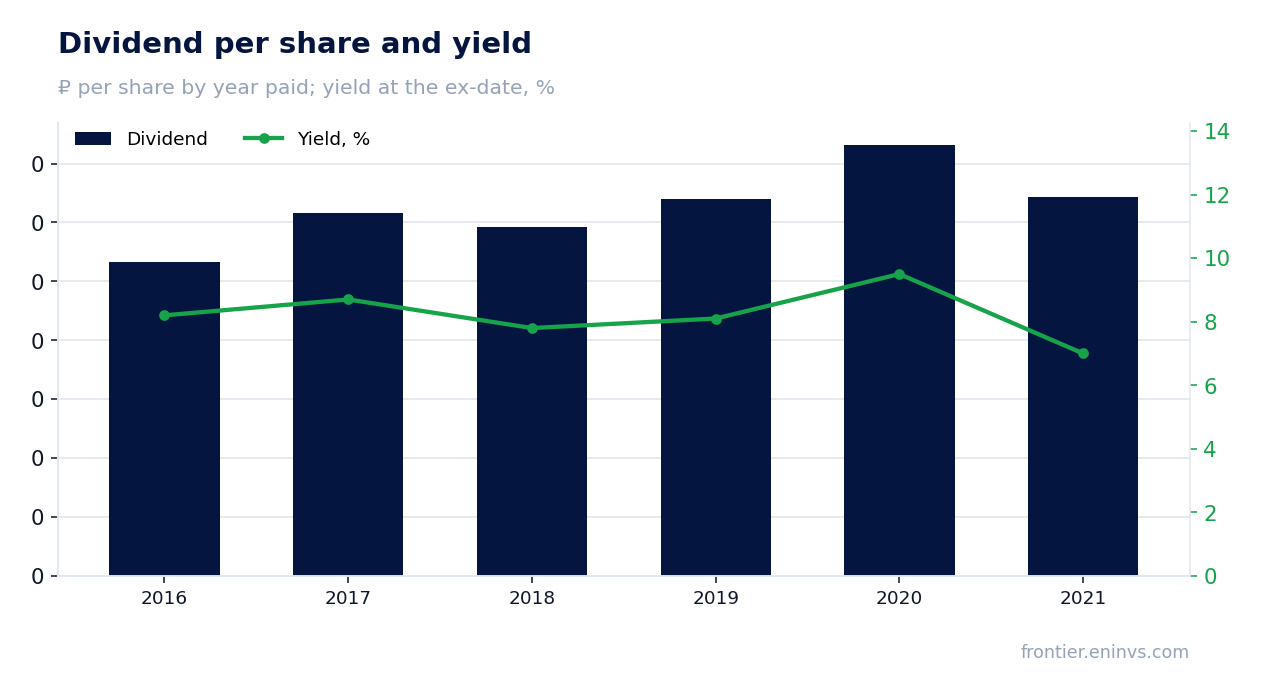
The payout history shows the company used to pay: from 2016 to 2021 dividends ranged from RUB 0.0133 to RUB 0.0183 per share at yields of 7.0–9.5%. Now this channel is closed, and a return to it depends on profit recovery and debt reduction.
The payout would be smaller if profit stays at RUB 2.4 bn or the debt load requires channelling funds to debt service. With a payout ratio of 0.37 of profit, the dividend would be symbolic.
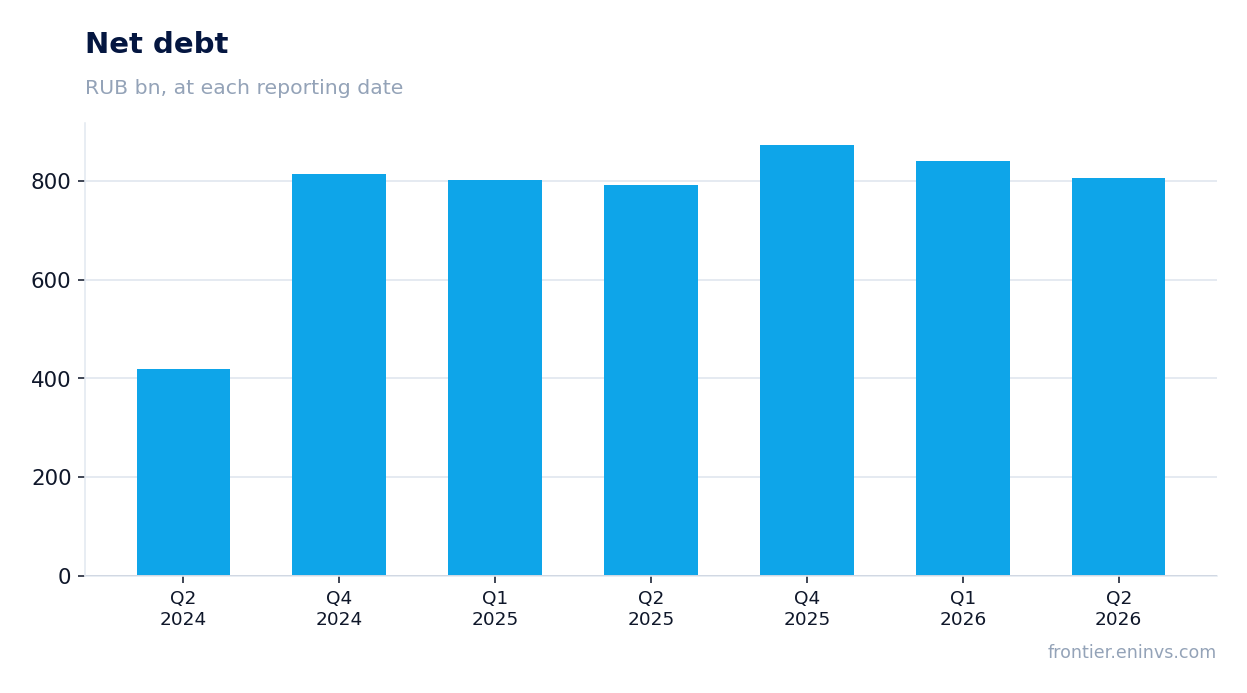
Net debt at end-2026 was RUB 873.1 bn, and it remains the main constraint on returning profit and payouts
Net debt at end-2026 was RUB 873.1 bn. This is comparable to the market capitalisation of RUB 151.0 bn, and it defines the balance-sheet structure.
With operating profit of RUB 2.2 bn, servicing such debt becomes the central question. Interest expenses can absorb almost the entire operating result, which is why net profit came in at RUB 2.4 bn.
Debt reduction is a necessary condition for profit recovery and a return to dividends. While debt is not falling, one cannot count on sustainable payout growth.
On the portal's model the upside to fair value is +61%, but it rests on an EBITDA recovery, not on current profit
On the portal's model the upside to fair value is estimated at +61%. This is our own model estimate, not a market consensus and not a target price.
The model is built on EBITDA growth times a target multiple. This means it assumes a recovery in operating profit, not the preservation of the current level of RUB 2.2 bn.
If EBITDA does not recover, the upside will remain theoretical. The model therefore points more to sensitivity to a recovery than to an imminent re-rating.
Valuation on the latest reported figures
| Metric | Value |
|---|---|
| Market cap | 151 bn ₽ |
| P/E (LTM) | 62.9 |
| P/B | 0.08 |
| ROE | 15.3% |
Dividend per share, ₽, and yield at the ex-date
| Year paid | Dividend | Yield |
|---|---|---|
| 2016 | 0.01 | 8.2% |
| 2017 | 0.02 | 8.7% |
| 2018 | 0.01 | 7.8% |
| 2019 | 0.02 | 8.1% |
| 2020 | 0.02 | 9.5% |
| 2021 | 0.02 | 7.0% |
Bottom line
The FY 2026 report showed an almost complete disappearance of profit: net profit of RUB 2.4 bn, operating profit of RUB 2.2 bn, a decline of 97.5%. The only thing holding the valuation is EV/EBITDA at 3.0x, in line with its own three-year average, but this reflects the debt load of RUB 873.1 bn rather than cheapness. No dividend was paid over the last 12 months, and with the key rate at 14.0% the fair yield of 12.0% is out of reach. The portal's model gives +61% upside, but it requires an EBITDA recovery. At the current price the share looks rather unattractive; the verdict would change if profit and dividends began to recover.
Open the company's financial profile FEES →
See also: market overview · valuation map · stock screeners