FGC UES: profit up one and a half times, but revenue growth slowed to 16.3%

On 25 August, FGC UES reported results for the second quarter of 2026. Revenue grew 16.3% year on year to RUB 455.3 bn, EBITDA – by 28.5% to RUB 157.0 bn, net profit – by 50.2% to RUB 77.7 bn. The EBITDA margin rose to 34.5% from 31.2% a year earlier, while net debt at 30 June stood at RUB 805.4 bn. With an EV/EBITDA multiple of 1.75 against a three-year average of 2.34 and the portal model implying 87% upside, the share looks attractive despite the slowdown in revenue growth.
Key takeaways
— Revenue grew 16.3%, but that is slower than the 22.0% a quarter earlier
— EBITDA added 28.5% thanks to faster margin growth to 34.5%
— Net profit rose 50.2%, but operating cash flow stayed at the level of the previous quarter
— Capital expenditure of RUB 139.6 bn left almost no free cash flow
— Net debt declined to RUB 805.4 bn from RUB 839.3 bn at the end of March
— No dividends were paid over the last 12 months, and the fair yield for the name is 12.0%
— EV/EBITDA of 1.75 is below the three-year average of 2.34, and the portal model implies 87% upside
Attractiveness
Key figures, RUB bn
| Metric | Q2 2025 | Q2 2026 | Change |
|---|---|---|---|
| Revenue | 391 | 455 | +16.3% |
| EBITDA | 122 | 157 | +28.5% |
| Operating profit | 76.9 | 107 | +39.5% |
| Net profit | 51.7 | 77.7 | +50.2% |
| Operating cash flow | 123 | 151 | +22.5% |
| Capex | 117 | 140 | +18.8% |
| EBITDA margin | 31.2% | 34.5% | +3.3 pp |
| Net margin | 13.2% | 17.1% | +3.9 pp |
Revenue grew 16.3%, but that is slower than the 22.0% a quarter earlier
In the second quarter of 2026, FGC UES revenue amounted to RUB 455.3 bn, up 16.3% year on year. This is a slowdown from the first quarter, when growth reached 22.0%. The deceleration may reflect a high base effect or a change in revenue structure, but details are not disclosed in the report.
The main contribution to growth likely came from electricity transmission and technological connection services, but without segment breakdown in the report the exact cause cannot be named. Importantly, even with the slowdown, the company shows double-digit growth, above inflation and the key rate of 14.0%.
The slowdown in revenue growth is the first signal to watch in the next report. If growth rates continue to decline in the third quarter, it could limit further margin expansion.
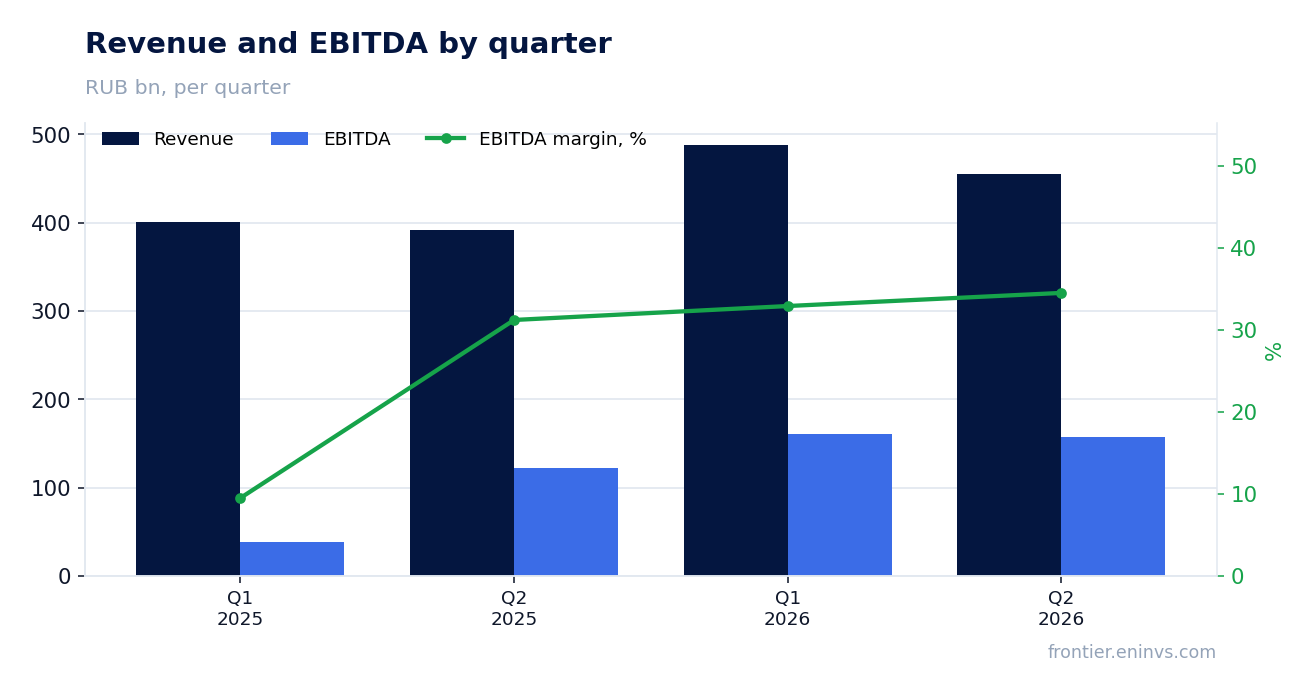
EBITDA added 28.5% thanks to faster margin growth to 34.5%
EBITDA in the second quarter of 2026 grew 28.5% year on year to RUB 157.0 bn. This is faster than revenue growth, which led to an increase in the EBITDA margin to 34.5% from 31.2% a year earlier. Such margin growth means the company controlled costs better or benefited from the revenue structure.
Operating profit amounted to RUB 107.2 bn, which also confirms improved operational efficiency. EBITDA growth outpaced revenue growth by 12.2 percentage points, a strong result.
The sustainability of this margin is the key question. If revenue growth slows and costs remain fixed, the margin could decline. In the next report, it is worth watching the dynamics of operating expenses.
Net profit rose 50.2%, but operating cash flow stayed at the level of the previous quarter
Net profit in the second quarter of 2026 amounted to RUB 77.7 bn, up 50.2% year on year. The net margin rose to 17.1% from 13.2%. This profit growth is partly explained by higher EBITDA and a lower effective tax rate, but details are not disclosed.
Operating cash flow for the quarter was RUB 150.7 bn, in line with the first quarter of 2026. At the same time, net profit is significantly lower than cash flow, which may indicate non-cash items such as depreciation or changes in working capital.
Importantly, operating cash flow remains positive and covers capital expenditures, although not fully. In the next report, it is worth assessing whether this level of cash flow will persist if revenue growth slows.
Capital expenditure of RUB 139.6 bn left almost no free cash flow
Capital expenditure in the second quarter of 2026 amounted to RUB 139.6 bn, only slightly less than operating cash flow of RUB 150.7 bn. As a result, free cash flow was minimal – about RUB 11.1 bn if capital expenditures are subtracted from operating cash flow.
Such high capital expenditures are explained by the company's investment programme aimed at modernising and expanding networks. This limits the ability to pay dividends, as almost all operating cash flow goes to maintaining and developing infrastructure.
In the next report, it is important to see whether this level of capital expenditure persists. If the company can reduce capital expenditures without harming growth, it will free up funds for dividends or debt reduction.
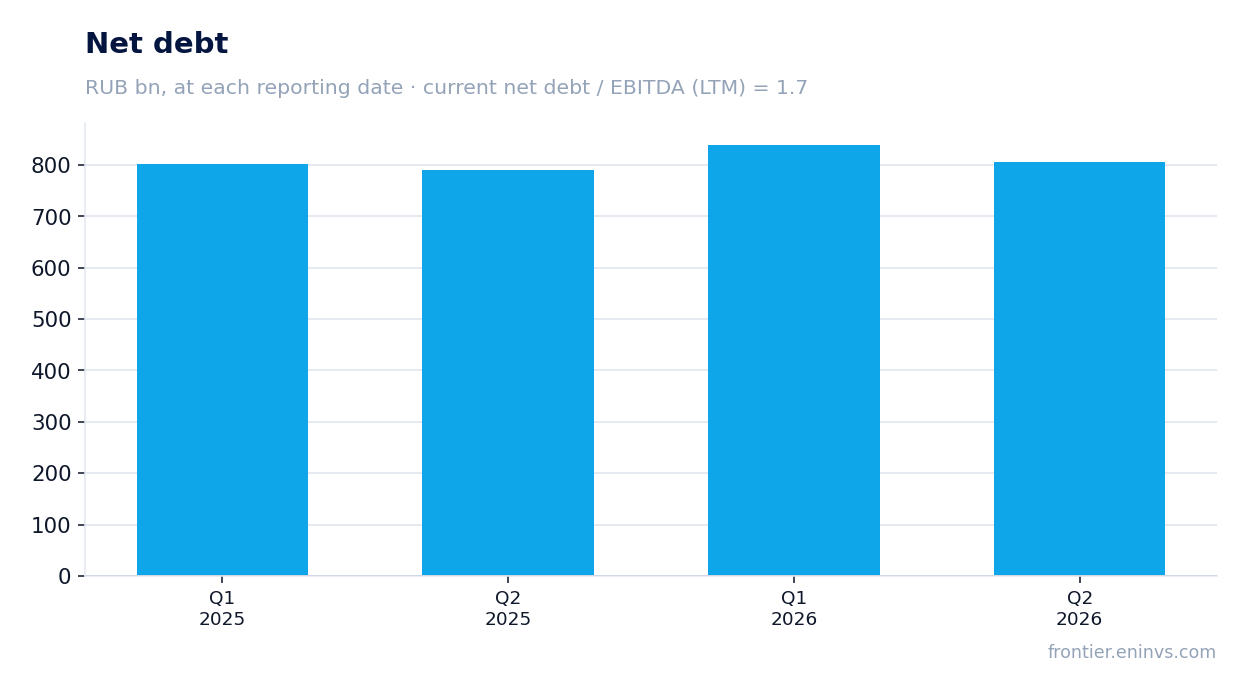
Net debt declined to RUB 805.4 bn from RUB 839.3 bn at the end of March
Net debt at 30 June 2026 was RUB 805.4 bn, down from RUB 839.3 bn at 31 March 2026. The decline of RUB 33.9 bn over the quarter occurred against the backdrop of positive operating cash flow, which partially covered capital expenditures.
The net debt to EBITDA ratio over the last 12 months is 1.43. This is a moderate level that does not raise concerns, but comparison with a previous value is impossible as no earlier ratio is in the facts. A year earlier, at 30 June 2025, net debt was RUB 790.6 bn, meaning it grew by RUB 14.8 bn over 12 months.
Debt servicing at the key rate of 14.0% remains expensive, but the company generates sufficient operating cash flow to cover interest. In the next report, it is worth monitoring debt dynamics and possible refinancing.
No dividends were paid over the last 12 months, and the fair yield for the name is 12.0%
No dividends were paid over the last 12 months. No payouts have been made this calendar year either, and no further payments are planned. This is due to the high investment programme, which absorbs almost all operating cash flow.
Our estimate of the fair dividend yield for this name is 12.0%. At the current price, this would imply a payout ratio of 0.37 of profit. However, there are no actual dividends, and the yield is zero.
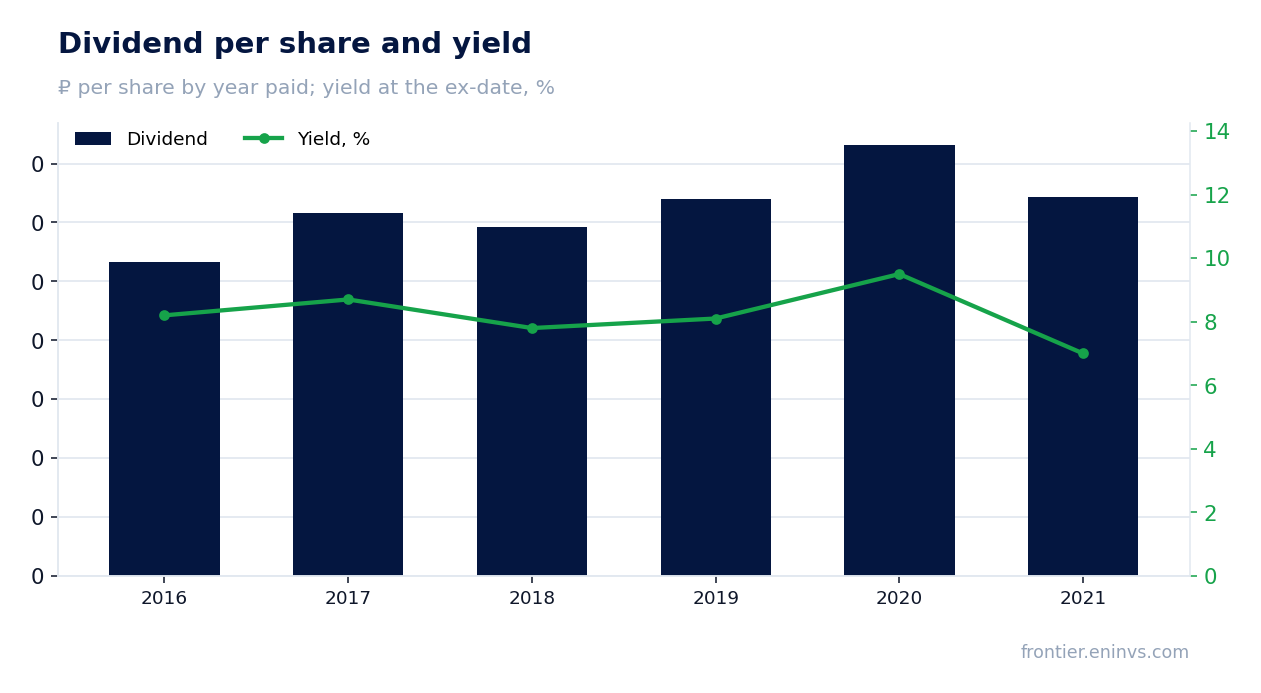
Historically, the company paid dividends: from 2016 to 2021, the yield ranged from 7.0% to 9.5% depending on the year. The current key rate of 14.0% makes a potential yield of 12.0% attractive, but only if payments resume. For now, the dividend factor does not support the valuation.
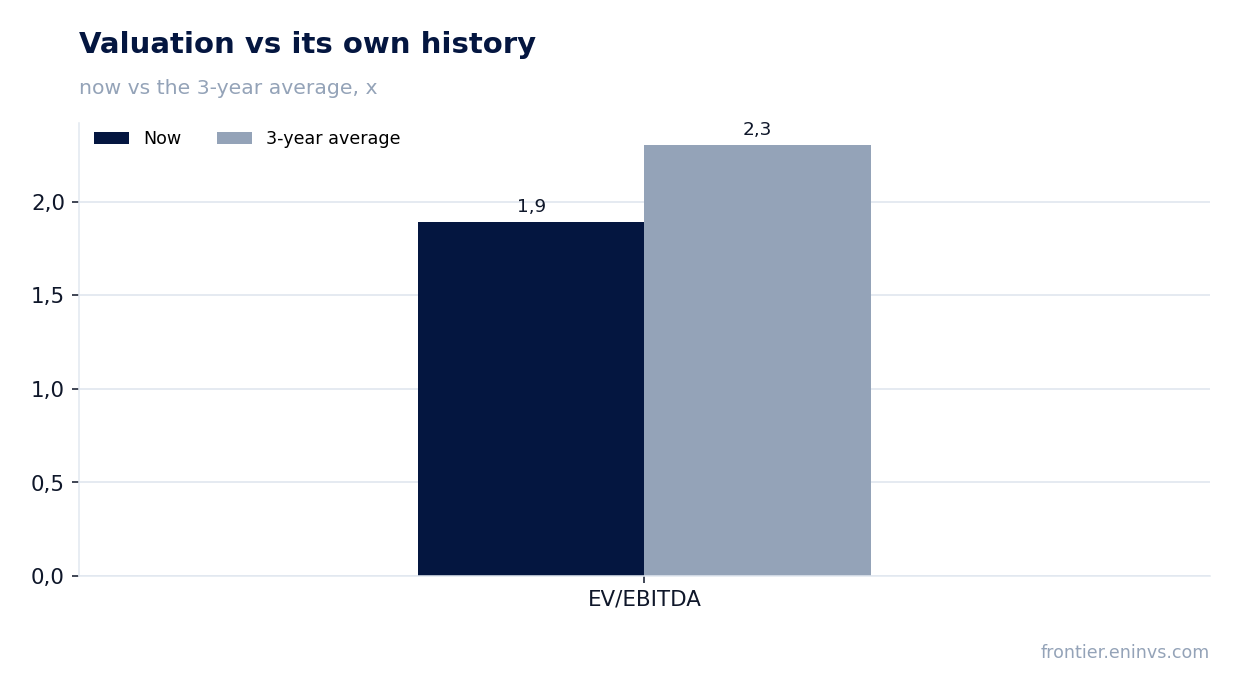
EV/EBITDA of 1.75 is below the three-year average of 2.34, and the portal model implies 87% upside
The current EV/EBITDA multiple is 1.75, below the three-year average of 2.34. This indicates that the share is trading cheaper than its historical valuation. At the same time, the P/E LTM is 0.49, which also looks low.
Our fundamental valuation model, based on EBITDA growth and a target multiple, implies 87% upside to fair value. This is the portal's own estimate, not a market consensus. It assumes that the company can maintain its current EBITDA level and that the multiple will revert to historical values.
However, the low valuation may reflect risks related to slowing revenue growth, high capital expenditures and the absence of dividends. If these factors persist, the discount to the historical multiple may remain.
Valuation on the latest reported figures
| Metric | Value |
|---|---|
| Market cap | 112 bn ₽ |
| P/E (LTM) | 0.5 |
| EV/EBITDA (LTM) | 1.8 |
| P/B | 0.06 |
| Net debt / EBITDA (LTM) | 1.43 |
| Operating cash flow (LTM) | 609 bn |
| ROE | 15.3% |
| EV/EBITDA, 3-year average | 2.3 |
Dividend per share, ₽, and yield at the ex-date
| Year paid | Dividend | Yield |
|---|---|---|
| 2016 | 0.01 | 8.2% |
| 2017 | 0.02 | 8.7% |
| 2018 | 0.01 | 7.8% |
| 2019 | 0.02 | 8.1% |
| 2020 | 0.02 | 9.5% |
| 2021 | 0.02 | 7.0% |
Bottom line
Bottom line: FGC UES showed strong profit and margin growth, but revenue slowed and cash flow was almost entirely absorbed by capital expenditures. Net debt declined over the quarter but grew over the year, and no dividends are being paid. The EV/EBITDA valuation is below historical levels, and the portal model implies 87% upside, making the share attractive, but confirmation requires sustained revenue growth and the resumption of dividends.
Open the company's financial profile FEES →
See also: market overview · valuation map · stock screeners