Sovcomflot: a bet on a closed Hormuz with a 10–13% dividend
Verdict. At RUB 80.9, Sovcomflot (MOEX: FLOT) shares are interesting as a speculative position for 9–12 months: from purchase to the payment of the 2026 dividend in summer 2027. Authors' estimate for the base case: a dividend of about RUB 10 (12–13% at the current price) and a fair price of RUB 86–97, for an expected total return of 20–30%. The idea rests on the closed Strait of Hormuz and record freight rates on Russian routes. If the strait reopens in the coming months, the price upside disappears and what remains is a dividend of about RUB 7–8 (9–10%). Buying makes sense up to ~RUB 85. Above RUB 90 the return rests on the dividend alone, and it is below the 14% key rate.
What the company is and why it is in focus
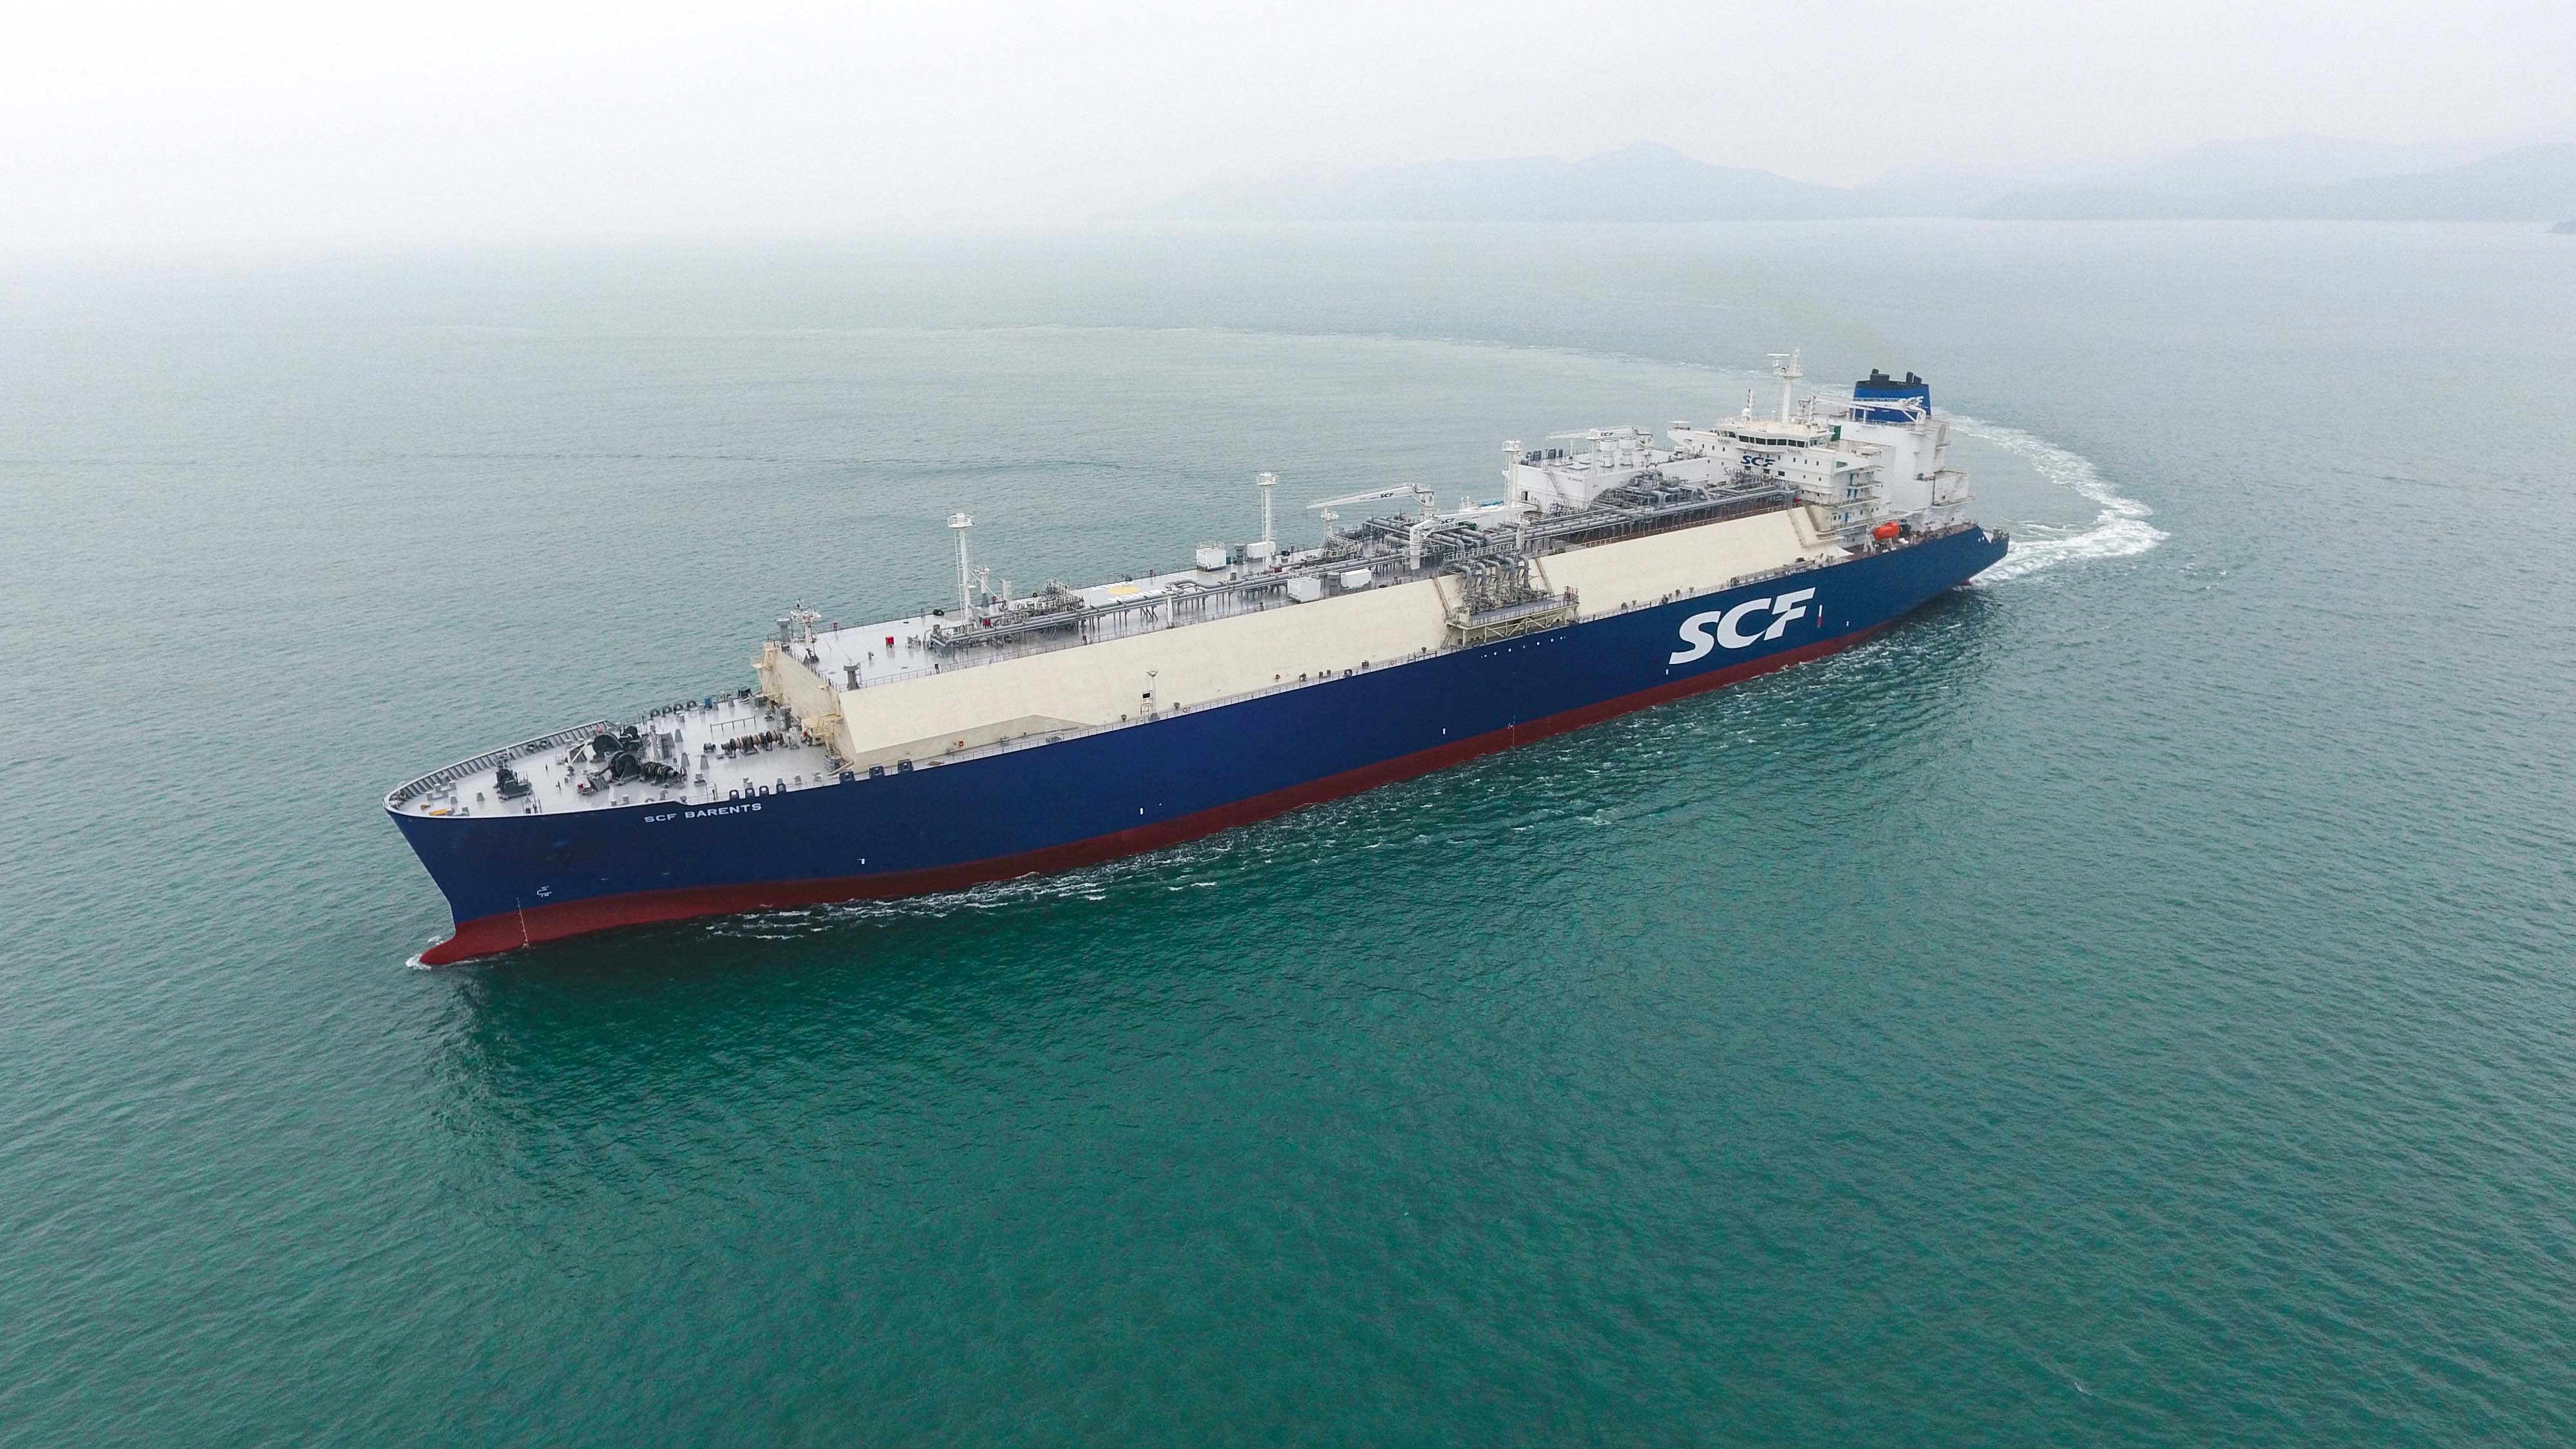
Sovcomflot is Russia's largest shipowner, 82.8% owned by the state. The fleet consists of crude and product tankers, LNG carriers and vessels serving Arctic and offshore projects (Sakhalin, Yamal, Arctic LNG 2). Revenue is in US dollars, IFRS reporting is in US dollars, dividends are paid in rubles. The free float is 15.5% and the market cap is RUB 189 bn ($2.2 bn).
Since January 2025 the company has been under blocking sanctions of the US, the EU and the UK. On 10 January 2025 the US added 69 group vessels to the SDN list, including 54 tankers. EBITDA fell from $1.57 bn in 2023 to $526 mn in 2025. For 2025 the company wrote off $550 mn as vessel impairment and posted a net loss of $648 mn.
In 2026 the picture reversed. Since March the Strait of Hormuz has been effectively closed to tankers because of the conflict around Iran. A temporary reopening in June broke down in July. Since 30 July the strait has been closed again; on 27 September one vessel passed through it against a norm of 85 a day. Global freight rates are at highs: the Aframax composite stood at $215k a day on 24 September versus about $67k in 1H2026. Sovcomflot's earnings are recovering together with the rates.
1H2026: profit is back, free cash is not
Fact (IFRS, 28.08.2026):
| 1H2026 | 1H2025 | Change | |
|---|---|---|---|
| Revenue, $ mn | 1,026 | 618 | +66% |
| Time-charter equivalent (TCE) revenue, $ mn | 809 | 502 | +61% |
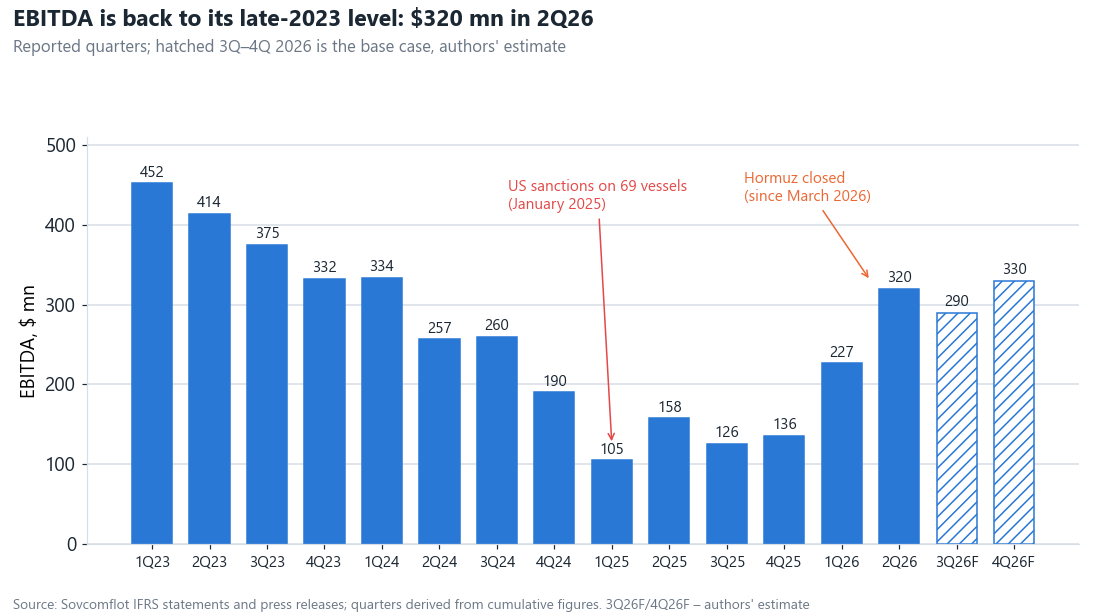
| EBITDA, $ mn | 547 | 263 | +108% |
| Adjusted net profit, $ mn | 266 | 19 | x14 |
| Adjusted net profit, RUB bn | 20.1 | 1.6 | x13 |
| Net debt, $ mn (as of 30.06) | 678 | –14 |
The second quarter was markedly stronger than the first. 2Q EBITDA was $320 mn versus $227 mn in 1Q, adjusted profit $182 mn versus $84 mn (authors' calculation from cumulative figures). At SPIEF in June CEO Igor Tonkovidov expected the half-year to be "comparable to the first quarter". The actual result was better.
Growth rests on two things. The first is long-term contracts, which grew as the fleet was expanded for industrial projects. The second is the tanker market (management view). The company has not disclosed a segment breakdown since 2023, nor fleet size or idle vessels.
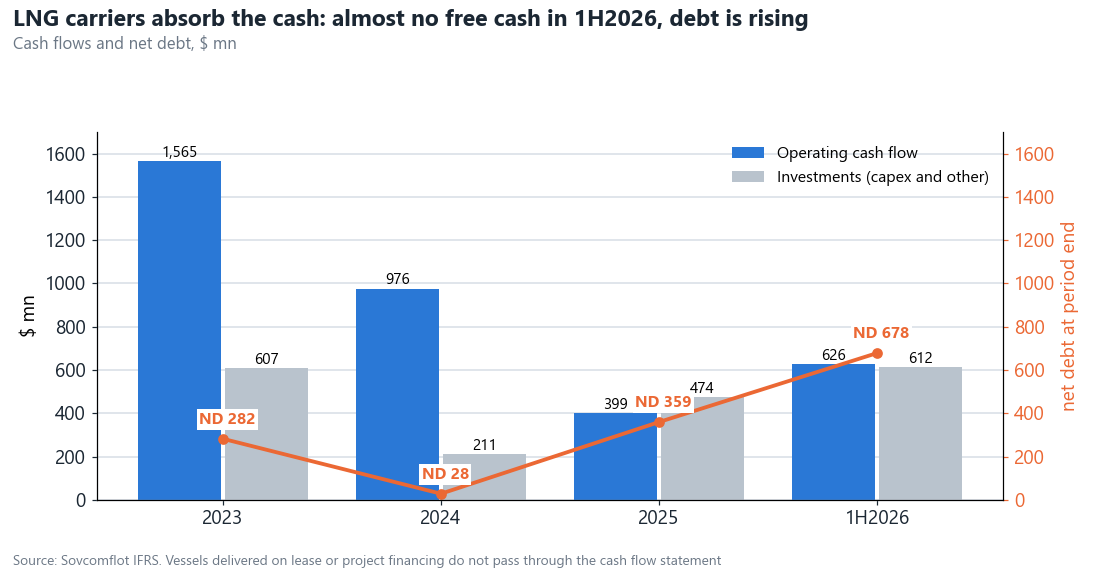
Cash is going into LNG carriers. Operating cash flow for 1H was $626 mn, investments $612 mn. Net debt rose from $359 mn to $678 mn in six months, partly due to non-cash financing of new vessels. That is 0.84x trailing 12-month EBITDA, so there is no leverage problem as such. But the dividend in 2027 will most likely be partly funded with borrowed money.
Industry context: freight on Russian routes follows Hormuz
Shipping Russian oil now costs more than ever. According to Price Index Center (CCI) estimates, in the first week of September an Aframax voyage from Novorossiysk to West India cost $23.2 per barrel and to North China $25.7. That is an all-time high after seven consecutive weeks of growth. The reasons: drone attacks on tankers in the Black Sea, expensive insurance and a shortage of tonnage, part of which has moved to Middle Eastern routes.
Exports are growing and loadings are shifting to the Baltic. Russian seaborne crude exports have stayed above 4 mn bpd for five weeks (Bloomberg). Loadings from Novorossiysk fell by 42% in early September, while Baltic exports rose. The Urals discount at Primorsk narrowed to $22.6 per barrel, and in India and China discounts turned into premiums (Argus via Interfax). So demand for tankers carrying Russian oil is high, and buyers are willing to pay for them.
On the chart, a Baltic–India voyage repeats the news from Hormuz. March – $22–23 mn, during the temporary reopening of the strait in July – $7–8 mn, by the end of August – $13 mn.
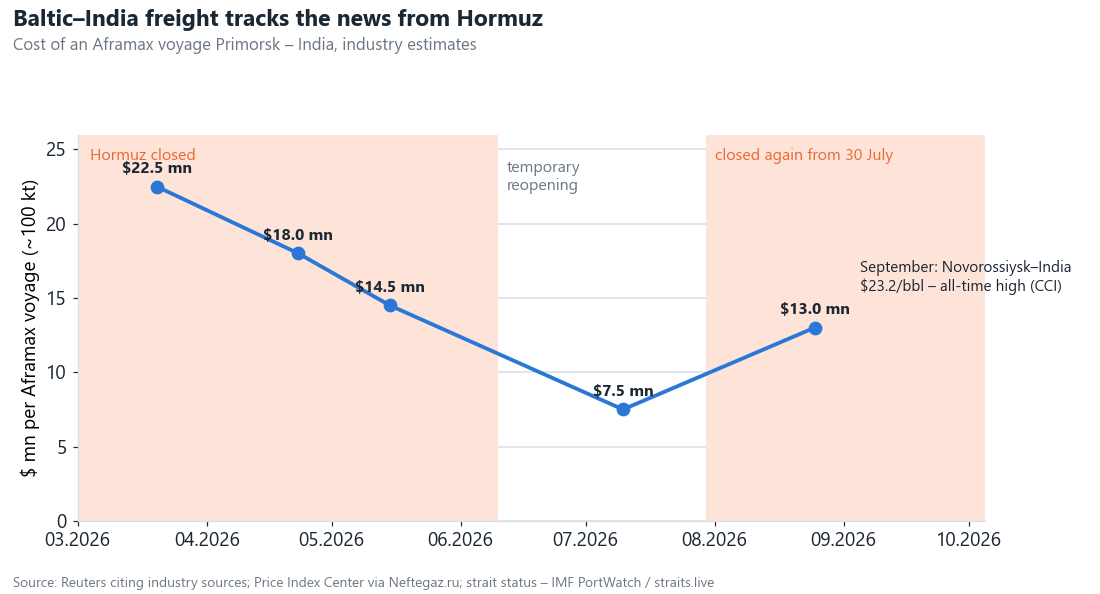
An important caveat: this is a market indicator, not the company's revenue. India does not accept cargoes on sanctioned vessels (management view, SPIEF 05.06), and Sovcomflot's main route is China. About half of its income comes from long-term fixed-rate contracts. So the company's earnings move in the same direction as freight, but with a smaller amplitude.
2026 forecast: EBITDA of about $1.1–1.2 bn
Base case (authors' estimate): 3Q EBITDA $290 mn, 4Q $330 mn, full year $1,167 mn.
- 3Q is slightly weaker than 2Q: the July dip in rates was half offset by a strong August and September. From the end of August a new LNG carrier, Konstantin Posyet, joined on a long-term contract with Arctic LNG 2.
- 4Q starts at record rates, and the LNG carrier works a full quarter.
- Adjusted profit is calculated as EBITDA minus ~$140 mn per quarter: depreciation, interest and tax at the 1Q–2Q 2026 level.
| Scenario | 3Q / 4Q EBITDA, $ mn | EBITDA 2026F | Adj. profit 2026F | EV / EBITDA 2026F | Dividend at 50%, RUB | Yield |
|---|---|---|---|---|---|---|
| Weak: the strait reopens in 4Q | 250 / 220 | 1,017 | 456 | 2.9x | 7.6 | 9% |
| Base: the strait stays closed until year-end | 290 / 330 | 1,167 | 606 | 2.5x | 10.3 | 13% |
| Strong: record freight reaches the company | 310 / 420 | 1,277 | 716 | 2.3x | 12.3 | 15% |
Conversion into rubles uses the average CBR rate for 3Q (RUB 82.0 per dollar) and RUB 87 in 4Q. The divisor is 2,375 mn issued shares, as in the company's EPS. For comparison, Financial One estimates 2026 EBITDA at about $950 mn and the dividend at RUB 7.5–7.8. That is closer to the weak scenario.
The 2026 dividend is the main argument, but not a guarantee
Under its policy the company pays at least 50% of adjusted profit in rubles (confirmed in the 1Q and 1H2026 reports). For 1H, RUB 4.24 per share has already accrued: 50% of adjusted EPS of RUB 8.48. The decision on the 2026 payout is expected in June 2027, with the record date in July.
The payout history is uneven. The company paid no dividends for 2021 and 2024, citing sanctions, capital expenditure and debt obligations in 2024. For 2025, despite the loss, it paid RUB 4.87 out of prior years' profit. The state, as an 83% shareholder, needs dividends, so a full cancellation is unlikely (authors' assumption). The formal minimum in the dividend regulation is 25% of IFRS net profit. At that level the base case gives about RUB 5.
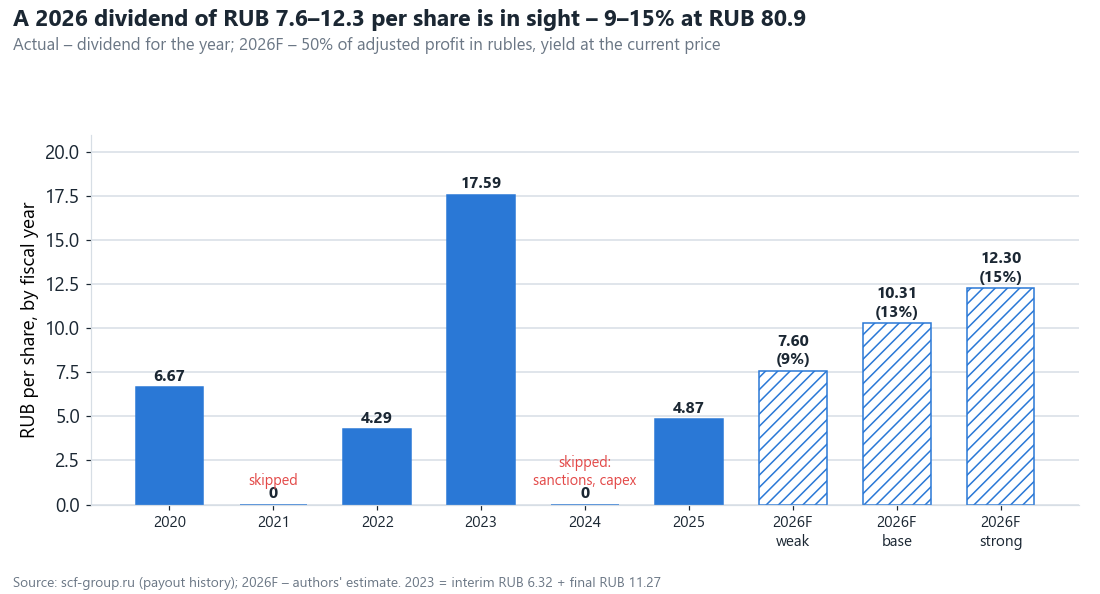
A weak ruble helps, but for 2026 the effect is already small. Every +RUB 5 to the dollar rate in 4Q adds about RUB 0.2 to the dividend: half of the profit has already been earned at a rate of RUB 76. A weak ruble matters more for 2027: by the end of 2027 the authors expect RUB 95–100 per dollar.
Valuation: fair price of RUB 86–97
The valuation uses three methods, without comparison with other companies.
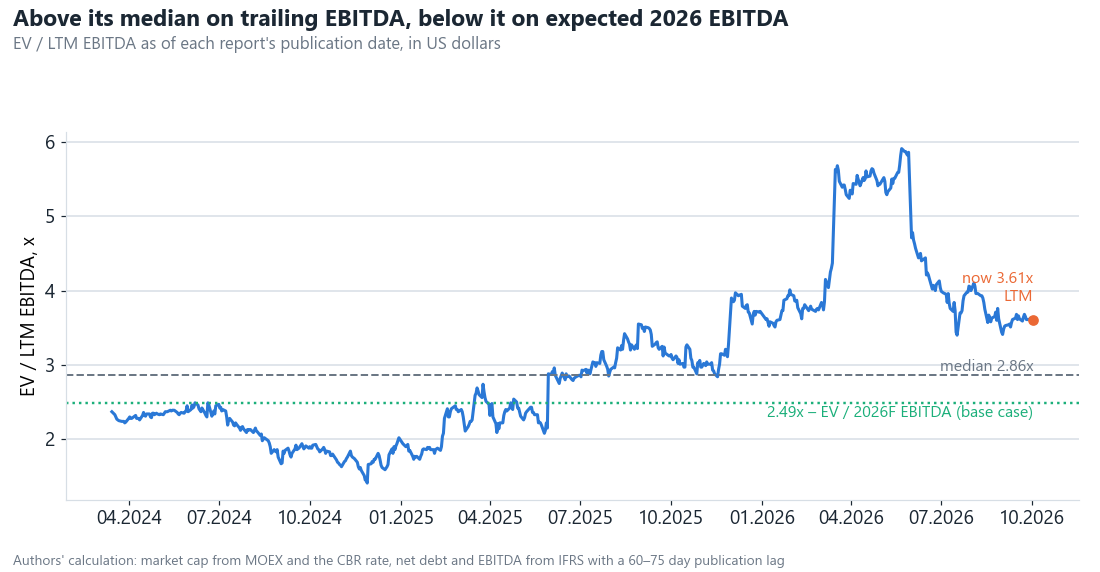
- Own historical multiple. Since March 2024 the median EV / trailing 12-month EBITDA has been 2.86x (authors' calculation in US dollars, using data as of each report's publication date). – Exactly 2.86x on 2026F EBITDA gives RUB 97 in the base case, RUB 81 in the weak one and RUB 108 in the strong one. – Conservative EBITDA of $1.1 bn is the midpoint between the base 2026F and the 2023–2025 average. It gives RUB 91.
- Book value. Equity is $4.8 bn, and the share trades at 0.46x book. The three-year median P/B is 0.50, which implies RUB 88.
- Required dividend yield. A dividend of RUB 10.3 and a required 12% a year give RUB 86. 12% is the 14% key rate minus the expected rate cuts in 2027 (authors' assumption).
Entry threshold (authors' estimate):
| Purchase price | Upside to mid valuation (RUB 91) | + dividend RUB 10.3 | Total |
|---|---|---|---|
| RUB 76 | +20% | +14% | +33% |
| RUB 81 (current) | +12% | +13% | +25% |
| RUB 85 | +7% | +12% | +19% |
| RUB 90 | +1% | +11% | +13% – below the key rate |
Risks: the strait, sanctions and the size of the payout
- Hormuz reopening. This is the main risk. In June rates on Russian routes halved within six weeks after the temporary US–Iran agreement. A repeat in 4Q means the weak scenario: a dividend of RUB 7–8 and a price around the current one.
- The dividend may be below 50%. There is almost no free cash flow, and three more LNG carriers for Arctic LNG 2 still have to be completed. There is already a precedent of skipping the payout, in 2024.
- Sanctions. SDN-listed tankers cannot serve India and depend on a limited circle of buyers. European countries detain tankers carrying Russian oil in their waters. In September foreign media reported a new US bill mentioning Sovcomflot. The primary source has not been verified.
- Opacity. The company does not disclose fleet size, idle time, segments or the contract backlog. The last published backlog figure – $3.5 bn through the end of 2026 – dates from 2023. The contribution of spot freight to earnings has to be estimated indirectly.
- The Black Sea. Attacks on tankers push rates up, but pose a direct risk to the company's vessels.
Taxes and courts. No major tax disputes were found in open sources. The last significant litigation – the London claim against the Skarga group – ended around 2018. Open Federal Tax Service data on the company were not separately checked for this review.
What to track
| Metric | Base case | When |
|---|---|---|
| 3Q EBITDA (from the 9M report) | $290 mn | late November 2026 |
| Status of the Strait of Hormuz | closed until year-end | ongoing |
| Aframax voyage Primorsk – India | not below $12–13 mn | weekly |
| Net debt | up to $0.8 bn | 9M report |
| Board recommendation on the 2026 dividend | 50% of adj. profit, ~RUB 10 | May – June 2027 |
For reference: what we wrote earlier and what has changed. The preview to the 1H report came out on 26 August ([Telegraph](https://telegra.ph/Sovcomflot-2Q2026-Preview-08-26)). At a price of RUB 74.1 the guide then was EV/EBITDA 2026F of about 2.4x and a dividend of RUB 7–8 (about 10%), with the conclusion "a speculative buy". Since then:
- The report beat management's expectations. 2Q EBITDA was $320 mn versus $297 mn in Renaissance Capital's forecast. Adjusted profit was $182 mn versus $166 mn.
- The price rose 9%, to RUB 80.9. The strong 1H is already priced in.
- Hormuz closed again on 30 July, and by September rates on Russian routes hit all-time highs. So the dividend estimate was raised from RUB 7–8 to ~RUB 10.
- Net debt nearly doubled – $678 mn versus $359 mn at the start of the year. The premise of "a dividend out of free cash flow" no longer holds.
Sources:
- PAO Sovcomflot: IFRS press releases (1H2026, 1Q2026, 2025, 9M2025, 1H2025, 2024), [dividend history](https://www.scf-group.ru/investors/Shares/Dividends/), annual reports 2023–2025 – scf-group.ru
- Interfax: [SPIEF, 05.06.2026](https://www.interfax.ru/forumspb/1094116); [Urals prices for September](https://www.interfax.ru/business/1119753); [US sanctions on 69 vessels](https://interfax.com/newsroom/top-stories/109078/)
- Neftegaz.ru: [freight from Novorossiysk, CCI data](https://neftegaz.ru/news/transport-and-storage/936001-frakht-vzletel-stoimost-perevozki-rossiyskoy-nefti-iz-novorossiyska-v-kitay-i-indiyu-bet-rekordy/); [Konstantin Posyet](https://neftegaz.ru/news/Suda-i-sudostroenie/935975-tanker-gazovoz-spg-konstantin-poset-dostavil-svoyu-pervuyu-partiyu-spg-i-vozvrashchaetsya-na-arktik-/)
- [Kommersant, Baltic exports](https://www.kommersant.ru/doc/8970057)
- [Optima, Aframax index on 24.09](https://www.optimashipbroking.com/market-report/dirty-tanker-index-summary-25-september-2026/); [Affinity Tanker Weekly, 18.09](https://www.hellenicshippingnews.com/wp-content/uploads/2026/09/Affinity-Tanker-Weekly-18.09.2026-HSN.pdf)
- [straits.live, Hormuz status](https://straits.live/briefs/2026-10-04)
- [Financial One](https://fomag.ru/news/sovkomflot-sushchestvenno-uluchshil-rezultaty/)
- Quotes – MOEX ISS, exchange rate – Bank of Russia
Open the company's financial profile FLOT →
See also: market overview · valuation map · stock screeners