Gazprom in Q2 2026: profit up 63.9%, and oil rather than gas did almost all of it

On 28 August Gazprom released results for the second quarter of 2026. Revenue rose 14.8% year on year to RUB 2,502.8 bn, EBITDA by 35.4% to RUB 922.0 bn and net profit by 63.9% to RUB 557.2 bn. Top-line growth accelerated from a 0.3% decline in the first quarter, and the EBITDA margin rose to 36.8% from 31.2% a year earlier. The stock trades at EV/EBITDA of 2.77 against its own three-year average of 3.40, and the portal's model puts upside to fair value at +63% – at the current price the share looks attractive, but no dividend has been paid over the last 12 months, and a return to payouts is the main condition for that valuation to be realised.
Key takeaways
— Revenue rose 14.8% year on year, and the oil business produced almost all of the increase
— EBITDA grew 35.4% and the margin rose to 36.8% from 31.2%
— Net profit rose 63.9%, but financial income rather than operations alone supported it
— Operating cash flow for the quarter was RUB 438.0 bn, while capital expenditure for the half-year reached RUB 832.6 bn
— Net debt rose to RUB 7,954.0 bn, and net debt / LTM EBITDA stands at 2.15
— No dividend was paid over the last 12 months, and a return to payouts is the key question for a holder
— The stock trades at EV/EBITDA of 2.77 against its own three-year average of 3.40
Attractiveness
Key figures, RUB bn
| Metric | Q2 2025 | Q2 2026 | Change |
|---|---|---|---|
| Revenue | 2 181 | 2 503 | +14.8% |
| EBITDA | 681 | 922 | +35.4% |
| Operating profit | 344 | 585 | +69.9% |
| Net profit | 340 | 557 | +63.9% |
| Operating cash flow | 493 | 438 | -11.1% |
| Capex | 504 | — | — |
| EBITDA margin | 31.2% | 36.8% | +5.6 pp |
| Net margin | 15.6% | 22.3% | +6.7 pp |
Revenue rose 14.8% year on year, and the oil business produced almost all of the increase
Gazprom's revenue in the second quarter of 2026 was RUB 2,502.8 bn, up 14.8% from a year earlier. That is an acceleration from the first quarter, when revenue declined 0.3%: the year-on-year quarterly comparison shows the company returning to growth after three consecutive quarters of decline.
The oil business produced almost all of the increase. Its external revenue rose to RUB 1,035.1 bn from RUB 873.4 bn a year earlier, adding about RUB 161.8 bn. The gas business added only RUB 139.9 bn, to RUB 1,282.3 bn, and the power business RUB 19.5 bn, to RUB 147.7 bn. Within the oil segment, revenue from sales of crude oil, gas condensate and refined products rose to RUB 979.8 bn from RUB 819.8 bn, while gas sales revenue in the gas segment increased to RUB 776.3 bn from RUB 750.2 bn.
Revenue growth therefore rests primarily on oil prices and volumes rather than gas. That matters for judging the durability of the result: the gas segment remains the largest by revenue, but its contribution to the quarterly increase was smaller than the oil segment's.
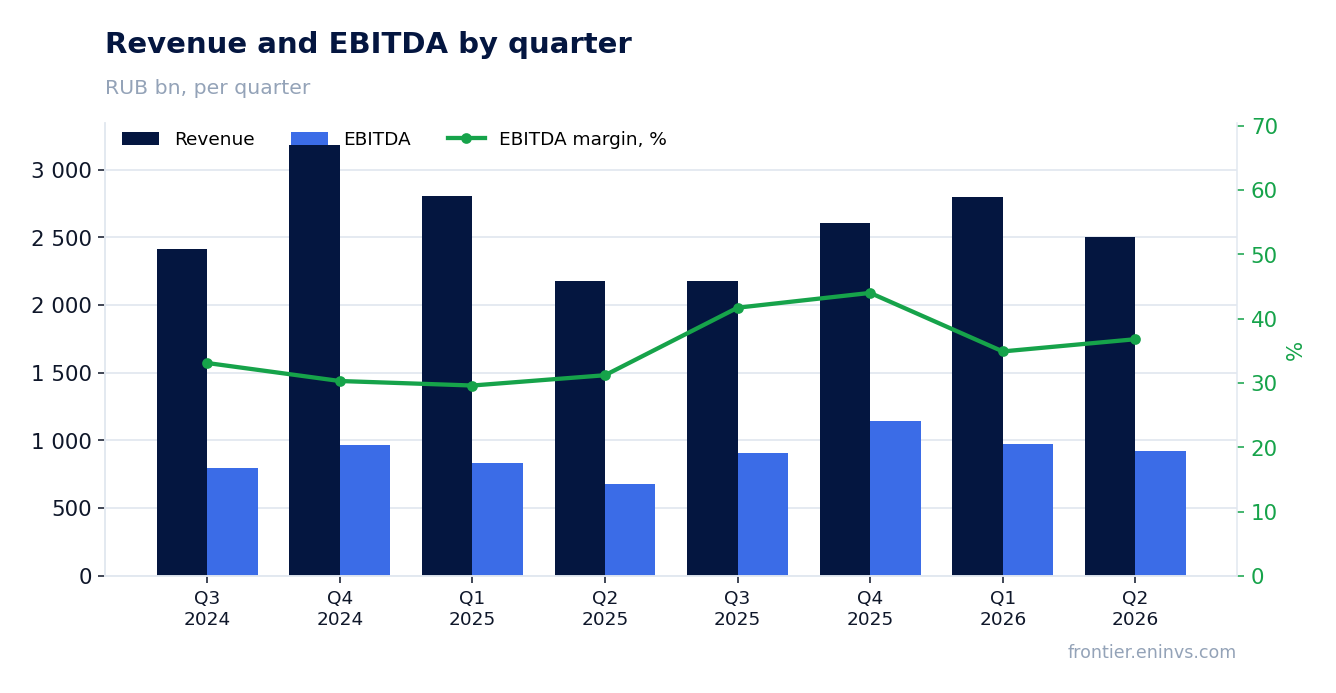
EBITDA grew 35.4% and the margin rose to 36.8% from 31.2%
EBITDA in the second quarter of 2026 was RUB 922.0 bn, up 35.4% from a year earlier. The EBITDA margin rose to 36.8% from 31.2% in the second quarter of 2025 – a 5.6 percentage point increase in margin on 14.8% revenue growth means operating costs grew more slowly than revenue.
Operating expenses for the quarter were RUB 1,909.0 bn against RUB 1,847.8 bn a year earlier, growing only 3.3% while revenue grew 14.8%. That gap produced the bulk of the EBITDA increase. Operating profit rose to RUB 585.2 bn from RUB 344.4 bn, or 69.9%.
By segment, oil business profit rose to RUB 310.1 bn from RUB 72.3 bn, while gas business profit increased only to RUB 271.5 bn from RUB 253.0 bn. The power segment, by contrast, cut profit to RUB 10.5 bn from RUB 22.3 bn. The group-level margin improvement therefore rests primarily on the oil segment, while gas remains relatively stable.
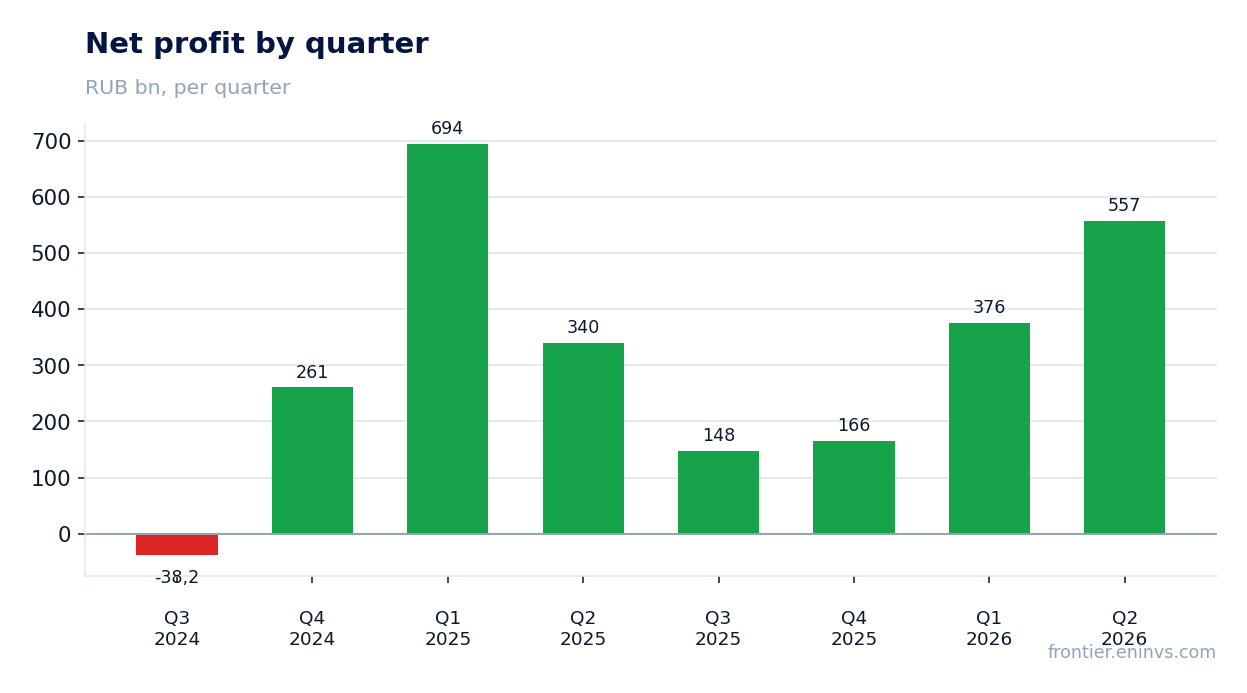
Net profit rose 63.9%, but financial income rather than operations alone supported it
Net profit in the second quarter of 2026 was RUB 557.2 bn, up 63.9% from a year earlier. The net margin rose to 22.3% from 15.6%. Pre-tax profit rose to RUB 714.8 bn from RUB 460.3 bn, while income tax increased to RUB 157.5 bn from RUB 120.2 bn.
Beyond the operating improvement, pre-tax profit was supported by financial income of RUB 187.3 bn and a RUB 41.0 bn share of profit from associates and joint ventures. Financial expenses, meanwhile, fell to RUB 98.7 bn from RUB 133.4 bn a year earlier. Lower interest and foreign exchange costs therefore added more to profit than operating profit growth alone would suggest.
For a holder this means part of the net profit increase is financial rather than operational in nature. The durability of that contribution depends on interest rates and exchange rate movements, which the company does not control.
Operating cash flow for the quarter was RUB 438.0 bn, while capital expenditure for the half-year reached RUB 832.6 bn
Operating cash flow in the second quarter of 2026 was RUB 438.0 bn against RUB 492.9 bn a year earlier. The decline reflects in part higher capital expenditure and working capital movements: over the six months capital expenditure was RUB 832.6 bn against RUB 1,194.7 bn a year earlier.
Free cash flow therefore remains under pressure: with quarterly operating cash flow of RUB 438.0 bn and half-year capital expenditure of RUB 832.6 bn, the company continues to invest heavily in maintaining and developing production and infrastructure. That limits the scope for dividends without increasing debt.
Over the last 12 months operating cash flow was RUB 2,894.7 bn on revenue of RUB 10,083.0 bn and EBITDA of RUB 3,694.8 bn. The ratio of operating cash flow to EBITDA remains high, indicating the business can generate cash, but capital expenditure absorbs a significant share of it.
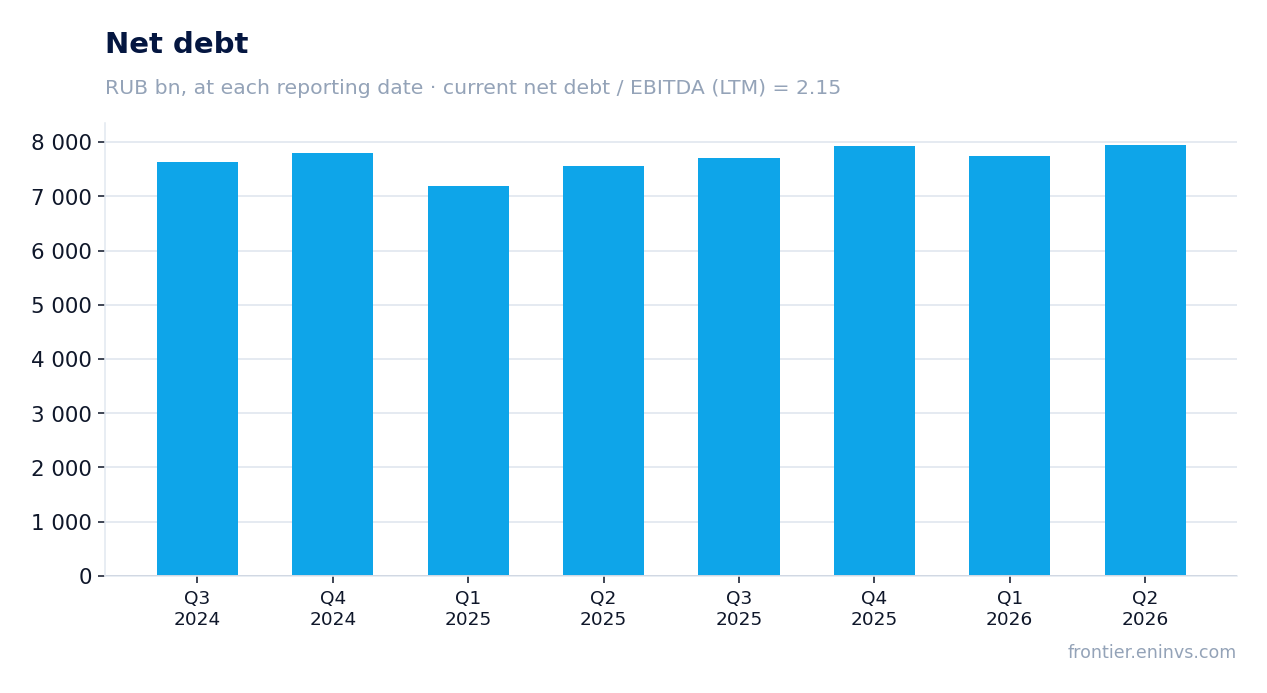
Net debt rose to RUB 7,954.0 bn, and net debt / LTM EBITDA stands at 2.15
Net debt at 30 June 2026 was RUB 7,954.0 bn against RUB 7,740.9 bn at 31 March 2026, an increase of RUB 213.1 bn over the quarter. Over 12 months net debt rose from RUB 7,552.1 bn at 30 June 2025 to RUB 7,954.0 bn at 30 June 2026, an increase of RUB 401.9 bn.
Net debt / LTM EBITDA stands at 2.15. That is a moderate level for a company with such capital intensity, but it reflects debt growing faster than EBITDA: over the last 12 months EBITDA was RUB 3,694.8 bn against net debt of RUB 7,954.0 bn. The company continues to fund capital expenditure and part of its payments with borrowed money.
Interest costs, however, declined: financial expenses for the quarter were RUB 98.7 bn against RUB 133.4 bn a year earlier. That eases the burden on profit but does not change the fact that absolute debt is rising.
No dividend was paid over the last 12 months, and a return to payouts is the key question for a holder
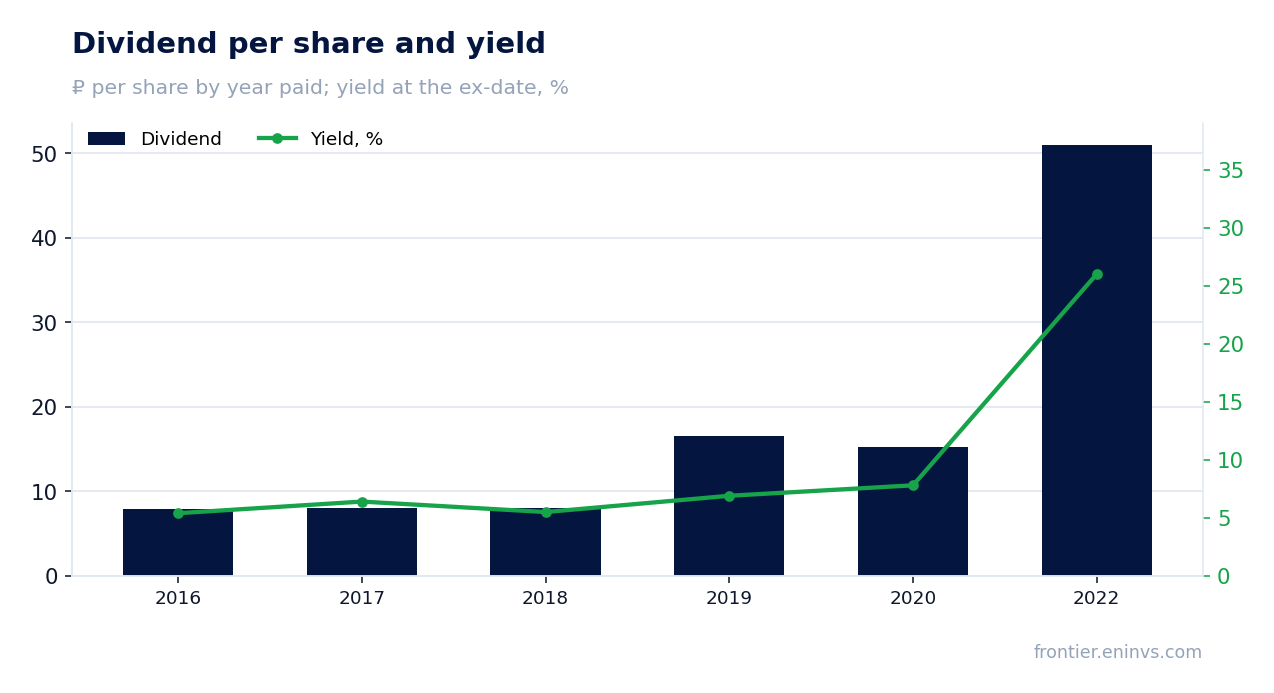
No dividend was paid over the last 12 months. The company has a history of high payouts: in 2022 the dividend was RUB 51.03 per share at a yield of 26.0% on the ex-date, in 2019 RUB 16.61 at 6.9%, and in 2020 RUB 15.24 at 7.8%. But payouts stopped after 2022, and the current situation does not point to a resumption this year.
Our estimate of a fair yield for this name is 12.0% per annum. At the current price of RUB 85.09 that would correspond to a dividend of about RUB 10.2 per share. The central bank key rate is 14.0%, so even our fair yield is below the rate – the market requires either growth or a resumption of payouts from the stock.
A return to dividends depends on the payout ratio, the profit base and one-off items. With a payout ratio of 1.0 of profit and last-twelve-month profit of RUB 1,246.8 bn, the potential dividend could be significant, but the company is currently directing funds to capital expenditure and debt reduction. That choice – between investment and payouts – determines whether the current valuation is realised.
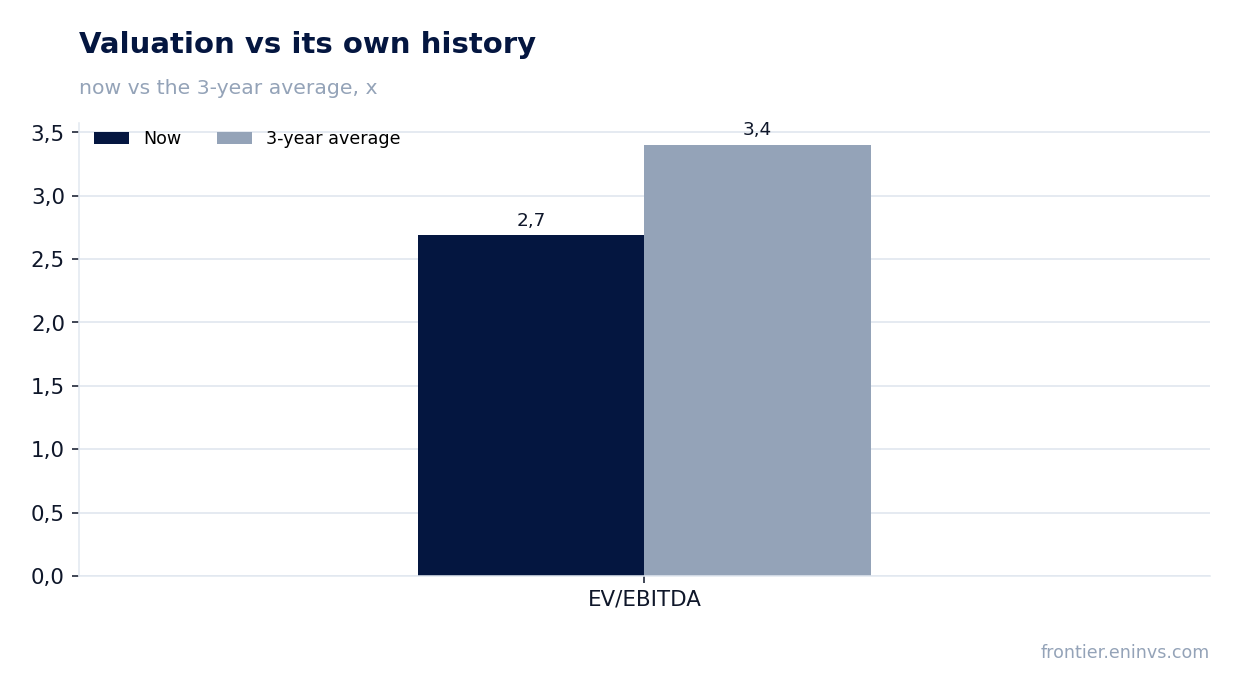
The stock trades at EV/EBITDA of 2.77 against its own three-year average of 3.40
At the current price EV/EBITDA LTM is 2.77, below its own three-year average of 3.40. That means the market values the business more cheaply than it did on average over the last three years. P/E LTM is 1.83, also pointing to a low valuation relative to earnings.
On the portal's model, which re-prices EBITDA at current commodity prices against the target EV/EBITDA, the upside to fair value is +63%. This is our own estimate, not a market consensus. It rests on the assumption that current oil and gas prices hold and that the multiple returns to historical levels.
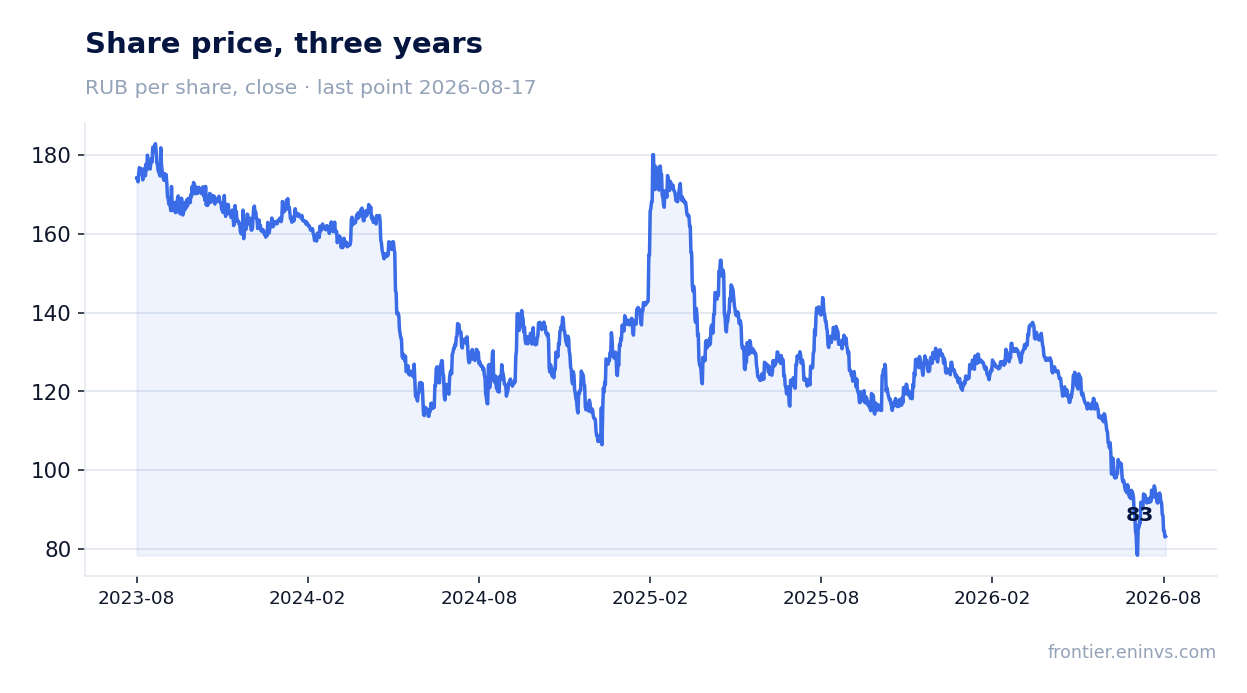
Since the release the stock has gained 13.3%, while the change on the release day itself was zero. The market is gradually pricing in the improved results, but the discount to its own history remains. The share is held in live model strategies on the portal, including RU Commodity-Upside, but that is a fact, not an argument for the valuation.
Valuation on the latest reported figures
| Metric | Value |
|---|---|
| Market cap | 2 285 bn ₽ |
| P/E (LTM) | 1.8 |
| EV/EBITDA (LTM) | 2.8 |
| P/B | 0.12 |
| Net debt / EBITDA (LTM) | 2.15 |
| Operating cash flow (LTM) | 2 895 bn |
| ROE | 11.3% |
| EV/EBITDA, 3-year average | 3.4 |
Dividend per share, ₽, and yield at the ex-date
| Year paid | Dividend | Yield |
|---|---|---|
| 2016 | 7.89 | 5.4% |
| 2017 | 8.04 | 6.4% |
| 2018 | 8.04 | 5.5% |
| 2019 | 16.61 | 6.9% |
| 2020 | 15.24 | 7.8% |
| 2022 | 51.03 | 26.0% |
Bottom line
Bottom line: the quarter was strong operationally – revenue rose 14.8%, EBITDA 35.4%, net profit 63.9%, and the EBITDA margin rose to 36.8%. But part of that growth came from the oil segment and financial income rather than the gas business, and the durability of those factors is not guaranteed. Net debt rose to RUB 7,954.0 bn, and no dividend was paid over the last 12 months, which limits the appeal for income investors. At the same time, EV/EBITDA of 2.77 against a three-year average of 3.40 and +63% upside on the portal's model suggest the market is pricing in a significant discount. The key question for a holder is the resumption of dividends and the company's ability to generate free cash flow at current capital expenditure levels.
Open the company's financial profile GAZP →
See also: market overview · valuation map · stock screeners