Nornickel: profit doubled, but margin, not metal, did all the work
31 июля «Норникель» раскрыл отчётность за первое полугодие 2026 года. Выручка выросла на 12,6% год к году до 635,6 млрд руб., EBITDA – на 49,9% до 293,9 млрд руб., чистая прибыль – на 108,4% до 153,3 млрд руб. Рентабельность по EBITDA поднялась до 46,2% против 34,7% годом ранее, и именно маржа, а не объёмы, обеспечила почти весь прирост прибыли. При мультипликаторе EV/EBITDA 5,4 против собственного трёхлетнего среднего 6,3 и оценке дивиденда за текущий год в 11,1% доходности бумага выглядит скорее привлекательно, чем нейтрально.
Key takeaways
— Revenue added 12.6%, but metal is the smaller part of that gain
— EBITDA grew 49.9% on revenue up 12.6% – the gap came from margin
— Net profit doubled, and part of that is the low base of last year
— Operating cash flow of RUB 255.0 bn covers capex of RUB 107.1 bn more than twice over
— Net debt of RUB 911.2 bn is 1.76x LTM EBITDA
— We estimate the dividend for the current year at RUB 14.14 per share – an 11.1% yield
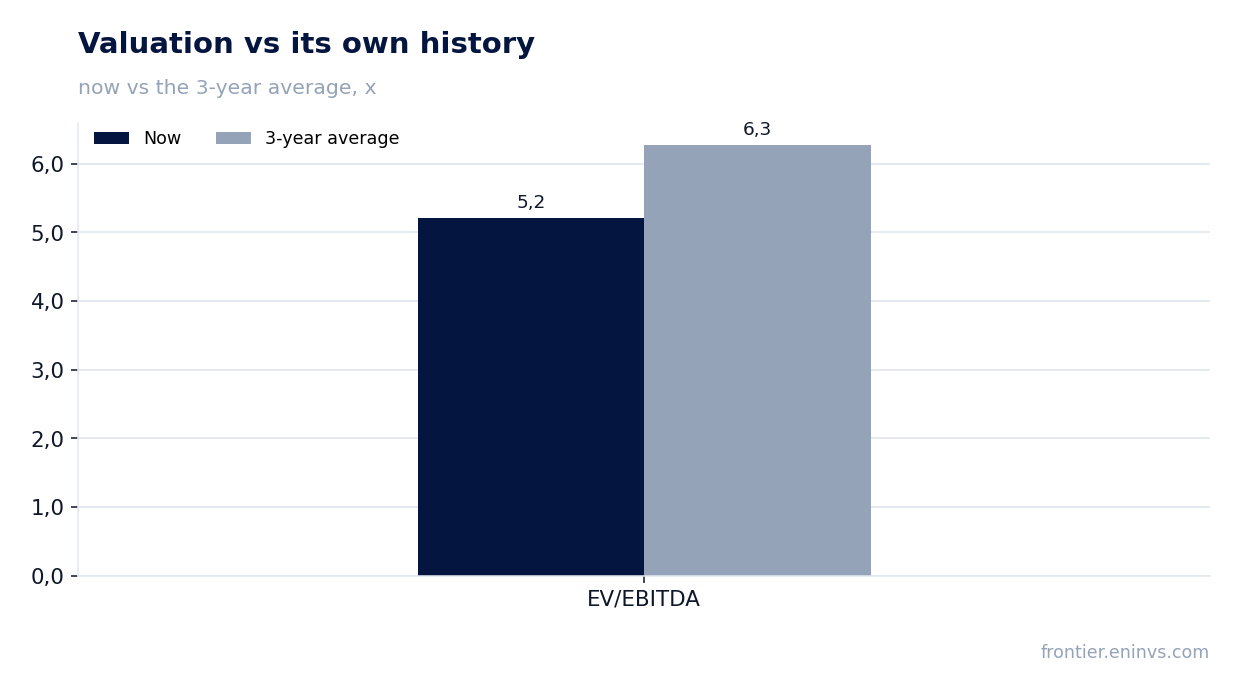
— EV/EBITDA of 5.4 against its own three-year average of 6.3 – a discount to its history
Attractiveness
Key figures, RUB bn
| Metric | H1 2025 | H1 2026 | Change |
|---|---|---|---|
| Revenue | 565 | 636 | +12.6% |
| EBITDA | 196 | 294 | +49.9% |
| Operating profit | 139 | 235 | +69.5% |
| Net profit | 73.5 | 153 | +108.4% |
| Operating cash flow | 244 | 255 | +4.5% |
| Capex | 97.2 | 107 | +10.2% |
| EBITDA margin | 34.7% | 46.2% | +11.5 pp |
| Net margin | 13.0% | 24.1% | +11.1 pp |
Revenue added 12.6%, but metal is the smaller part of that gain
Revenue for the first half of 2026 came to RUB 635.6 bn, up 12.6% year on year. Metal revenue in dollar terms rose from USD 6,100 mn to USD 7,862 mn, or 28.9%. The gap between the rouble and dollar growth rates is explained by the stronger rouble: the average rate for the half-year was 76.39 RUB/USD against 87.03 RUB/USD a year earlier.
Within metal revenue, the Norilsk segment made the main contribution: USD 3,225 mn against USD 2,581 mn a year earlier, up 25.0%. The Kola segment added 29.2%, from USD 2,767 mn to USD 3,575 mn. The Trans-Baikal segment grew 45.5%, from USD 730 mn to USD 1,062 mn. All three segments showed double-digit dollar growth, meaning both prices and volumes contributed, not just translation.
In roubles, however, the picture is more modest: the stronger rouble ate into the dollar growth. The company sells metals for foreign currency but reports in roubles, so a stronger rouble makes rouble revenue grow more slowly than dollar revenue. This is not a one-off – the exchange rate remains a key variable for Nornickel's rouble results.
EBITDA grew 49.9% on revenue up 12.6% – the gap came from margin
EBITDA for the first half of 2026 came to RUB 293.9 bn, up 49.9% year on year. With revenue up 12.6%, such a gap means almost all of the EBITDA gain came from profitability, not volumes. The EBITDA margin rose to 46.2% against 34.7% a year earlier – an increase of 11.5 percentage points.
What drove such a jump in margin? The report shows that the cost of metals sold rose from USD 3,244 mn to USD 3,761 mn, or 15.9%, slower than metal revenue, which added 28.9%. This is operating leverage: when metal prices rise, costs rise more slowly, and the margin expands. Cash operating costs within cost of sales rose from USD 2,555 mn to USD 3,216 mn, but their share of revenue declined.
It is also worth noting that last year's margin was depressed by a non-financial asset impairment loss of USD 389 mn. This year impairment was USD 102 mn – USD 287 mn less. This is a one-off factor that improved the comparison but is not a sustainable driver. Without it, EBITDA growth would have been more modest, although the margin would still have expanded on prices.
Net profit doubled, and part of that is the low base of last year
Net profit for the first half of 2026 came to RUB 153.3 bn, up 108.4% year on year. The net margin rose to 24.1% against 13.0% a year earlier. Such growth looks impressive, but it is important to understand what it consists of.
Besides the already mentioned reduction in impairment, profit was helped by lower financial expenses: from USD 553 mn to USD 373 mn. Interest expense net of capitalised interest fell from USD 362 mn to USD 157 mn – the company reduced its debt burden and refinanced at lower rates. This is a sustainable improvement, but it is limited: the capitalisation rate fell from 16.1% to 10.2%, reflecting the general decline in rates in the economy.
Foreign exchange differences worked against profit: a loss of USD 94 mn against a gain of USD 105 mn a year earlier. This is a swing of USD 199 mn, which partly offset the improvement from impairment and interest. The effective tax rate remained at 25%, in line with the statutory rate in Russia.
Thus, the doubling of net profit is a combination of three factors: margin expansion at the operating level, reduced impairment, and lower interest expenses. The first factor is sustainable as long as metal prices remain high; the second is one-off; the third is the result of debt management.
Operating cash flow of RUB 255.0 bn covers capex of RUB 107.1 bn more than twice over
Operating cash flow for the first half of 2026 came to RUB 255.0 bn, while capital expenditures were RUB 107.1 bn. A ratio of more than two to one means the company generates enough cash to fund investments without increasing debt. This is an important indicator of earnings quality: EBITDA may be high, but if it does not convert into cash, there is nothing to pay dividends with.
In dollar terms, operating cash flow was USD 2,507 mn against USD 2,532 mn a year earlier – a slight decline of 1.0%. This contrasts with EBITDA growth of 49.9% and is explained by working capital growth: receivables rose by USD 476 mn, inventories by USD 224 mn. The company was growing sales, and part of the revenue settled in receivables.
Capital expenditures in dollar terms rose from USD 1,095 mn to USD 1,361 mn, or 24.3%. This is in line with the stated development strategy, but it is important that even with such growth, free cash flow remains solid. The acquisition of property, plant and equipment and intangible assets by segment shows that the bulk of investment goes to the Norilsk segment – USD 842 mn out of USD 1,398 mn.
Free cash flow after capex is therefore around RUB 148 bn for the half-year. This is enough to pay dividends, but not with a large margin, given that part of the profit goes to debt servicing and taxes.
Net debt of RUB 911.2 bn is 1.76x LTM EBITDA
Net debt as of 30 June 2026 was RUB 911.2 bn. The ratio of net debt to LTM EBITDA is 1.76. This is a moderate level for a metals company: it is below 2.0, which is usually considered comfortable, but above 1.0, which would provide a cushion in case of falling prices.
Debt dynamics: as of 31 December 2025, net debt was RUB 904.4 bn, meaning it grew by RUB 6.8 bn over the half-year – insignificantly. Over 12 months, from 30 June 2025, net debt rose from RUB 819.5 bn to RUB 911.2 bn, or RUB 91.7 bn. The increase over the year is explained by the investment programme and dividend payments, but it does not look threatening against the backdrop of EBITDA growth.
Debt structure: long-term loans and borrowings amount to USD 5,946 mn, short-term – USD 4,503 mn. Cash and equivalents – USD 1,917 mn. The company has a significant amount of short-term debt that needs refinancing, but it has market access, as evidenced by the decline in interest expenses.
Interest expense net of capitalised interest fell to USD 157 mn from USD 362 mn a year earlier. This is the result of both a reduction in debt in absolute terms and lower rates. With the key rate at 14.0%, the company borrows at a rate below that, indicating its high credit quality.
We estimate the dividend for the current year at RUB 14.14 per share – an 11.1% yield
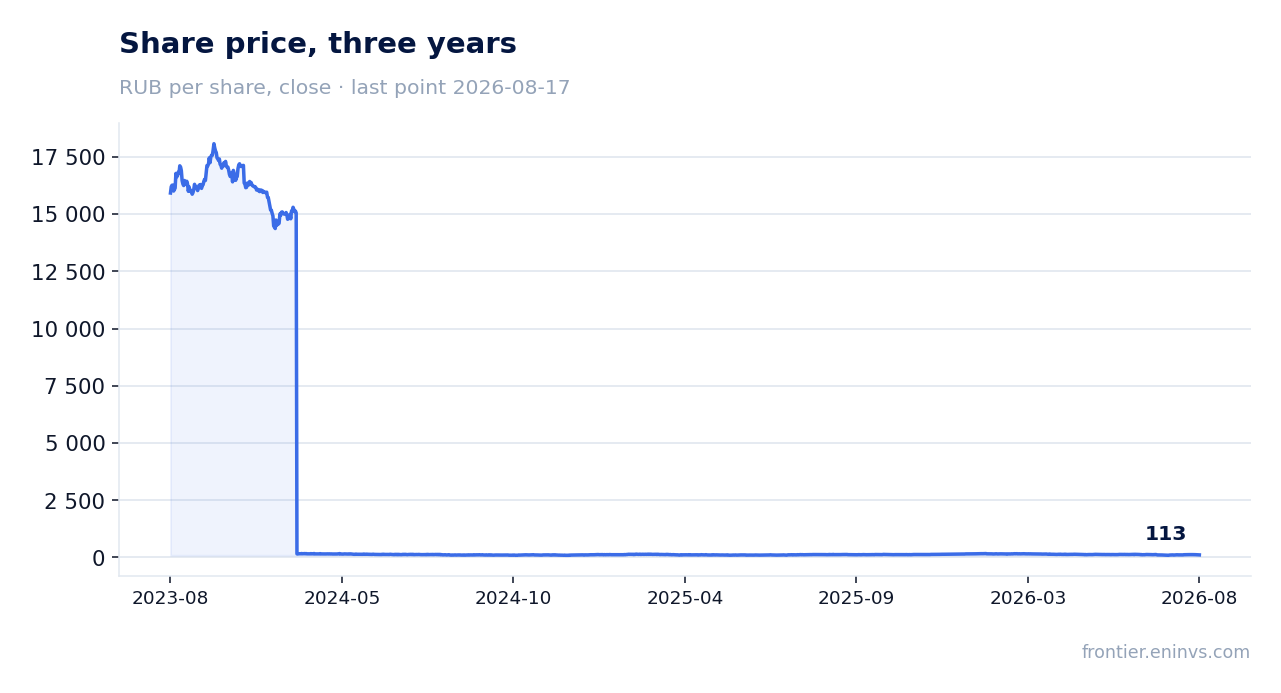
Over the last 12 months Nornickel paid no dividends – the payout for the last year was RUB 0.0 per share. However, in the current calendar year, RUB 1.85 per share has already been paid. This creates an unusual situation: the current dividend yield on actual payments is zero, but the company is returning to payouts.
Our estimate of the dividend for the current financial year (to be paid next year) is RUB 14.14 per share. We base this on LTM net profit (RUB 277.9 bn), a payout ratio of 0.778 embedded in our model, and the number of shares. This is our estimate, not a board decision; the board will decide based on actual profit and cash flow. At the current price of RUB 114.44, this gives a yield of 11.1%.
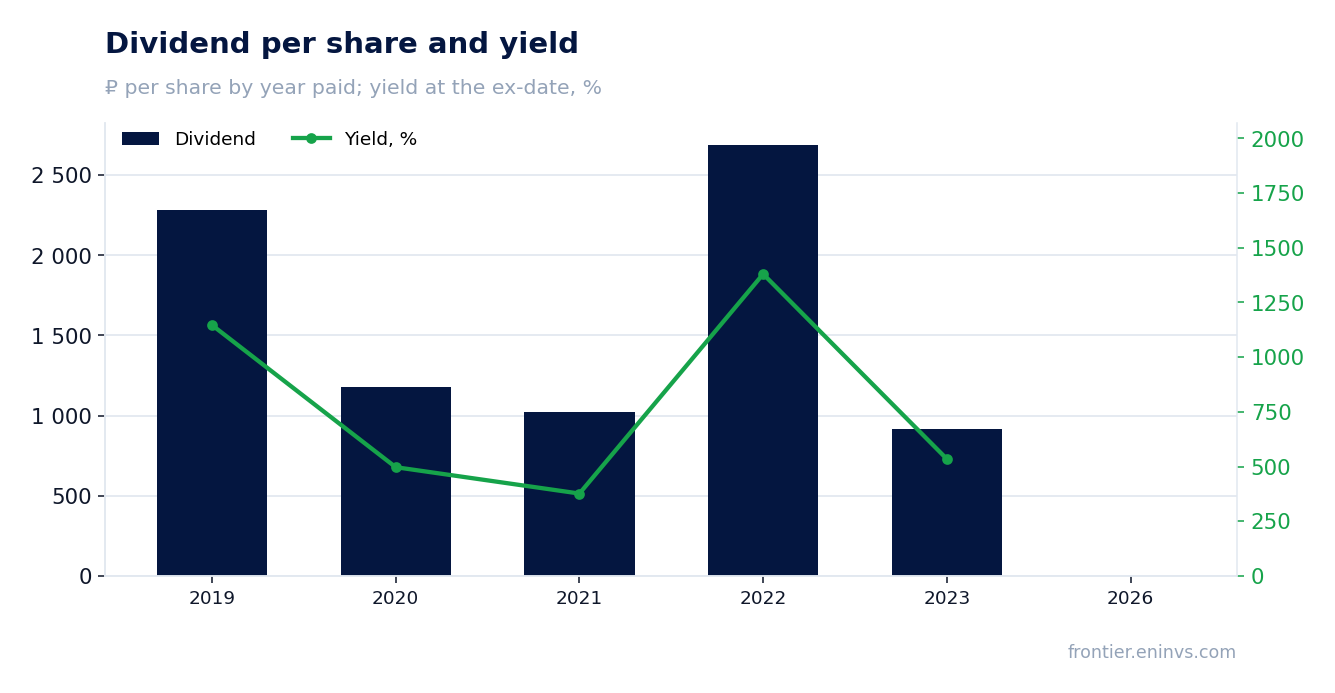
The yield we consider fair for this name is 12.0%. Thus, the dividend estimate gives a yield slightly below fair, but still above the key rate of 14.0%? No, 11.1% is below 14.0%. This means that at the current price the dividend does not cover the risk-free rate. However, Nornickel's historical dividend yield has been extremely high: in 2019–2023, payouts gave from 376% to 1380% per share in the year of payment, reflecting both high profits and low share prices in certain periods.
What could make the payout smaller? A decline in profit due to falling metal prices, rising capital expenditures, the need to direct more money to debt servicing. The payout ratio of 0.778 is our model; the company may decide otherwise. It is also important that the dividend for the current year has not yet been declared, and our estimate may differ from the actual decision.
EV/EBITDA of 5.4 against its own three-year average of 6.3 – a discount to its history
The current EV/EBITDA multiple for the last 12 months is 5.4. The three-year average of this multiple is 6.3. This means the stock trades below its historical norm: the market values each rouble of EBITDA cheaper than on average over the last three years. The gap is about 14%.
The P/E multiple for the last 12 months is 7.0. With LTM net profit of RUB 277.9 bn and a market capitalisation of RUB 1,945.6 bn, this is a low level, especially given the net margin of 24.1% in the first half. Return on equity (ROE) is 32.1%, indicating efficient use of capital.
Our fair value model, based on re-pricing EBITDA at current commodity prices and a target EV/EBITDA, gives an upside to the share price of -1%. This means that according to our model, the stock is fairly valued, and the current price is close to the calculated value. The model is not a market consensus or a target price; it is our own tool.
Comparison with history shows that the discount to the average EV/EBITDA may be related to market expectations for future metal prices or to risks that the market prices in. However, the current multiple is below average, which creates preconditions for a re-rating if the company continues to deliver strong results.
Valuation on the latest reported figures
| Metric | Value |
|---|---|
| Market cap | 1 946 bn ₽ |
| P/E (LTM) | 7.0 |
| EV/EBITDA (LTM) | 5.4 |
| P/B | 2.78 |
| Net debt / EBITDA (LTM) | 1.76 |
| Operating cash flow (LTM) | 522 bn |
| ROE | 32.1% |
| EV/EBITDA, 3-year average | 6.3 |
Dividend per share, ₽, and yield at the ex-date
| Year paid | Dividend | Yield |
|---|---|---|
| 2019 | 2280.54 | 1146.6% |
| 2020 | 1180.55 | 496.9% |
| 2021 | 1021.22 | 376.4% |
| 2022 | 2689.39 | 1379.9% |
| 2023 | 915.33 | 534.3% |
| 2026 | 1.85 | — |
| Our estimate, current year | 14.14 | 11.1% on the current price |
Bottom line
Nornickel delivered a strong first half of 2026: revenue up 12.6%, EBITDA up 49.9%, net profit up 108.4%. However, the doubling of profit is not only operational success: part of it came from a reduction in impairment of USD 287 mn and lower interest expenses. The sustainable driver is margin expansion to 46.2% through operating leverage at high metal prices. Debt burden is moderate – 1.76x LTM EBITDA – and operating cash flow covers capital expenditures more than twice over. We estimate the dividend for the current year at RUB 14.14 per share, giving an 11.1% yield – below the 12.0% yield we consider fair, but above historical levels. At EV/EBITDA of 5.4 against a three-year average of 6.3, the stock trades at a discount to its history. The question for a holder now is whether the margin will hold at current levels if metal prices correct, and whether the company can keep cash flow at a level sufficient to pay dividends.
Open the company's financial profile GMKN →
See also: market overview · valuation map · stock screeners