Head Hunter: flat revenue, but profit and dividends hold their ground

On 28 September Head Hunter released its Q2 2026 results. Revenue was flat year-on-year at RUB 10,149.5 mn, EBITDA added 1.3% to RUB 4,910.9 mn, and net profit rose 4.2% to RUB 4,361.6 mn. The stock trades at a P/E LTM of 7.1 and EV/EBITDAC LTM of 6.7 – below its own three-year average EV/EBITDA of 7.4 – while the 16% dividend yield is only below the 18.8% we consider fair on our estimate for next year. We view the share as attractive for dividend holders, but revenue growth remains nil.
Key takeaways
— Revenue has been flat for a second consecutive quarter: RUB 10,149.5 mn vs RUB 10,148.6 mn a year earlier
— EBITDA rose 1.3% to RUB 4,910.9 mn, with margin up to 47.8% from 47.2%
— Net profit added 4.2% to RUB 4,361.6 mn, margin reaching 43.0%
— Operating cash flow fell to RUB 3,362.9 mn, while capital expenditure rose to RUB 646.8 mn
— Net debt stood at RUB 5,746.0 mn on 30 June 2026, versus a negative position a year earlier
— Dividend for 2025 was RUB 233.0 per share; we estimate RUB 433.0 for 2026
— Valuation: P/E LTM 7.1, EV/EBITDAC LTM 6.7 versus a three-year average EV/EBITDA of 7.4
Attractiveness
Key figures, RUB bn
| Metric | Q2 2025 | Q2 2026 | Change |
|---|---|---|---|
| Revenue | 10.1 | 10.1 | +0.0% |
| EBITDA | 4.79 | 4.85 | +1.3% |
| Operating profit | 4.37 | 4.47 | +2.2% |
| Net profit | 4.18 | 4.36 | +4.2% |
| Operating cash flow | 4.56 | 3.36 | -26.2% |
| Capex | 0.15 | 0.65 | +319.1% |
| EBITDA margin | 47.2% | 47.8% | +0.6 pp |
| Net margin | 41.2% | 43.0% | +1.8 pp |
Revenue has been flat for a second consecutive quarter: RUB 10,149.5 mn vs RUB 10,148.6 mn a year earlier
In Q2 2026 Head Hunter's revenue was RUB 10,149.5 mn, virtually unchanged from RUB 10,148.6 mn a year earlier. Year-on-year growth was zero – after +0.4% in Q4 2025. The pace has barely changed: the company has now shown no revenue growth for two consecutive quarters.
For context, in Q4 2024 revenue grew 22.8% year-on-year. The slowdown to zero has occurred over the past eighteen months. The reason is that the online recruitment market, where the company operates, has stopped growing at the pace seen in 2023–2024. The report provides no further detail.
Flat revenue is the key fact of the report. Yet the business remains highly profitable: EBITDA margin of 47.8%, net margin of 43.0%. But without revenue growth, further profit gains can only come from cost cuts or one-offs, not from business expansion.
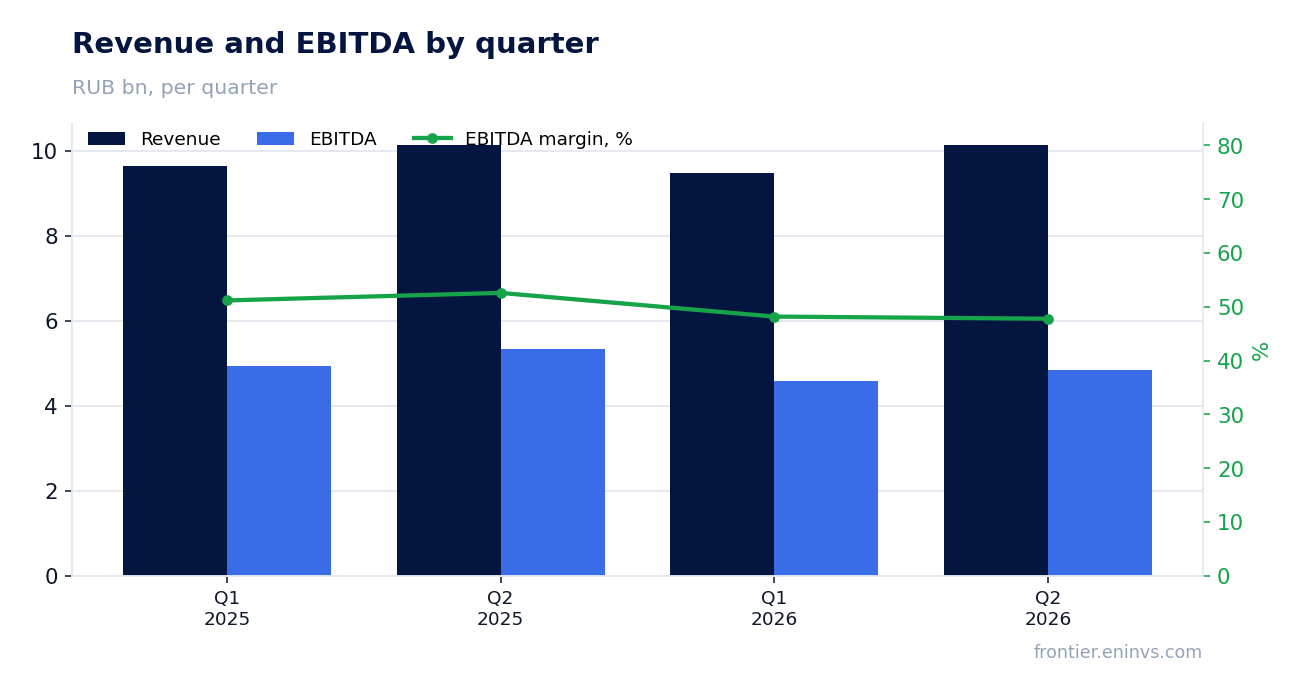
EBITDA rose 1.3% to RUB 4,910.9 mn, with margin up to 47.8% from 47.2%
EBITDA in Q2 2026 was RUB 4,910.9 mn, up 1.3% year-on-year. EBITDA growth on flat revenue means the company cut some costs or benefited from operating leverage. The EBITDA margin rose to 47.8% from 47.2% a year earlier.
The 0.6 percentage point margin gain is modest but steady. With revenue not growing, every point of margin comes from savings. The report does not disclose which cost line was reduced, so the specific source of savings cannot be named.
Operating profit in Q2 was RUB 4,470.0 mn versus RUB 4,375.0 mn a year earlier. This is also growth, though smaller than EBITDA. The difference between EBITDA and operating profit is depreciation, which remains stable.
Net profit added 4.2% to RUB 4,361.6 mn, margin reaching 43.0%
Net profit in Q2 2026 was RUB 4,361.6 mn, up 4.2% year-on-year. The net margin rose to 43.0% from 41.2%. Profit growing faster than EBITDA is likely due to positive FX effects or lower interest expenses, but the report does not specify the cause.
Profit has grown for four consecutive quarters despite stagnant revenue. This reflects high operating efficiency and possibly one-off factors. Without disclosure, the sustainability of profit growth cannot be asserted.
Over the trailing twelve months, net profit was RUB 18,167.2 mn. This figure is used for dividend and multiple calculations. It covers four quarters, not just the reported one.
Operating cash flow fell to RUB 3,362.9 mn, while capital expenditure rose to RUB 646.8 mn
Operating cash flow in Q2 2026 was RUB 3,362.9 mn, well below last year's RUB 4,555.7 mn. A 26% decline on almost flat revenue and rising profit means the company faced working capital outflows or delayed payments. The report does not disclose the reason.
Capital expenditure rose to RUB 646.8 mn from RUB 154.3 mn a year earlier. That is more than a fourfold increase. It may relate to infrastructure or development investments, but specific projects are not named. Rising capex against falling operating cash flow reduces free cash flow.
Free cash flow thus fell significantly – from about RUB 4,401 mn a year earlier to RUB 2,716 mn. This matters for the dividend story, as the company pays generous dividends. However, over the trailing twelve months operating cash flow remains high at RUB 20,887.2 mn, covering both capex and dividends.
Net debt stood at RUB 5,746.0 mn on 30 June 2026, versus a negative position a year earlier
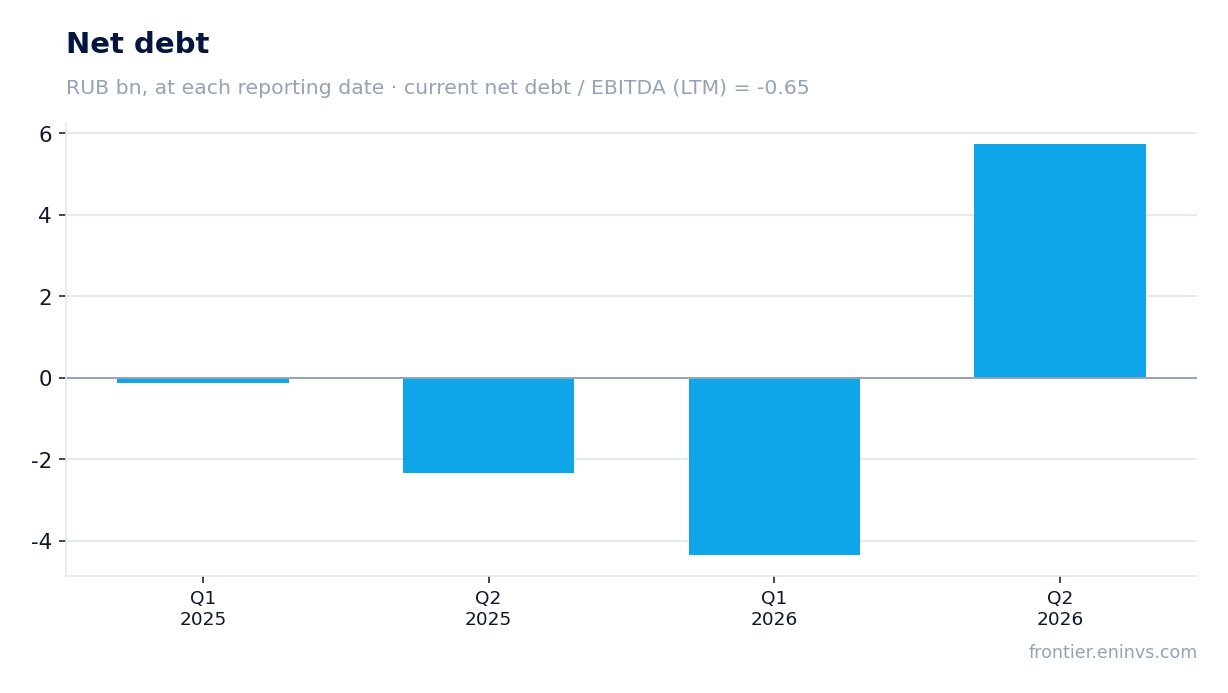
As of 30 June 2026, Head Hunter's net debt was RUB 5,746.0 mn. A year earlier, on 30 June 2025, the company had negative net debt of minus RUB 10,157.0 mn. The twelve-month change is plus RUB 15,903.0 mn. This means the company shifted from a net cash position to debt.
Compared with 31 December 2025, net debt rose from minus RUB 2,195.0 mn to RUB 5,746.0 mn, i.e. by RUB 7,941.0 mn over six months. This increase may relate to dividend payments, capital expenditure or acquisitions. The report does not specify the source.
The net debt to EBITDA LTM ratio is 0.32. This is a low level – debt burden is insignificant. However, comparison with the previous value of this ratio is not possible, as it is not in the facts. We can only state that the current level is comfortable for a company with EBITDA LTM of RUB 18,031.8 mn.
Dividend for 2025 was RUB 233.0 per share; we estimate RUB 433.0 for 2026
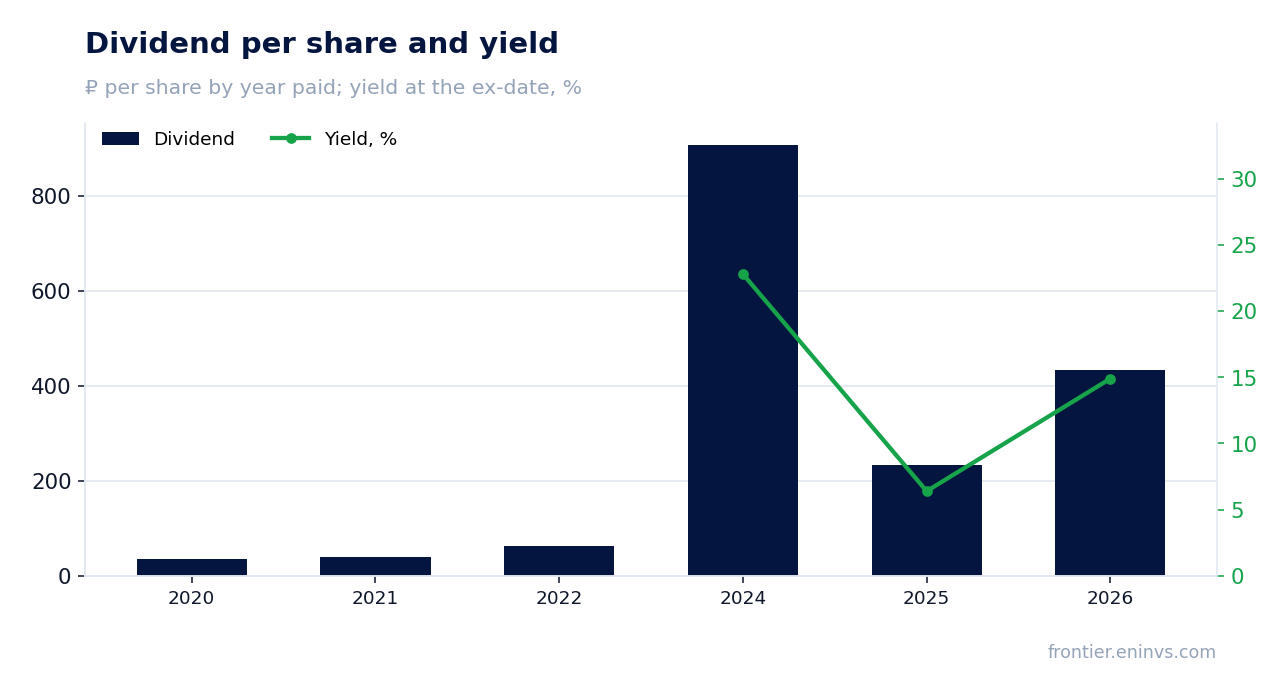
For 2025 Head Hunter paid a dividend of RUB 233.0 per share. At the ex-date price of RUB 3,618.0, the yield was 6.4%. For 2026, we estimate the dividend at RUB 433.0 per share – this is our forecast, not a board decision. It is based on an 81% payout of LTM profit, consistent with last year's payout ratio.
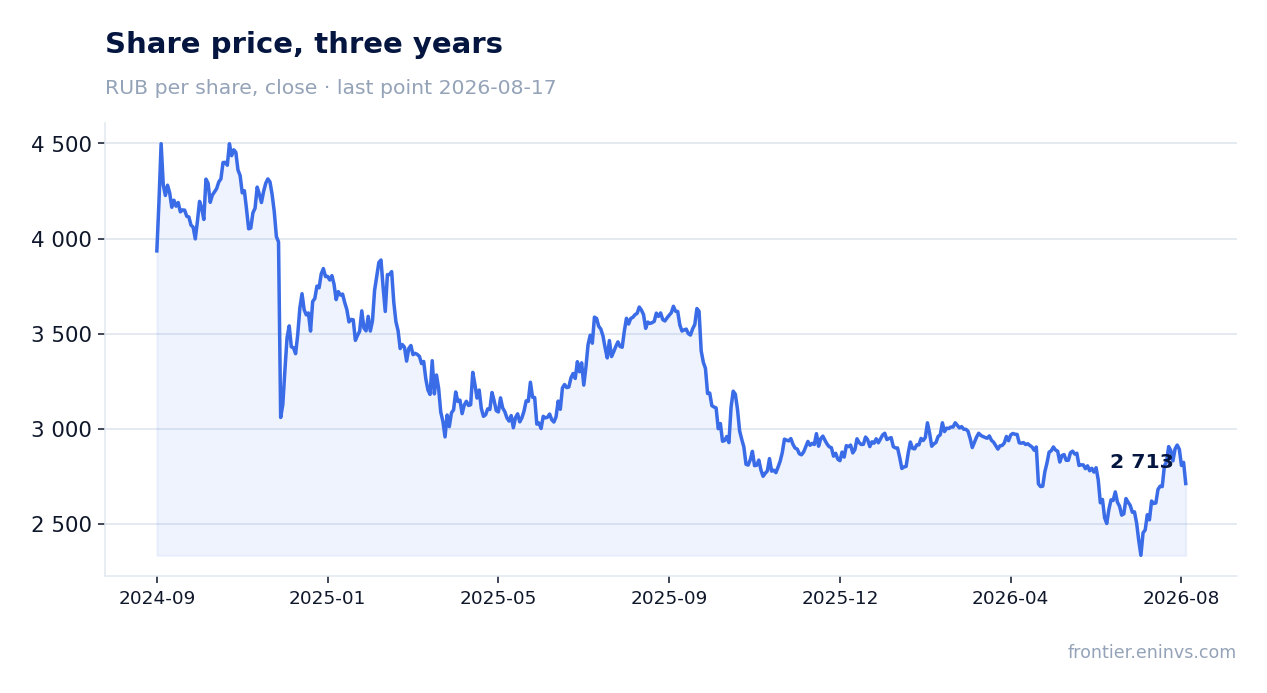
At the current price of RUB 2,745.0, the expected yield is 16.0%. This is well above the key rate of 14.0% and above the average yield in recent years. For comparison: in 2024 the yield was 22.8%, in 2025 – 6.4%. Our estimate for 2026 is 16.1% on the current price. The yield we consider fair for this name is 18.8%.
The dividend could be smaller if LTM profit declines or if the company decides to allocate more funds to investment. Rising capital expenditure in the reported quarter is a risk factor for the dividend. However, the current trailing twelve-month operating cash flow of RUB 20,887.2 mn comfortably covers the payouts.
Valuation: P/E LTM 7.1, EV/EBITDAC LTM 6.7 versus a three-year average EV/EBITDA of 7.4
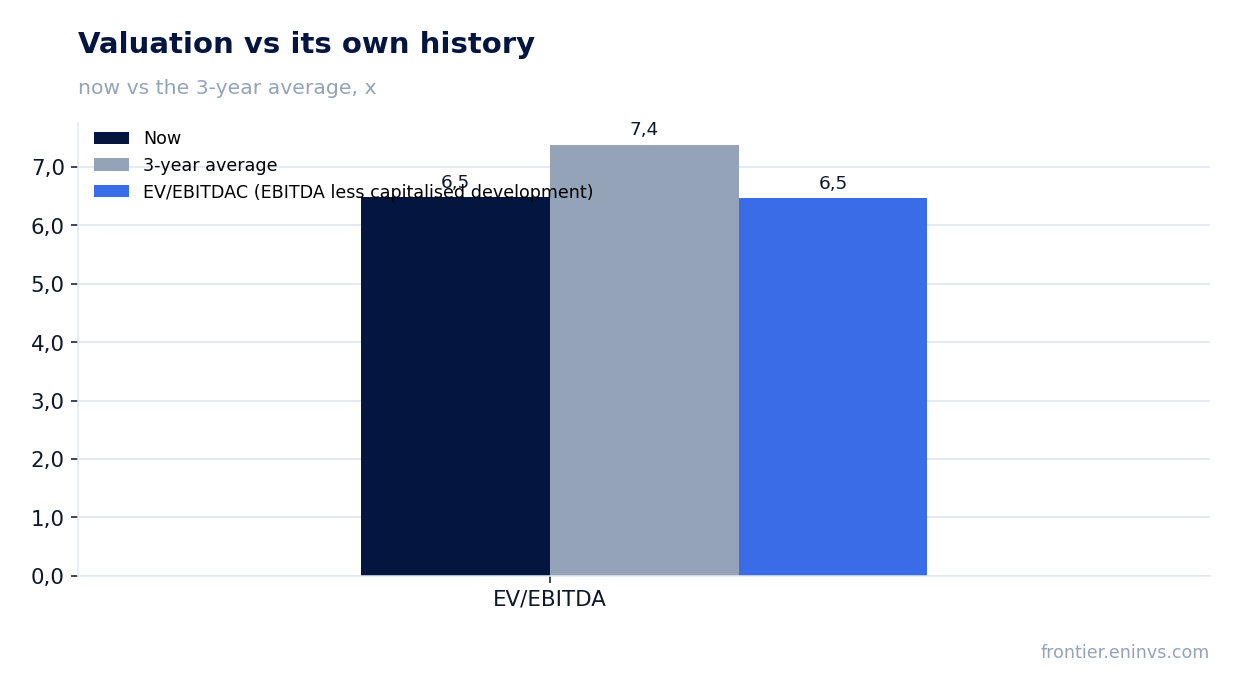
By our calculations, EV/EBITDAC LTM is 6.7. This is below the three-year average EV/EBITDA of 7.4. Since the company capitalises development, EBITDAC is a more conservative measure than EBITDA, and its current value points to undervaluation relative to its own history. P/E LTM is 7.1.
The EV/EBITDA LTM multiple is 6.5. It is also below the three-year average of 7.4. This means the market values the business cheaper than on average over the past three years. The reason is likely zero revenue growth, which dampens investor expectations.
Our fundamental valuation model, based on EBITDA growth and a target multiple, implies a -6% downside to fair value. This means that on the portal's model the stock trades slightly above its fair value. However, the 16% dividend yield may compensate for this for holders.
Valuation on the latest reported figures
| Metric | Value |
|---|---|
| Market cap | 129 bn ₽ |
| P/E (LTM) | 7.1 |
| EV/EBITDA (LTM) | 6.5 |
| EV/EBITDAC (EBITDA less capitalised development) | 6.7 |
| P/B | 9.79 |
| Net debt / EBITDA (LTM) | 0.32 |
| Operating cash flow (LTM) | 20.9 bn |
| ROE | 151.6% |
| Dividend yield (12m) | 15.9% |
| EV/EBITDA, 3-year average | 7.4 |
Dividend per share, ₽, and yield at the ex-date
| Year paid | Dividend | Yield |
|---|---|---|
| 2020 | 36.13 | — |
| 2021 | 40.40 | — |
| 2022 | 63.00 | — |
| 2024 | 907.00 | 22.8% |
| 2025 | 233.00 | 6.4% |
| 2026 | 433.00 | 14.9% |
| Our estimate, current year | 438.92 | 16.1% on the current price |
Bottom line
Head Hunter delivered stable results: revenue is flat, but profit and margin improved slightly. The strengths are high profitability and low debt burden (0.32 EBITDA LTM). The weaknesses are zero revenue growth and declining operating cash flow. The 16% dividend yield on the current price looks attractive, but our estimate of the next dividend (RUB 433.0) is a forecast, not a guarantee. The stock suits dividend holders, but without a resumption of revenue growth, further capital appreciation is unlikely.
Open the company's financial profile HEAD →
See also: market overview · valuation map · stock screeners