Inkab Holding: margin doubled while revenue fell 15.9%, and it is not a one-off
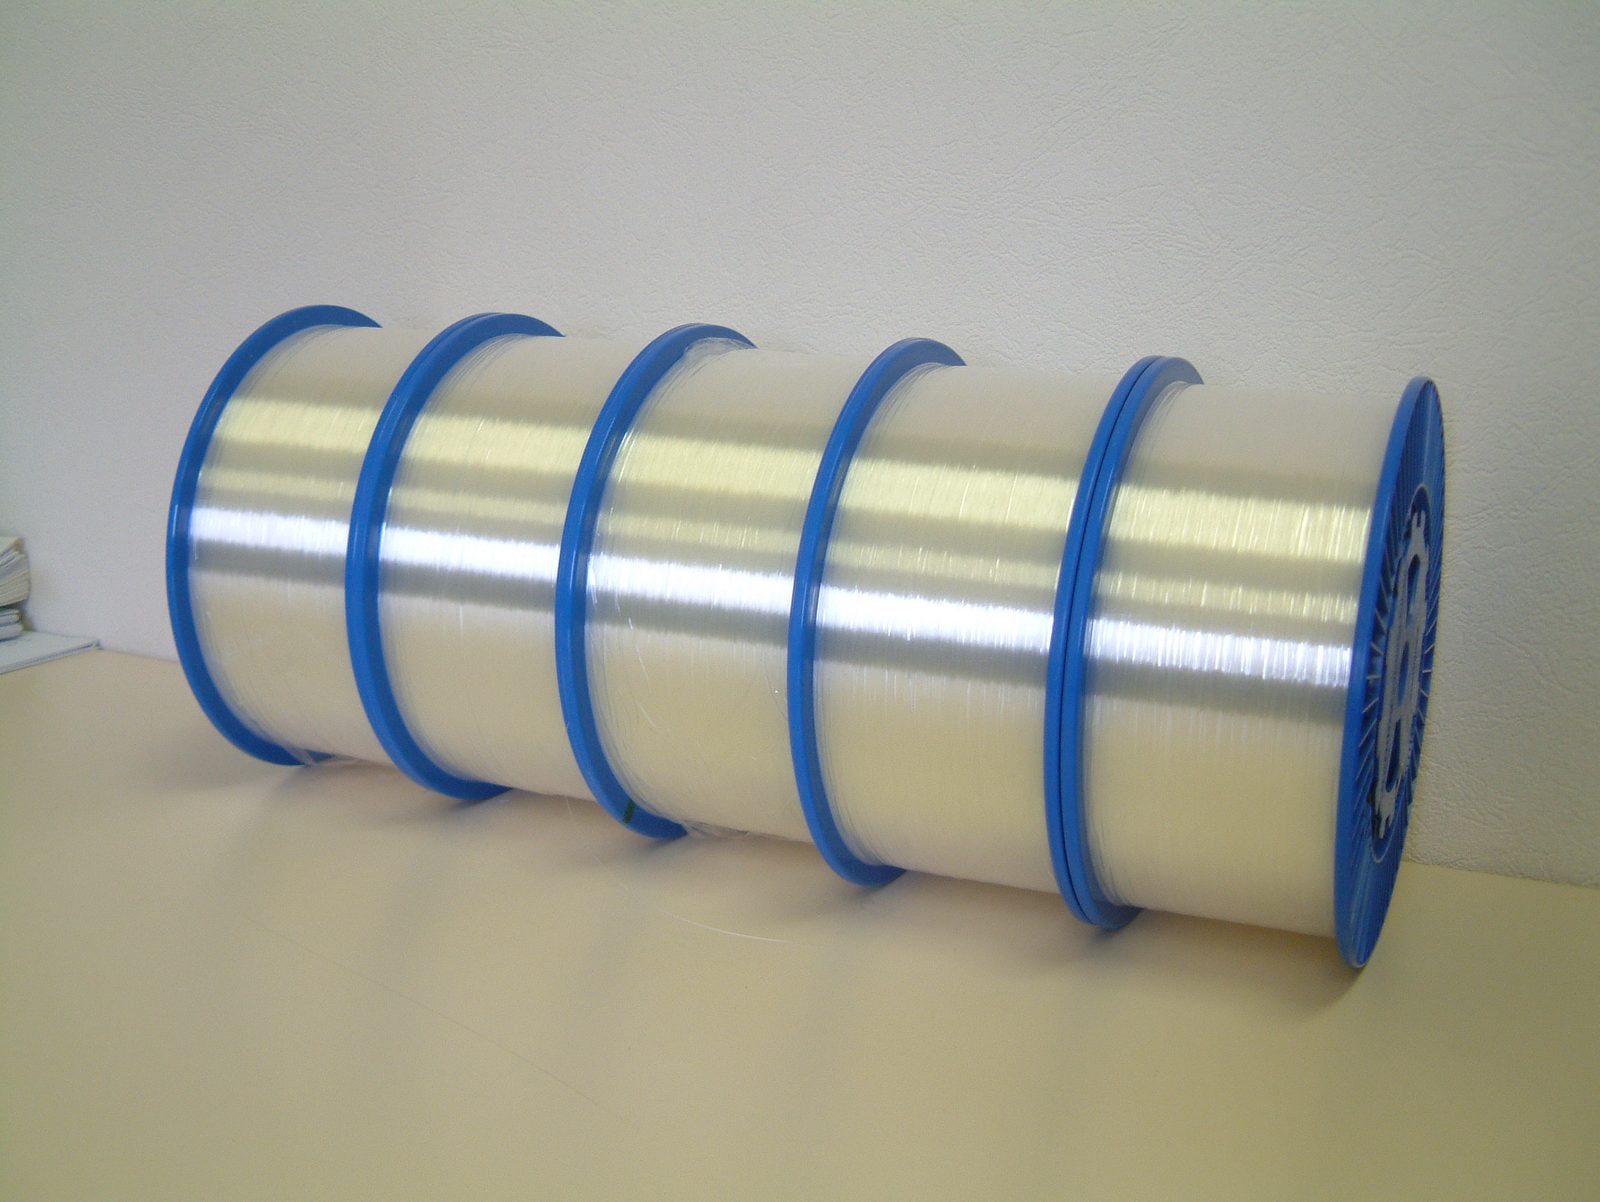
Inkab Holding reported H1 2026 results: revenue fell 15.9% year on year to RUB 2,120.0 mn, but EBITDA rose 57.1% to RUB 699.0 mn and net profit reached RUB 301.0 mn against a loss a year earlier. The EBITDA margin reached 33.0% versus 17.7%, the net margin 14.2% versus minus 8.9%, and leverage at 1.02x LTM EBITDA remains moderate. With P/E LTM at 10.9 and the portal model implying 46% upside, the share looks attractive, although the durability of the new margin against falling revenue is the main question for the story.
Key takeaways
— Revenue fell 15.9% but EBITDA rose 57.1% – margin did all the work
— EBITDA margin of 33.0% versus 17.7% a year earlier – doubling on lower sales volume
— Net profit of RUB 301.0 mn against a loss a year earlier – margin 14.2% instead of minus 8.9%
— Net debt fell from RUB 3.8 bn at end-2025 to RUB 1.6 bn on 30 June 2026
— Leverage at 1.02x LTM EBITDA – debt is serviced with headroom
— P/E LTM 10.9 and EV/EBITDA LTM 6.4 – valuation does not look stretched
— The portal model implies 46% upside to the current price
Attractiveness
Key figures, RUB bn
| Metric | H1 2025 | H1 2026 | Change |
|---|---|---|---|
| Revenue | 2.52 | 2.12 | -15.9% |
| EBITDA | 0.45 | 0.70 | +57.1% |
| Operating profit | 0.34 | 0.61 | +81.2% |
| Net profit | -0.22 | 0.30 | to profit |
| EBITDA margin | 17.7% | 33.0% | +15.3 pp |
| Net margin | -8.9% | 14.2% | +23.1 pp |
Revenue fell 15.9% but EBITDA rose 57.1% – margin did all the work
In H1 2026 Inkab Holding's revenue was RUB 2,120.0 mn, 15.9% below the same period a year earlier. Lower sales in fibre-optic cable coincided with a sharp improvement in profitability: EBITDA rose 57.1% to RUB 699.0 mn.
This gap means the company sold less but earned substantially more per unit. Operating profit was RUB 607.0 mn on revenue of RUB 2,120.0 mn – about 28.6% of revenue, confirming a shift towards higher-margin orders or a reduction in low-margin deliveries.
For a holder, the important point is that profit growth was not accompanied by rising debt: net debt fell instead. The question is how durable the new sales mix is and whether the revenue decline reflects a one-off cut in less profitable contracts.
EBITDA margin of 33.0% versus 17.7% a year earlier – doubling on lower sales volume
The EBITDA margin in H1 2026 was 33.0% versus 17.7% a year earlier. The near-doubling on falling revenue indicates that the main contribution came from cost and sales structure rather than volume growth.
With revenue of RUB 2,120.0 mn and EBITDA of RUB 699.0 mn, the company retained a significant share of revenue after variable costs. Operating profit of RUB 607.0 mn shows that depreciation and other operating expenses did not erode this effect.
The durability of the 33.0% margin is the key question for the next report. If it holds near this level as revenue recovers, profit could grow multiple-fold; if it is a one-off from the order mix, the margin will revert to historical levels.
Net profit of RUB 301.0 mn against a loss a year earlier – margin 14.2% instead of minus 8.9%
Net profit in H1 2026 was RUB 301.0 mn at a net margin of 14.2%. A year earlier the company posted a loss at a margin of minus 8.9%, so the result reversed within a single year.
The gap between operating profit of RUB 607.0 mn and net profit of RUB 301.0 mn – about RUB 306.0 mn – covers interest, taxes and other items. This means debt service is still visible in the income statement but no longer overwhelms the operating result.
A net margin of 14.2% on revenue of RUB 2,120.0 mn is the level that, if the EBITDA margin holds, supports sustainable profit and possibly dividends in future, although the current dividend policy is not disclosed in the facts.
Net debt fell from RUB 3.8 bn at end-2025 to RUB 1.6 bn on 30 June 2026
Net debt on 30 June 2026 was RUB 1.6 bn versus RUB 3.8 bn on 31 December 2025 – a reduction of RUB 2.1 bn. Over twelve months, from 30 June 2025, debt fell from RUB 3.0 bn to RUB 1.6 bn, a reduction of RUB 1.4 bn.
Debt reduction alongside EBITDA growth means the company directed part of its earnings to repay obligations. This confirms the quality of profit: it did not get stuck in working capital or capex but reached the balance sheet.
Leverage at 1.02x LTM EBITDA is a moderate level that leaves room for manoeuvre. At such leverage interest expenses should not consume a significant share of operating profit, as the gap between operating and net profit shows.
Leverage at 1.02x LTM EBITDA – debt is serviced with headroom
The ratio of net debt to LTM EBITDA is 1.02. This is a level at which the company can service debt from current cash flow without strain.
For comparison: with LTM EBITDA of RUB 1,612.8 mn and net debt of RUB 1,640.0 mn, annual EBITDA almost fully covers the debt. This means that even if EBITDA falls by a third, leverage would remain below 1.5x, typically considered comfortable.
Low leverage matters against falling revenue: if sales continue to decline, the company has time to adjust without risking covenant breaches. However, the facts do not disclose covenant terms, so this remains a general judgement.
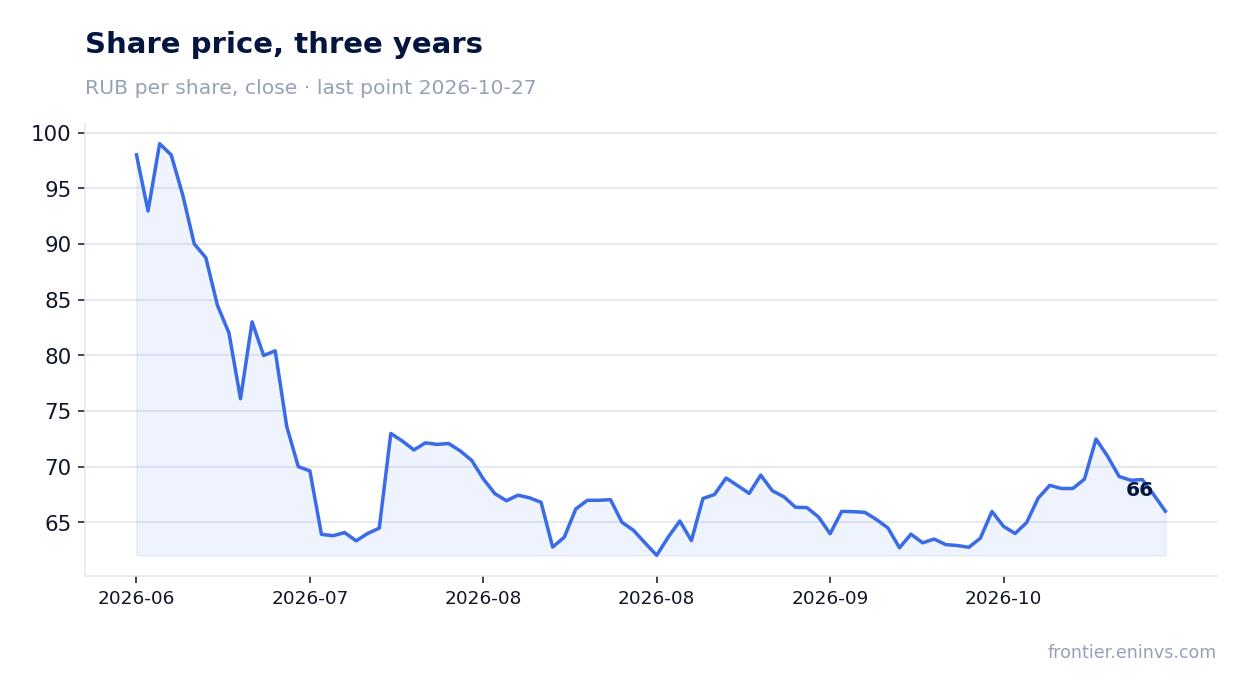
P/E LTM 10.9 and EV/EBITDA LTM 6.4 – valuation does not look stretched
With a market capitalisation of RUB 6,600.0 mn and LTM profit of RUB 605.0 mn, the P/E LTM is 10.9. EV/EBITDA LTM is 6.4 on LTM EBITDA of RUB 1,612.8 mn.
These multiples do not look high for a company that has just doubled its margin and reduced debt. However, they cannot be compared with its own three-year history: the facts contain no averages for prior periods.
The portal model implies 46% upside to the current price. This is our own model, not a market consensus, and it relies on EBITDA growth and a target multiple. At current multiples the market appears not to price in the durability of the new margin.
The portal model implies 46% upside to the current price
On the portal's model, the fair value of an Inkab Holding share is 46% above the current market price. The model links EBITDA growth to a target multiple and compares the result with the market capitalisation of RUB 6,600.0 mn.
This upside does not come from a re-rating of the multiple but from EBITDA growth: over the last twelve months the figure was RUB 1,612.8 mn, which at EV/EBITDA of 6.4 implies an enterprise value of about RUB 10.3 bn against the current market capitalisation of RUB 6.6 bn.
This is our estimate, not a market consensus. It materialises if the margin holds and revenue stops falling. If the margin reverts to 17.7%, LTM EBITDA will shrink and the upside will disappear.
Valuation on the latest reported figures
| Metric | Value |
|---|---|
| Market cap | 6.60 bn ₽ |
| P/E (LTM) | 10.9 |
| EV/EBITDA (LTM) | 6.4 |
| P/B | 2.44 |
| Net debt / EBITDA (LTM) | 1.02 |
| ROE | 3.0% |
Bottom line
The strong side of the report is the profit reversal: net profit of RUB 301.0 mn against a loss a year earlier, an EBITDA margin of 33.0% versus 17.7%, all while debt fell from RUB 3.8 bn to RUB 1.6 bn over six months. However, profit growth on a 15.9% revenue decline is a bet on the durability of the new margin, not on business growth. The P/E LTM of 10.9 and EV/EBITDA LTM of 6.4 do not look stretched, and the portal model implies 46% upside, but realising that upside depends on whether the margin holds in the next report. The verdict is attractive: the combination of low leverage, a doubled margin and a moderate multiple outweighs the risk of the margin reverting to historical levels.
Open the company's financial profile INCB →
See also: market overview · valuation map · stock screeners