Inter RAO: revenue up 14.1% but profit down 38% as margin normalises after an exceptional quarter
On 28 September Inter RAO released its second-quarter 2026 results. Revenue rose 14.1% year on year to RUB 430.1 bn, but net profit fell 38.0% to RUB 22.2 bn and EBITDA declined 25.8% to RUB 28.6 bn. The EBITDA margin narrowed to 6.6% from 10.2% a year earlier. The stock looks attractive for income-oriented investors: a net cash position of RUB 155.4 bn and an expected yield of about 12.4% on the current price outweigh the weakness in quarterly profit.
Key takeaways
— Revenue grew 14.1% year on year, but this is a deceleration from 18.6% in the previous quarter
— EBITDA fell 25.8% and the margin compressed to 6.6% — the year-earlier quarter was exceptionally strong
— Net profit fell 38.0% but remains positive at RUB 22.2 bn
— The company retains a net cash position of RUB 155.4 bn despite rising capital expenditure
— Capex rose to RUB 54.3 bn while operating cash flow was only RUB 10.2 bn
— Dividend yield of about 12.4% on the current price is above the fair yield of 10.5%
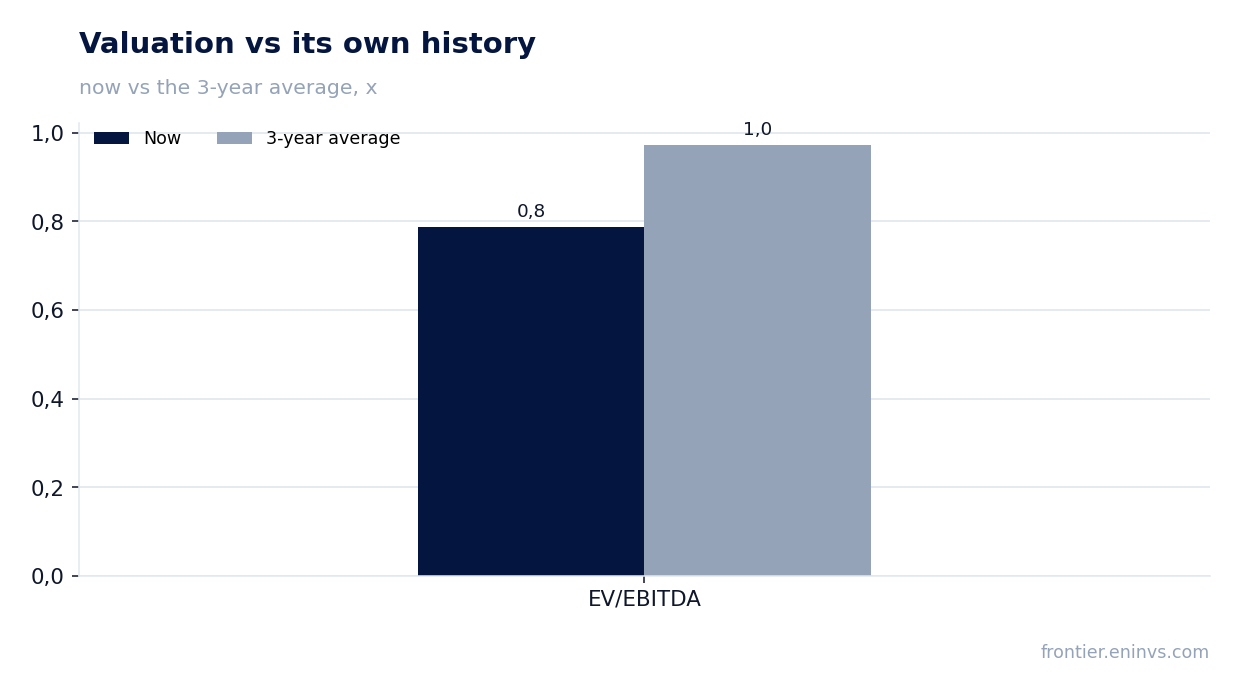
— EV/EBITDA LTM of 0.064 is extremely low versus the three-year average of 0.296
Attractiveness
Key figures, RUB bn
| Metric | Q2 2025 | Q2 2026 | Change |
|---|---|---|---|
| Revenue | 377 | 430 | +14.1% |
| EBITDA | 38.5 | 28.6 | -25.8% |
| Operating profit | 28.1 | 17.6 | -37.3% |
| Net profit | 35.7 | 22.2 | -38.0% |
| Operating cash flow | 12.9 | 10.2 | -21.2% |
| Capex | 35.6 | 54.3 | +52.4% |
| EBITDA margin | 10.2% | 6.6% | -3.6 pp |
| Net margin | 9.5% | 5.2% | -4.3 pp |
Revenue grew 14.1% year on year, but this is a deceleration from 18.6% in the previous quarter
In the second quarter of 2026, Inter RAO's revenue reached RUB 430.1 bn, up 14.1% from the same period a year earlier. Growth remains in double digits, but its pace has slowed: in the first quarter of 2026, revenue was growing at 18.6% year on year. The deceleration may reflect both a high base effect and changing market conditions.
The company did not disclose a detailed segment breakdown, so it is impossible to say exactly which business — generation, supply, or trading — made the main contribution to growth. However, the persistence of double-digit rates suggests that demand for electricity and capacity remains robust.
For investors, the quality of growth matters more than the fact of growth itself: revenue is rising, but profit is falling. This means costs are increasing faster than income, and the company cannot yet fully pass them on to consumers.
EBITDA fell 25.8% and the margin compressed to 6.6% — the year-earlier quarter was exceptionally strong
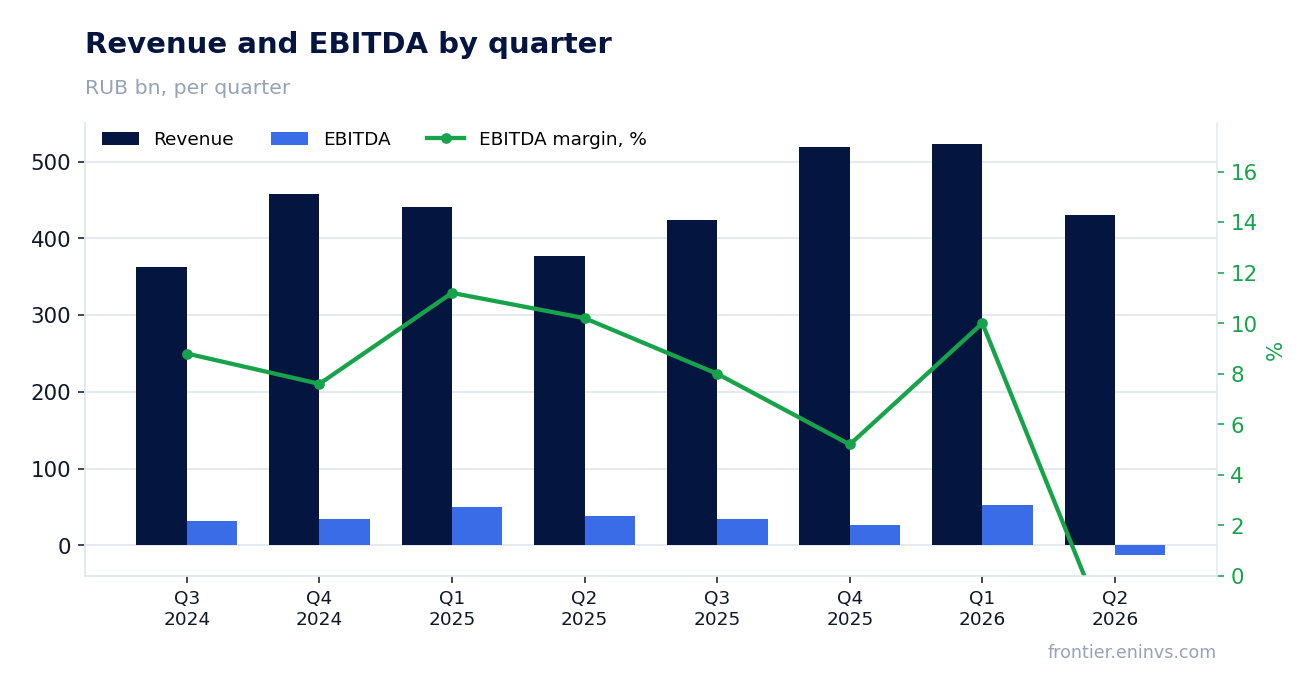
EBITDA in the second quarter of 2026 was RUB 28.6 bn, down 25.8% from a year earlier. The EBITDA margin narrowed to 6.6% from 10.2% in the second quarter of 2025. This is a sharp compression, but it is worth noting that the year-earlier quarter was exceptionally strong: EBITDA then reached RUB 38.5 bn on revenue of RUB 376.8 bn.
The margin decline may be linked to higher fuel, purchased electricity, and capacity costs, as well as changes in the revenue mix. The company did not disclose details, so the exact cause is unknown. However, it is important that EBITDA remains positive and substantial — RUB 28.6 bn — even after such a decline.
For investors, the key question is whether the current margin level is the new normal or a one-off deviation. If the margin stays at 6.6%, annual EBITDA could be significantly lower than last year, which would affect the dividend base.
Net profit fell 38.0% but remains positive at RUB 22.2 bn
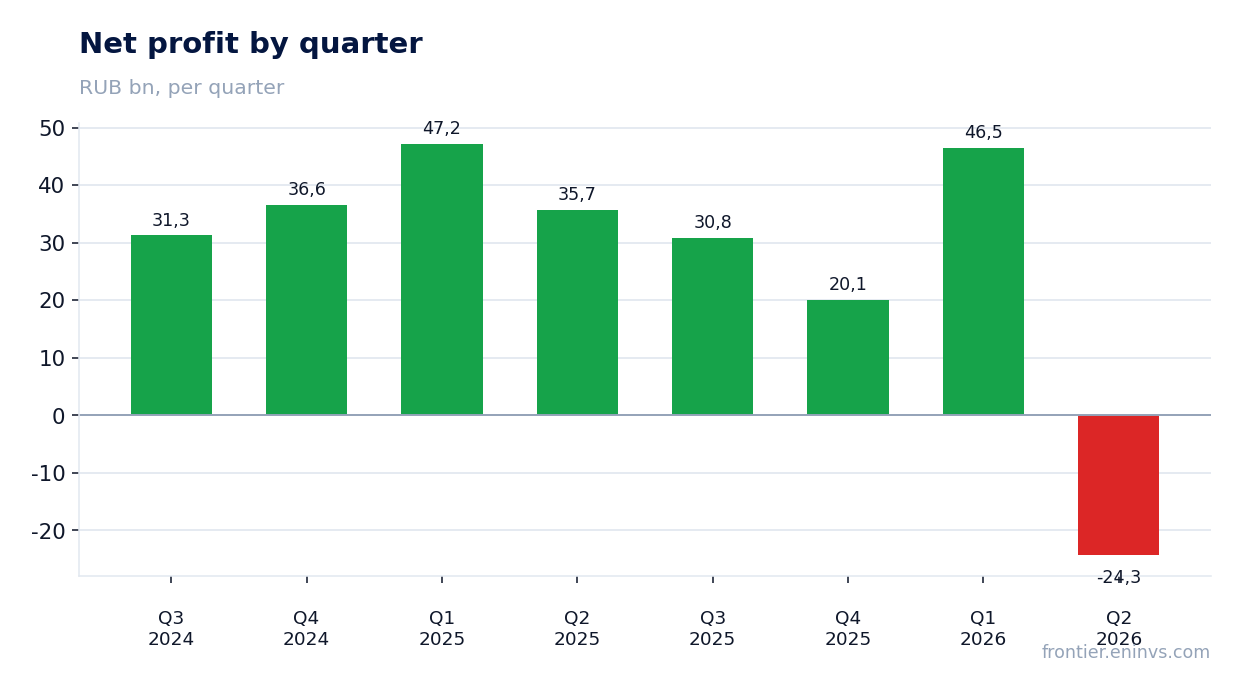
Net profit in the second quarter of 2026 was RUB 22.2 bn, down 38.0% from a year earlier. The net margin declined to 5.2% from 9.5%. The profit decline is steeper than the EBITDA decline, which may indicate higher depreciation, interest expenses, or one-off factors not reflected in EBITDA.
Despite the decline, profit remains positive and substantial. Over the trailing twelve months, net profit was RUB 119.6 bn — this is the base for dividend payments. The company maintains high profitability compared to many industry peers, although the current level is below last year's.
It is important to note that the profit decline is not a loss. The company continues to earn, and even at the current profit level, it can sustain dividend payments, although their size may be lower than in previous years.
The company retains a net cash position of RUB 155.4 bn despite rising capital expenditure
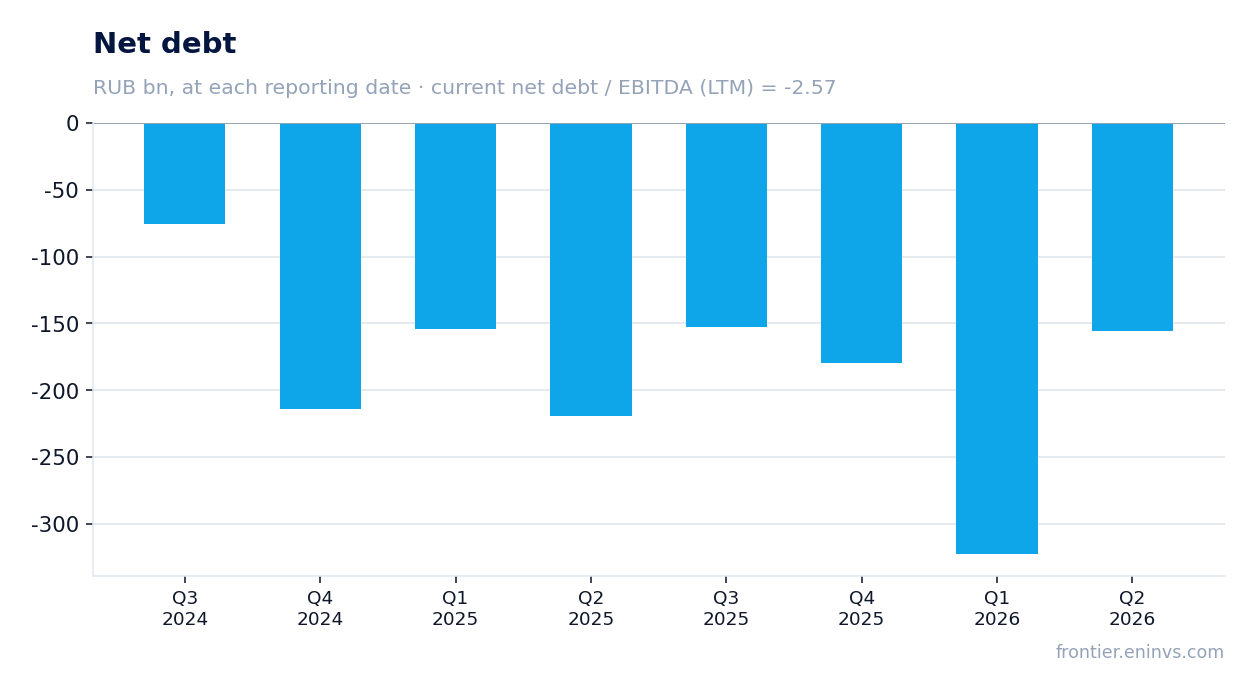
As of 30 June 2026, Inter RAO's net cash position was RUB 155.4 bn. This is lower than on 31 March 2026 (RUB 322.9 bn), a change of +RUB 167.5 bn. Over the year, the figure also declined: from RUB 219.5 bn on 30 June 2025 to RUB 155.4 bn on 30 June 2026, a change of +RUB 64.1 bn.
The decline in the cash position is linked to higher capital expenditure, which in the second quarter of 2026 amounted to RUB 54.3 bn versus RUB 35.6 bn a year earlier. Operating cash flow was only RUB 10.2 bn, which does not cover investments. The company is financing capex from accumulated cash.
Despite the decline, net debt remains negative — the company has more cash than debt. This provides financial stability and the ability to sustain dividend payments even during periods of lower profit. However, further reduction of the cash cushion could limit flexibility.
Capex rose to RUB 54.3 bn while operating cash flow was only RUB 10.2 bn
In the second quarter of 2026, Inter RAO's capital expenditure amounted to RUB 54.3 bn, significantly higher than operating cash flow of RUB 10.2 bn. The gap between investments and generated cash is covered from accumulated reserves. A year earlier, capex was RUB 35.6 bn and operating cash flow was RUB 12.9 bn.
The increase in capex may be linked to the implementation of an investment programme aimed at modernising generating capacities and developing grid infrastructure. The company did not disclose details, but such a level of investment indicates a strategic focus on expanding and upgrading assets.
For investors, it is important that capex is financed from own funds rather than debt. This keeps the balance sheet strong but limits the scope for additional dividend payments. If capex remains at a high level, free cash flow could be negative, putting pressure on dividends.
Dividend yield of about 12.4% on the current price is above the fair yield of 10.5%
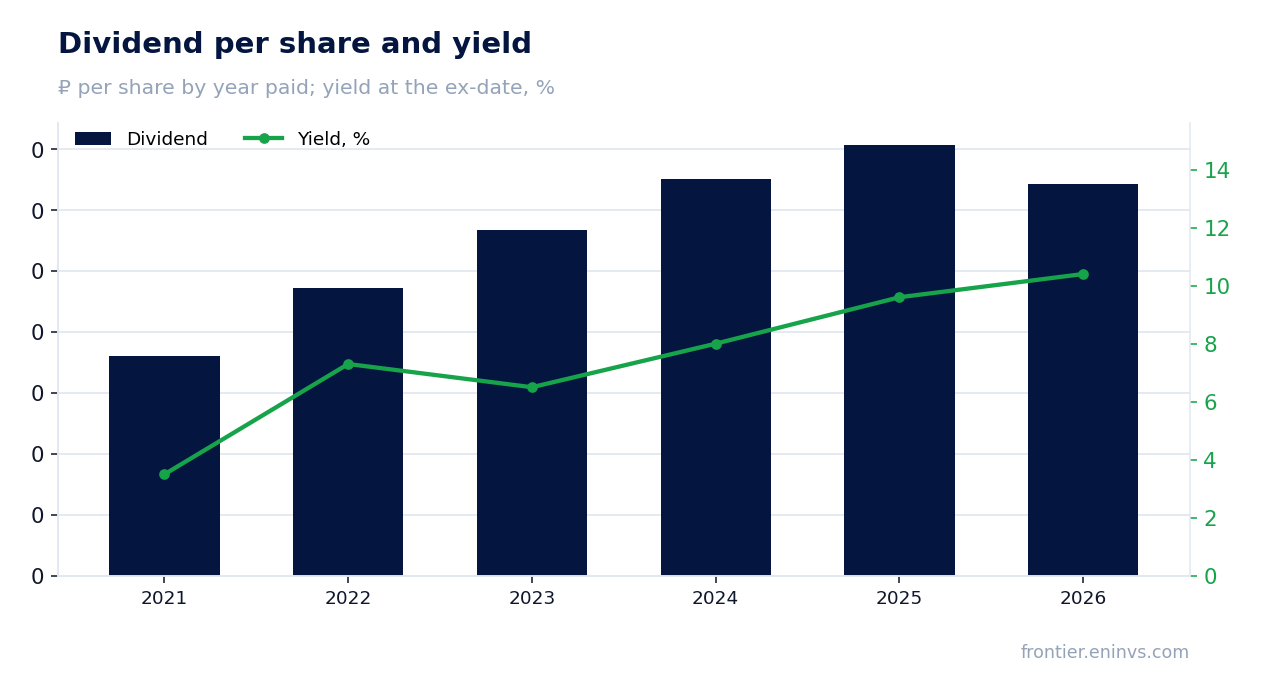
Inter RAO is a dividend story. Over the last twelve months, the company paid RUB 0.3214 per share, giving a yield of 13.8% on the current price. According to our estimate, the dividend for the current financial year (to be paid next year) will be RUB 0.29 per share, corresponding to a yield of 12.4% on the current price. This is our estimate, based on a payout ratio of 17% of profit, and the decision rests with the board of directors.
The historical yield of Inter RAO shares has grown: from 3.5% in 2021 to 10.4% in 2026. The current forward yield of 12.4% is above the fair yield of 10.5% that we consider adequate for this stock. With the key rate at 14.0%, a yield of 12.4% looks competitive, although it does not exceed the rate.
The risk of a dividend cut is linked to falling profit and rising capital expenditure. If net profit for the year is lower than over the last twelve months and the payout ratio remains at 17%, the dividend could be below our estimate. In addition, increased capex may require a revision of the dividend policy towards lower payments.
EV/EBITDA LTM of 0.064 is extremely low versus the three-year average of 0.296
The EV/EBITDA multiple over the last twelve months is 0.064. This is significantly below the three-year average of 0.296. Such a low valuation is explained by the large net cash position, which is subtracted from market capitalisation when calculating EV. The company's market capitalisation is RUB 164.5 bn, and net debt is negative — minus RUB 155.4 bn.
The P/E LTM multiple is 1.38, which is also extremely low. This reflects both high profit over the last twelve months (RUB 119.6 bn) and low market valuation. However, it is worth considering that profit includes one-off factors, and the current quarter showed a decline.
For investors, a low valuation could be a signal of undervaluation, but it may also reflect risks associated with falling profit and rising capital expenditure. If profit continues to decline, multiples could rise even if the share price remains unchanged.
Valuation on the latest reported figures
| Metric | Value |
|---|---|
| Market cap | 164 bn ₽ |
| P/E (LTM) | 1.4 |
| EV/EBITDA (LTM) | 0.1 |
| P/B | 0.14 |
| Operating cash flow (LTM) | 114 bn |
| ROE | 7.5% |
| Dividend yield (12m) | 13.8% |
| EV/EBITDA, 3-year average | 0.3 |
Dividend per share, ₽, and yield at the ex-date
| Year paid | Dividend | Yield |
|---|---|---|
| 2021 | 0.18 | 3.5% |
| 2022 | 0.24 | 7.3% |
| 2023 | 0.28 | 6.5% |
| 2024 | 0.33 | 8.0% |
| 2025 | 0.35 | 9.6% |
| 2026 | 0.32 | 10.4% |
| Our estimate, current year | 0.29 | 12.4% on the current price |
Bottom line
Inter RAO reported second-quarter 2026 results: revenue rose 14.1%, but profit fell 38.0% due to margin compression. The company retains a net cash position of RUB 155.4 bn and pays dividends with a yield of about 12.4% on the current price, above the fair level of 10.5%. The EV/EBITDA LTM multiple of 0.064 is significantly below the historical average of 0.296, indicating undervaluation. However, rising capital expenditure and falling profit create risks for future payouts. Verdict: the stock is attractive for income-oriented investors but requires monitoring of margin and cash flow dynamics.
Open the company's financial profile IRAO →
See also: market overview · valuation map · stock screeners