Kamaz: Revenue grows, but EBITDA margin turns negative and debt load reaches 37.9x EBITDA
On August 15, 2026, Kamaz released its results for the first half of 2026. Revenue grew 7.0% year-on-year, but EBITDA margin came in at -0.9%, and net margin was -13.2%. This review examines what lies behind these figures and why the debt load has reached 37.9x EBITDA over the trailing twelve months.
Key takeaways
— Revenue for the first half grew 7.0%, but EBITDA margin turned negative at -0.9%
— Net profit for the half-year went negative: margin of -13.2% versus -20.1% a year earlier
— Debt load reached 37.9x EBITDA over the trailing twelve months
— Operating cash flow for 12 months was RUB 9.3 bn, but debt rose by RUB 80.2 bn over the year
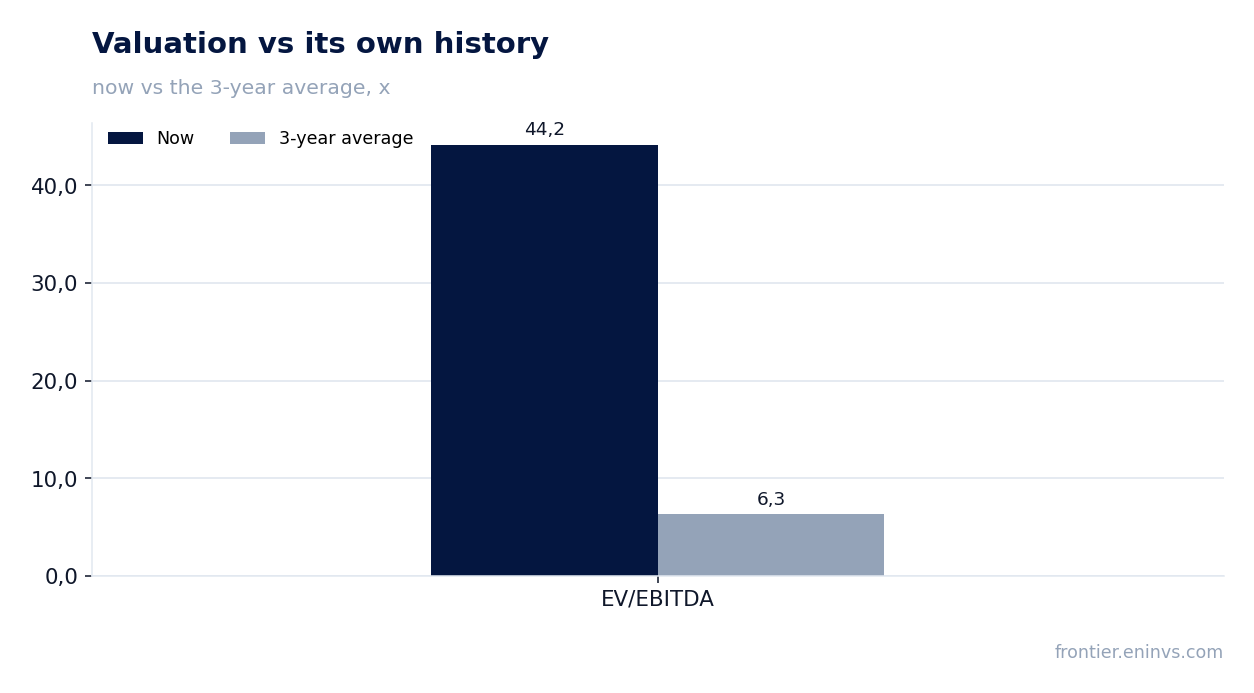
— EV/EBITDA on LTM is 44.2, seven times the three-year average
— No dividends paid over the last 12 months; the model estimates the next payout at RUB 0.0 per share
Key figures, RUB bn
| Metric | H1 2025 | H1 2026 | Change |
|---|---|---|---|
| Revenue | 154 | 165 | +7.0% |
| EBITDA | -11.5 | -1.41 | — |
| Operating profit | -18.1 | -8.08 | — |
| Net profit | -30.9 | -21.8 | — |
| Operating cash flow | 3.46 | 50.3 | +1351.6% |
| Capex | 13.1 | 12.3 | -6.4% |
| EBITDA margin | -7.5% | -0.9% | +6.6 pp |
| Net margin | -20.1% | -13.2% | +6.9 pp |
Revenue for the first half grew 7.0%, but EBITDA margin turned negative at -0.9%
For the first half of 2026, Kamaz's revenue reached RUB 392,900 million, up 7.0% from the same period last year. Growth was driven by higher sales of trucks and spare parts, as well as price increases.
However, EBITDA margin for the half-year was negative – minus 0.9%. A year earlier, the figure was also negative but deeper – minus 7.5%. The improvement of 6.6 percentage points reflects a partial recovery in operational efficiency, but the company is still not at breakeven EBITDA.
Net profit for the half-year went negative: margin of -13.2% versus -20.1% a year earlier
Net loss for the first half of 2026 was minus 13.2% of revenue, while a year earlier the loss was deeper – minus 20.1%. The improvement of 6.9 percentage points is due to reduced operating losses and lower financial expenses.
Nevertheless, a negative net margin means the company is losing money on every ruble of sales. This pressures equity: return on equity (ROE) over the trailing twelve months was minus 63.0%.
Debt load reached 37.9x EBITDA over the trailing twelve months
As of the latest balance sheet date, Kamaz's net debt stood at RUB 226,725 million, and the ratio of net debt to EBITDA over the trailing twelve months was 37.9. This is an extremely high level, reflecting significant debt burden relative to operating profit.
Over the past twelve months, net debt increased by RUB 80.2 billion, and compared to the previous reporting date – by RUB 2.2 billion. Debt growth occurs amid negative EBITDA and significant capital expenditures that are not covered by operating cash flow.
Operating cash flow for 12 months was RUB 9.3 bn, but debt rose by RUB 80.2 bn over the year
Over the trailing twelve months, Kamaz's operating cash flow was RUB 9,300 million. This is insufficient to finance capital expenditures and debt service, so the company is forced to raise new borrowings.
As a result, net debt increased by RUB 80.2 billion over the year, almost nine times the operating cash flow. This dynamic indicates a continued need for external financing and rising debt burden.
EV/EBITDA on LTM is 44.2, seven times the three-year average
EV/EBITDA for the trailing twelve months is 44.2, while the three-year average is 6.3. The current valuation is seven times its own historical norm, reflecting not so much growth in business value as a sharp decline in EBITDA.
With a negative EBITDA margin, the multiple becomes less informative, but it clearly shows how expensive the shares look relative to current operating profit. Investors should note that if EBITDA recovers, the multiple will quickly return to historical levels.
No dividends paid over the last 12 months; the model estimates the next payout at RUB 0.0 per share
Over the last 12 months, Kamaz paid no dividends – RUB 0.0 per share. Our model also estimates the next payout at RUB 0.0 per share, implying a zero payout ratio from profit.
With a fair yield of 7.0% and zero dividend, the shares offer no income to shareholders. The absence of payments is explained by loss-making operations and the need to allocate funds to debt service.
Valuation on the latest reported figures
| Metric | Value |
|---|---|
| Market cap | 37.5 bn ₽ |
| EV/EBITDA (LTM) | 44.2 |
| P/B | 0.47 |
| Net debt / EBITDA (LTM) | 37.90 |
| Operating cash flow (LTM) | 56.1 bn |
| ROE | -63.0% |
| EV/EBITDA, 3-year average | 6.3 |
Bottom line
In the first half of 2026, Kamaz showed revenue growth of 7.0%, but operating and net profit remained negative, although improved compared to last year. Debt load reached 37.9x EBITDA, and net debt rose by RUB 80.2 billion over the year, making the financial position extremely strained. The stock valuation (EV/EBITDA 44.2) is seven times the three-year average, but this reflects a drop in EBITDA rather than real value growth. For shareholders, the key question is whether the company can restore EBITDA to a level where the debt burden becomes acceptable, and when dividend payments will resume.
Open the company's financial profile KMAZ →
See also: market overview · valuation map · stock screeners