Lenenergo: H1 profit up 19.8%, yet the market met the report with a 37.4% jump
On 28 September Lenenergo released its results for the first half of 2026. Revenue rose 17.7% year on year to RUB 80.6 bn, EBITDA – by 20.2% to RUB 41.1 bn, net profit – by 19.8% to RUB 24.5 bn. The EBITDA margin improved to 51.0% from 49.9%, and the net margin to 30.3% from 29.8%. The share looks attractive: EV/EBITDA LTM of 1.78 against a three-year average of 3.21, a dividend history that is intermittent, but the portal model puts the upside to fair value at +34%.
Key takeaways
— Revenue added 17.7% year on year to RUB 80.6 bn – growth noticeably faster than the sector average, but without a segment breakdown in the report the source of this acceleration is not disclosed
— EBITDA rose 20.2% to RUB 41.1 bn, and the margin climbed to 51.0% from 49.9% – operating leverage worked harder than revenue growth
— Net profit for the half-year reached RUB 24.5 bn, up 19.8% year on year, with a net margin of 30.3% versus 29.8% a year earlier
— Free cash flow remains under pressure: operating cash flow of RUB 30.9 bn was almost entirely absorbed by capital expenditure of RUB 30.2 bn
— Net debt is negative – RUB 23.2 bn as of 30 June 2026 – and that is a cushion, not a burden: the net debt / EBITDA LTM ratio stands at -0.33
— No dividends were paid over the last 12 months, but our estimate for the current year is RUB 0.46 per share, giving a 3.4% yield on the current price
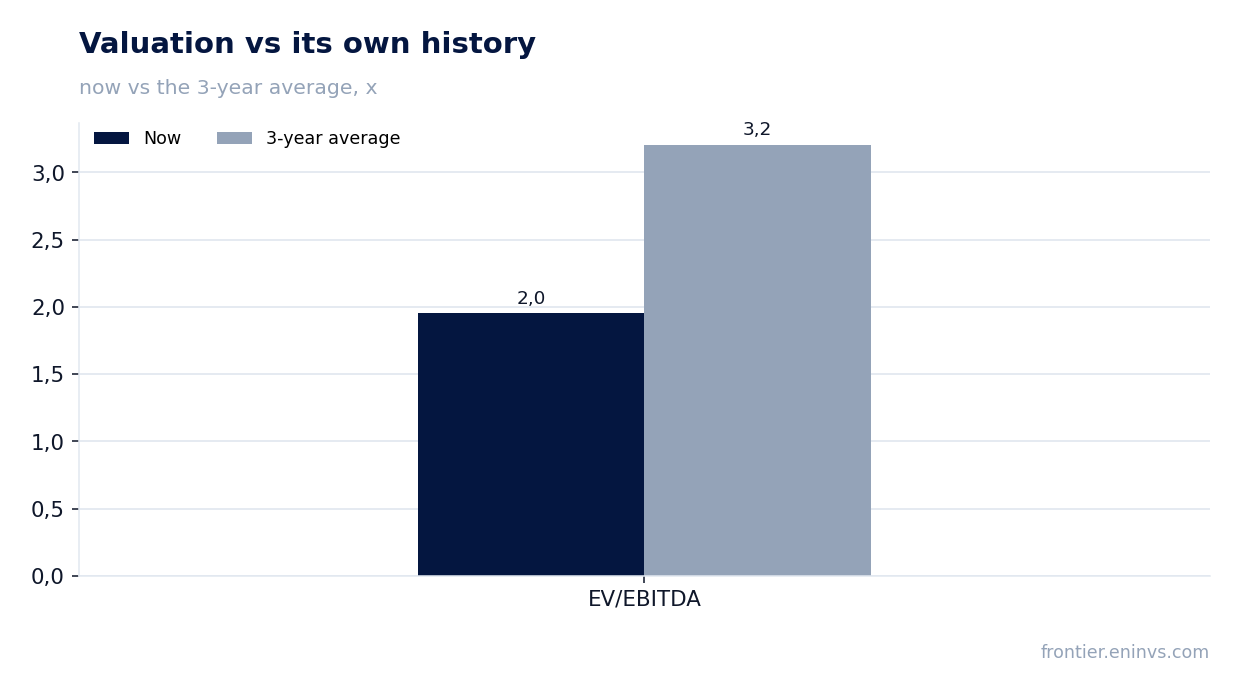
— Valuation at EV/EBITDA LTM of 1.78 against a three-year average of 3.21, and the portal model puts the share 34% below fair value
Attractiveness
Key figures, RUB bn
| Metric | H1 2025 | H1 2026 | Change |
|---|---|---|---|
| Revenue | 68.5 | 80.6 | +17.7% |
| EBITDA | 34.2 | 41.1 | +20.2% |
| Operating profit | 24.1 | 30.1 | +25.0% |
| Net profit | 20.4 | 24.5 | +19.8% |
| Operating cash flow | 30.7 | 30.9 | +0.8% |
| Capex | 24.8 | 30.2 | +21.8% |
| EBITDA margin | 49.9% | 51.0% | +1.1 pp |
| Net margin | 29.8% | 30.3% | +0.5 pp |
Revenue added 17.7% year on year to RUB 80.6 bn – growth noticeably faster than the sector average, but without a segment breakdown in the report the source of this acceleration is not disclosed
Lenenergo's revenue for the first half of 2026 reached RUB 80.6 bn, up 17.7% from the same period a year earlier. This is noticeably faster than the sector average, but the report lacks a segment breakdown, so the source of the acceleration remains undisclosed.
Revenue growth was accompanied by even faster EBITDA growth – 20.2%, to RUB 41.1 bn – indicating positive operating leverage. However, without a breakdown of cost items, it is impossible to tell which factor – tariffs, volumes or mix – produced this effect.
For an investor, what matters more than the absolute revenue growth is its sustainability. If it was driven by one-off factors, the next report could show a slowdown. For now, the dynamics look strong but need confirmation in subsequent periods.
EBITDA rose 20.2% to RUB 41.1 bn, and the margin climbed to 51.0% from 49.9% – operating leverage worked harder than revenue growth
EBITDA for the first half of 2026 reached RUB 41.1 bn, up 20.2% year on year. This is faster than revenue growth, which led to an expansion of the EBITDA margin to 51.0% from 49.9% a year earlier.
The 1.1 percentage point margin increase indicates that operating expenses grew slower than revenue. However, the report does not disclose which cost items contributed to this effect – possibly savings on fixed costs or a change in revenue mix.
To assess the sustainability of the margin, it is important to understand whether this growth is one-off or reflects a structural improvement. Without additional information from the report, we can only state the fact: the margin rose, and that is positive for profit.
Net profit for the half-year reached RUB 24.5 bn, up 19.8% year on year, with a net margin of 30.3% versus 29.8% a year earlier
Lenenergo's net profit for the first half of 2026 reached RUB 24.5 bn, up 19.8% from a year earlier. The net margin rose to 30.3% from 29.8%, slightly above EBITDA growth – likely due to a lower effective tax rate or interest expenses.
Profit growth of 19.8% is close to EBITDA growth of 20.2%, indicating no significant one-off factors below the operating line. This is a quality result: profit is growing alongside operating efficiency, not through asset sales or other irregular items.
For shareholders, what matters is not only absolute profit but how it converts into dividends. So far, profit is growing, but dividend policy remains uncertain – no payouts were made over the last 12 months.
Free cash flow remains under pressure: operating cash flow of RUB 30.9 bn was almost entirely absorbed by capital expenditure of RUB 30.2 bn
Operating cash flow for the first half of 2026 amounted to RUB 30.9 bn, while capital expenditure reached RUB 30.2 bn. The difference between them is minimal, implying almost zero free cash flow. This is a key constraint for dividends.
Such high capital expenditure is explained by the investment programme of the grid company. However, without management commentary on full-year plans, it is difficult to assess whether this capex level will persist in the second half.
For an investor, this means that even with profit growth, free cash remains limited. Dividend payments, if any, will be financed either from retained earnings or new borrowings, which is undesirable given the current debt load.
Net debt is negative – RUB 23.2 bn as of 30 June 2026 – and that is a cushion, not a burden: the net debt / EBITDA LTM ratio stands at -0.33
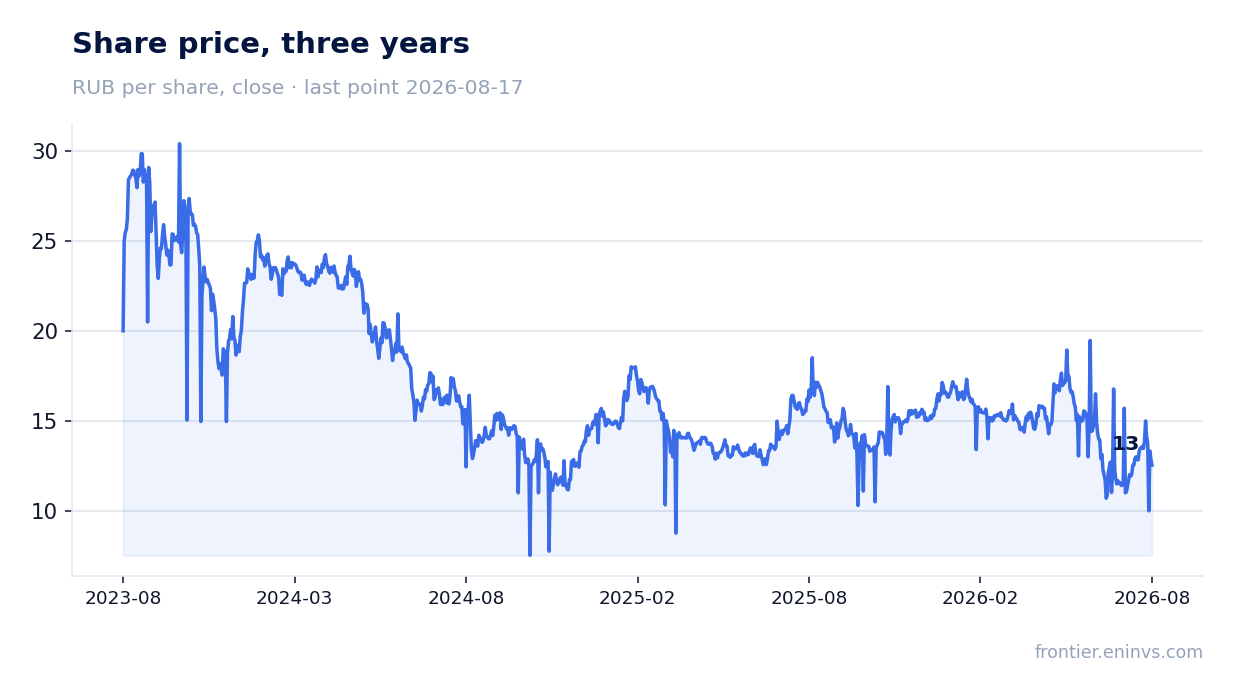
Lenenergo's net debt as of 30 June 2026 stood at -RUB 23.2 bn, meaning the company has a net cash position. Over the half-year, net debt decreased from -RUB 21.1 bn on 31 December 2025 to -RUB 23.2 bn on 30 June 2026, a change of -RUB 2.1 bn.
The net debt / EBITDA LTM ratio is -0.33, confirming the absence of debt burden. This is rare for infrastructure companies and provides a margin of safety in case of deteriorating conditions.
Negative net debt means that cash on the balance sheet exceeds debt obligations. This allows financing investments without attracting expensive borrowings and maintains financial stability.
No dividends were paid over the last 12 months, but our estimate for the current year is RUB 0.46 per share, giving a 3.4% yield on the current price
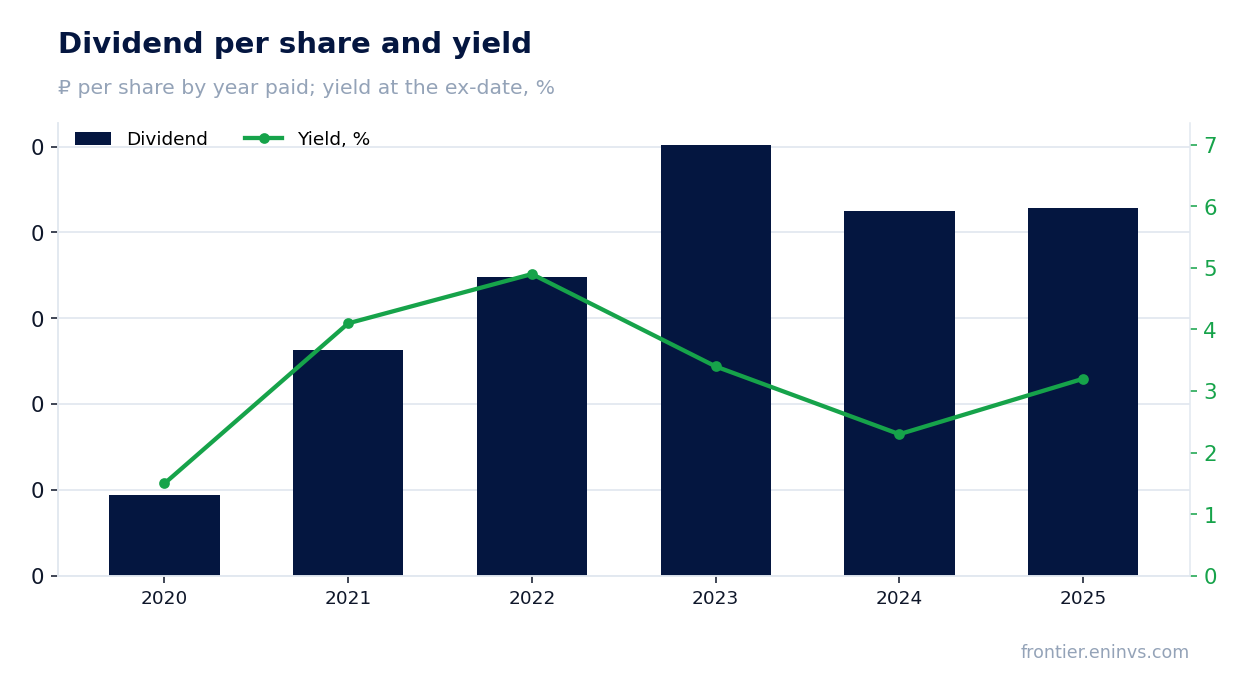
Over the last 12 months, Lenenergo paid no dividends. The last payout was for 2025 – RUB 0.4281 per share with a 3.2% yield at the ex-date. The payout history is irregular: dividends grew in 2020–2023 but declined in 2024–2025.
Our estimate for the current financial year's dividend (to be paid next year) is RUB 0.46 per share, giving a 3.4% yield on the current price. This is our own forecast, based on the assumption that the payout ratio remains at 10% of profit, as last year. The board decides.
For comparison: the yield on our estimate is below the central bank key rate (14.0%) and significantly below the 10.5% yield we consider fair for this name. This means the dividend is not the main driver of the share's attractiveness – the bet is on capital appreciation.
Valuation at EV/EBITDA LTM of 1.78 against a three-year average of 3.21, and the portal model puts the share 34% below fair value
Lenenergo's EV/EBITDA LTM stands at 1.78 against a three-year average of 3.21. This means the share is trading significantly below its historical valuation. The gap is explained by both EBITDA growth and a decline in market capitalisation in previous periods.
The P/E LTM is 3.77, also indicating a low valuation. According to the portal model, which compares EBITDA growth with a target multiple, the upside to fair value is estimated at +34%. This is our own model, not a market consensus.
The low valuation may be a consequence of uncertainty around dividend policy and high capital expenditure. However, if the company can maintain profit growth and improve free cash flow, the multiples could return to historical levels.
Valuation on the latest reported figures
| Metric | Value |
|---|---|
| Market cap | 147 bn ₽ |
| P/E (LTM) | 3.8 |
| EV/EBITDA (LTM) | 1.8 |
| P/B | 0.64 |
| Net debt / EBITDA (LTM) | -0.33 |
| Operating cash flow (LTM) | 66.7 bn |
| ROE | 20.7% |
| EV/EBITDA, 3-year average | 3.2 |
Dividend per share, ₽, and yield at the ex-date
| Year paid | Dividend | Yield |
|---|---|---|
| 2020 | 0.09 | 1.5% |
| 2021 | 0.26 | 4.1% |
| 2022 | 0.35 | 4.9% |
| 2023 | 0.50 | 3.4% |
| 2024 | 0.42 | 2.3% |
| 2025 | 0.43 | 3.2% |
| Our estimate, current year | 0.46 | 3.4% on the current price |
Bottom line
Lenenergo delivered strong results for the first half of 2026: revenue up 17.7%, EBITDA up 20.2%, net profit up 19.8%. The margin improved, and net debt remains negative, providing financial stability. However, free cash flow is virtually zero due to high capital expenditure, and no dividends were paid over the last 12 months. The EV/EBITDA LTM of 1.78 against a three-year average of 3.21 and the +34% upside from the portal model make the share attractive for investors willing to wait for a re-rating. The key question is whether the company can convert profit growth into free cash flow and dividends.
Open the company's financial profile LSNG →
See also: market overview · valuation map · stock screeners