IDGC Center: profit doubled, but the key question is whether the record margin holds

On 28 September, IDGC Center reported results for the second quarter of 2026. Revenue rose 13.8% year on year to RUB 38.0 bn, EBITDA – by 33.6% to RUB 11.0 bn, and net profit – by 114.7% to RUB 4.6 bn. The EBITDA margin climbed to 29.0% from 24.7% a year earlier, and the net margin – to 12.0% from 6.3%. Leverage remains low: net debt of RUB 33.1 bn, or 0.8 LTM EBITDA. With an EV/EBITDA of 1.6 against a three-year average of 2.1 and a dividend yield that could exceed 12%, the share looks attractive, but the sustainability of the record margin is the main risk.
Key takeaways
— Revenue grew 13.8% year on year, and the pace was roughly unchanged from the first quarter
— EBITDA rose 33.6%, with its margin climbing to 29.0% – a record level for the company
— Net profit more than doubled to RUB 4.6 bn, with a margin of 12.0%
— Leverage is low: net debt of RUB 33.1 bn, or 0.8 times EBITDA
— Free cash flow remains positive, but capital expenditure almost matches operating cash flow
— No dividends were paid over the last 12 months, but our estimate for the current year is RUB 0.09 per share, implying a 12.3% yield
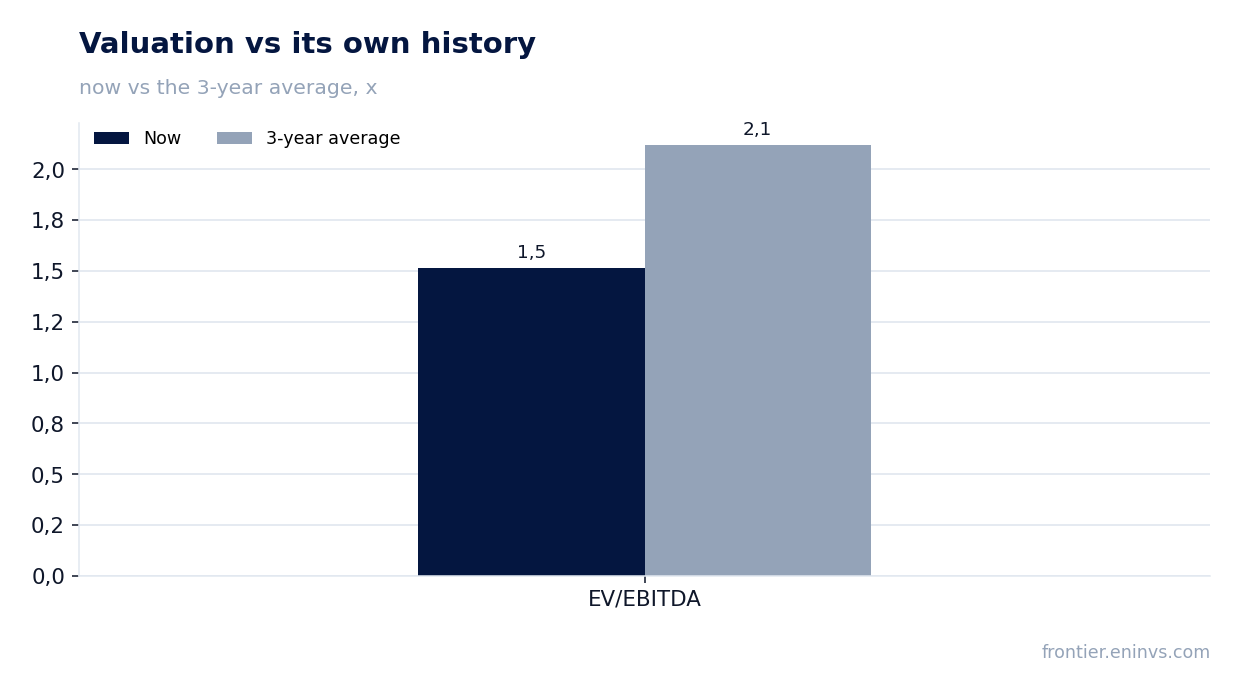
— The EV/EBITDA multiple of 1.6 is below the three-year average of 2.1, and the portal's model points to 78% upside
Attractiveness
Key figures, RUB bn
| Metric | Q2 2025 | Q2 2026 | Change |
|---|---|---|---|
| Revenue | 33.4 | 38.0 | +13.8% |
| EBITDA | 8.25 | 11.0 | +33.6% |
| Operating profit | 4.80 | 7.55 | +57.4% |
| Net profit | 2.12 | 4.55 | +114.7% |
| Operating cash flow | 5.82 | 5.91 | +1.5% |
| Capex | 6.14 | 5.85 | -4.8% |
| EBITDA margin | 24.7% | 29.0% | +4.3 pp |
| Net margin | 6.3% | 12.0% | +5.7 pp |
Revenue grew 13.8% year on year, and the pace was roughly unchanged from the first quarter
In the second quarter of 2026, IDGC Center's revenue reached RUB 38.0 bn, up 13.8% year on year. This continues a stable trend: growth was 13.3% in the first quarter and 13.0% in the fourth quarter of 2025. The growth rate remains high and is roughly unchanged from quarter to quarter.
The main contribution likely came from both higher volumes of services and tariff indexation, but the provided facts lack a segment breakdown. The company does not disclose revenue structure in this release, so the exact driver cannot be named. Importantly, growth is not slowing: even against a high base from last year, the company shows stable double-digit rates.
For an investor, this means demand for the company's services remains robust, and the business retains the ability to grow its top line. However, without understanding the sources of growth, it is difficult to assess how sustainable it is. The next report may provide more clarity if the company discloses details.
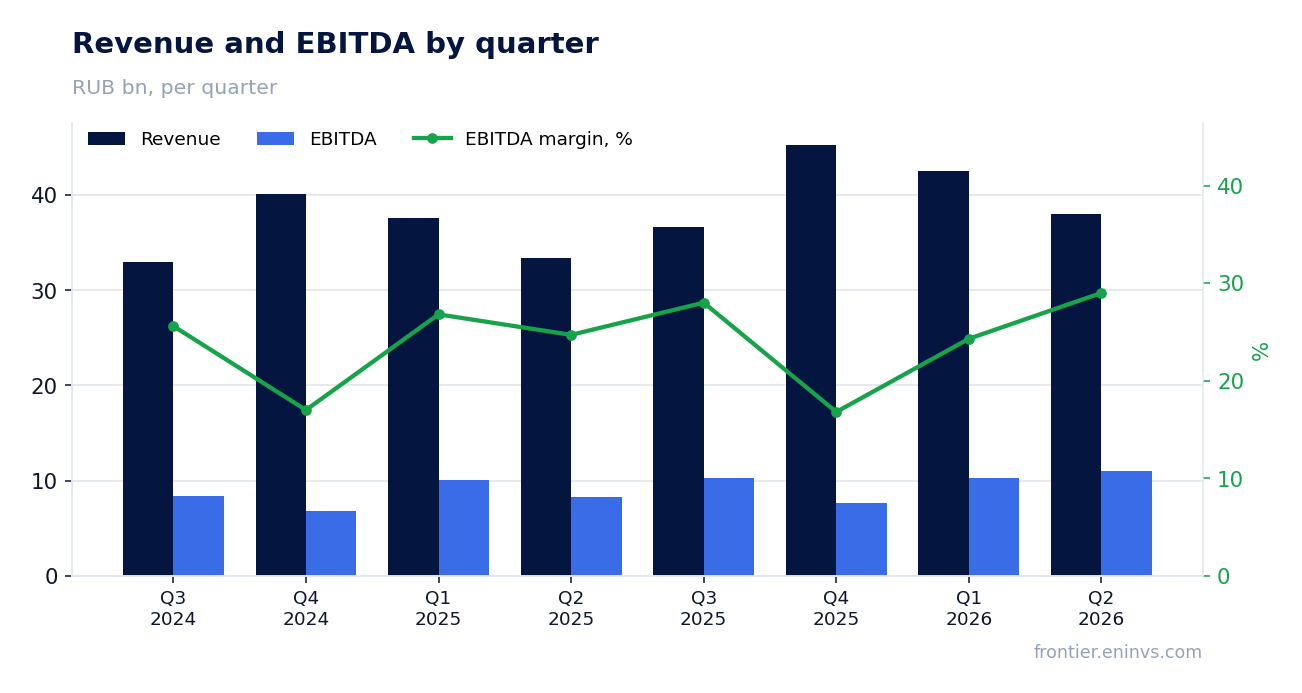
EBITDA rose 33.6%, with its margin climbing to 29.0% – a record level for the company
EBITDA in the second quarter of 2026 rose 33.6% year on year to RUB 11.0 bn, and the EBITDA margin reached 29.0% against 24.7% a year earlier. This is the highest margin level in at least several years. The growth of this indicator significantly outpaces revenue dynamics, indicating a substantial improvement in operating efficiency.
Such a sharp margin increase could be explained by both lower unit costs and economies of scale, but specific expense items are not detailed in the facts. The company may have reduced grid losses or optimised operating costs. Without additional data, the exact cause cannot be named, but the very fact of a 4.3 percentage point margin improvement is a strong signal.
The sustainability of this margin is the key question. If the margin increase proves one-off, profit could return to previous levels. If it is the result of structural changes, the company may maintain higher profitability going forward. So far, there is no data for a definitive conclusion.
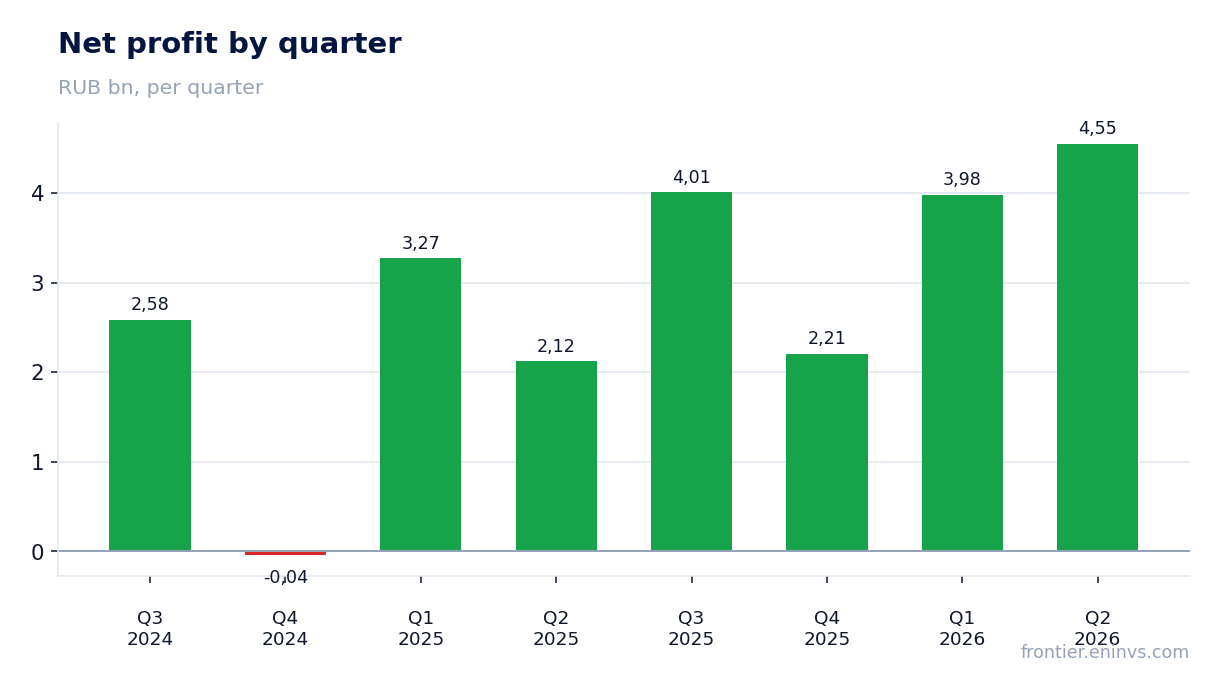
Net profit more than doubled to RUB 4.6 bn, with a margin of 12.0%
Net profit in the second quarter of 2026 amounted to RUB 4.6 bn, up 114.7% year on year. The net margin rose to 12.0% from 6.3% a year earlier. This growth is mainly explained by the outpacing increase in EBITDA and possibly by lower interest expenses or other costs.
More than doubling profit is an impressive result, but it is important to understand that it is partly due to a low base last year. In the second quarter of 2025, net profit was RUB 2.1 bn, or only 6.3% of revenue. The current profit level looks more sustainable, but its repetition next quarter is not guaranteed.
If the margin holds at the achieved level, annual profit could significantly exceed last year's. However, if the margin increase was one-off, profit could correct. Investors should monitor cost dynamics in the next report.
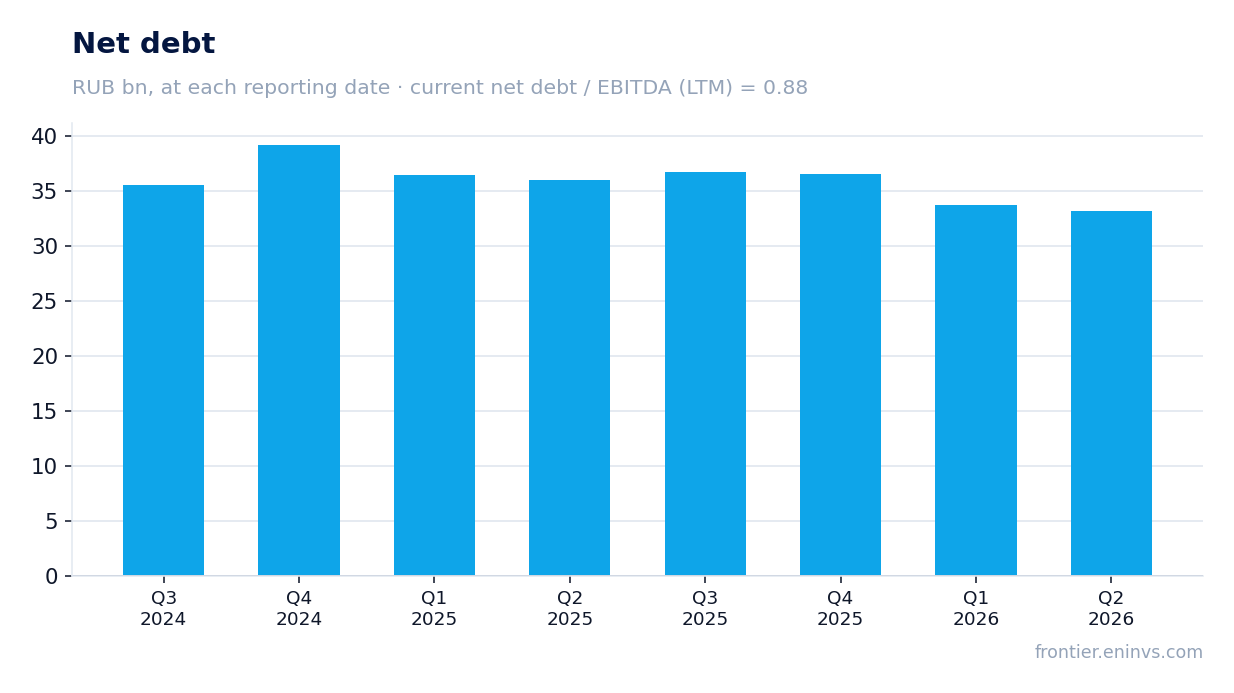
Leverage is low: net debt of RUB 33.1 bn, or 0.8 times EBITDA
Net debt as of 30 June 2026 stood at RUB 33.1 bn, down from RUB 33.7 bn on 31 March 2026 and from RUB 36.0 bn on 30 June 2025. The net debt to EBITDA ratio for the last 12 months is 0.8, a comfortable level for the company. The reduction in debt by RUB 2.8 bn over the year indicates the ability to generate cash flow sufficient to service and gradually repay obligations.
Low leverage gives the company financial flexibility and reduces risks in case of deteriorating market conditions. At the current EBITDA level, debt is easily serviced, and interest expenses are likely insignificant. This also creates prerequisites for higher dividend payments in the future.
However, the facts do not contain data on interest expenses or debt structure, so a detailed assessment of servicing costs is not possible. Nevertheless, the 0.8 times EBITDA level is low and does not raise concerns.
Free cash flow remains positive, but capital expenditure almost matches operating cash flow
Operating cash flow in the second quarter of 2026 was RUB 5.9 bn, while capital expenditure was RUB 5.8 bn. Thus, free cash flow (the difference) was only slightly positive – about RUB 0.1 bn. This means almost the entire operating flow goes to investments, leaving little for dividends or debt reduction.
For a company with low leverage, this is not critical, but it limits dividend payment capacity. In the first quarter of 2026, operating cash flow was RUB 9.9 bn with capital expenditure of RUB 7.3 bn, resulting in a more substantial free flow. In the second quarter, the situation worsened due to lower operating flow and sustained high investments.
If this dynamic persists, the company may face the need to increase debt to fund dividends or cut the investment programme. For now, free cash flow remains positive, which does not create immediate risks.
No dividends were paid over the last 12 months, but our estimate for the current year is RUB 0.09 per share, implying a 12.3% yield
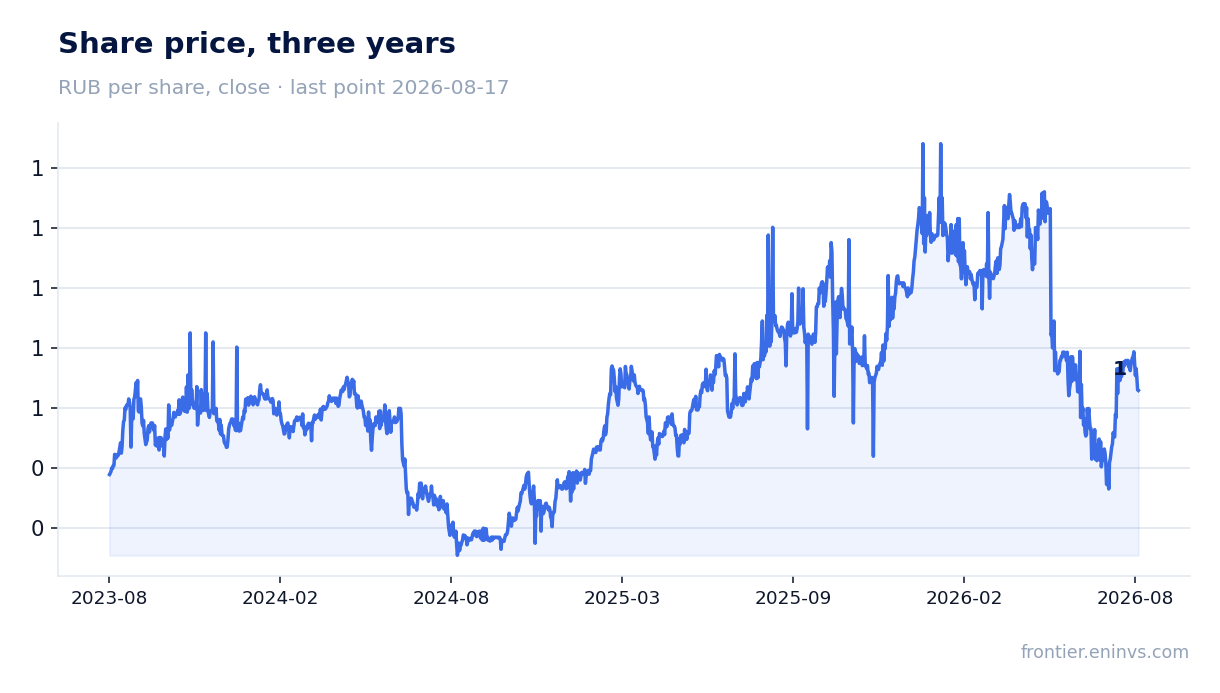
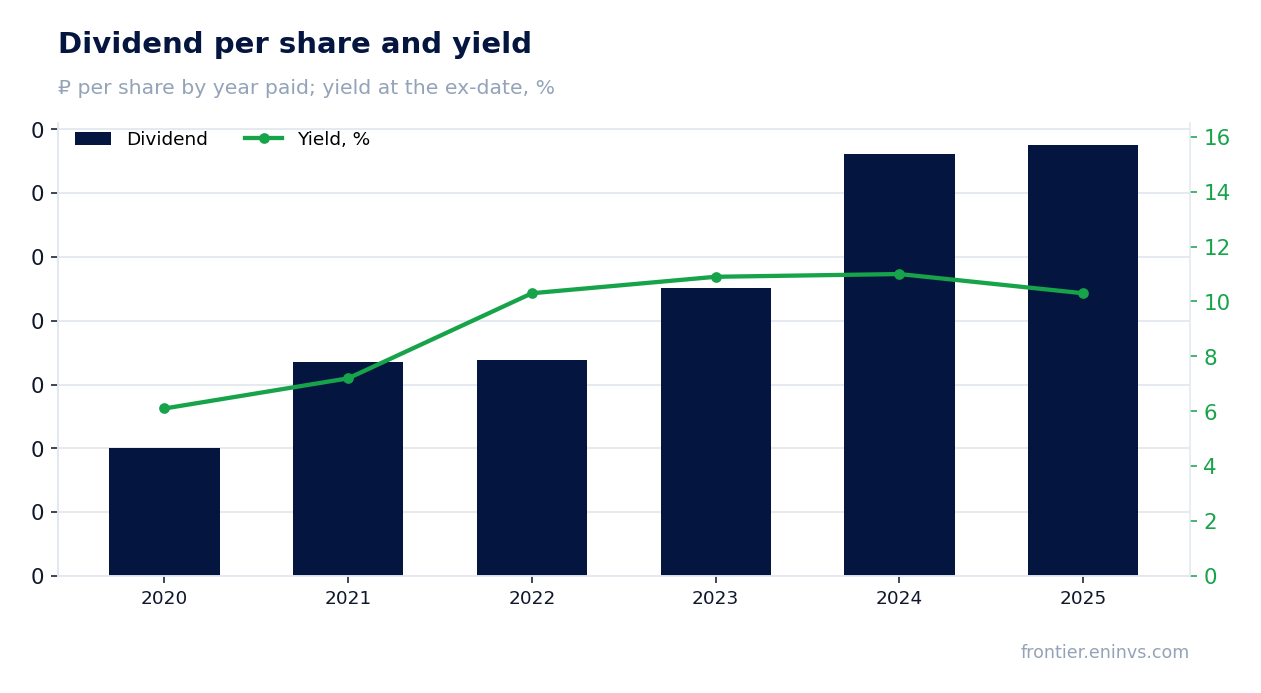
No dividends were paid over the last 12 months. However, our estimate for the current financial year (to be paid next year) is RUB 0.09 per share, which at the current price gives a yield of 12.3%. This is our own forecast, based on the assumption that the company will allocate 25% of net profit for the last 12 months to dividends – the same share as paid for the previous year. The decision is made by the board of directors.
Historical dividend yields for IDGC Center in recent years: 2020 – 6.1%, 2021 – 7.2%, 2022 – 10.3%, 2023 – 10.9%, 2024 – 11.0%, 2025 – 10.3%. Thus, the current estimated yield of 12.3% exceeds most historical values and is significantly higher than the key rate of 14.0%? No, 12.3% is below the key rate, but still attractive relative to history. The fair yield, in our view, is 10.5%, close to historical levels.
The risk of a lower dividend is linked to a possible drop in profit if the record margin does not hold, as well as to higher capital expenditure that may require more funds. In addition, the dividend policy could be revised. Nevertheless, even under a conservative scenario, the dividend yield remains high.
The EV/EBITDA multiple of 1.6 is below the three-year average of 2.1, and the portal's model points to 78% upside
The current EV/EBITDA multiple is 1.6, below the three-year average of 2.1. This means the share is valued cheaper than usual relative to its EBITDA. The P/E multiple for the last 12 months is 2.0, also indicating a low valuation. Return on equity (ROE) for the last 12 months is 22.6%, a high figure.
Our fundamental valuation model, which takes into account EBITDA growth and a target multiple, shows upside to fair value of +78%. This is our own estimate, not a market consensus. It is based on the assumption that the company can maintain the current EBITDA level and that the multiple will revert to its historical average.
Thus, from a valuation perspective, the share looks attractive. However, if profit and EBITDA decline, the upside potential may shrink. It is also important to consider that a low multiple may reflect risks related to margin sustainability or dividend policy.
Valuation on the latest reported figures
| Metric | Value |
|---|---|
| Market cap | 29.9 bn ₽ |
| P/E (LTM) | 2.0 |
| EV/EBITDA (LTM) | 1.6 |
| P/B | 0.41 |
| Net debt / EBITDA (LTM) | 0.80 |
| Operating cash flow (LTM) | 30.9 bn |
| ROE | 22.6% |
| EV/EBITDA, 3-year average | 2.1 |
Dividend per share, ₽, and yield at the ex-date
| Year paid | Dividend | Yield |
|---|---|---|
| 2020 | 0.02 | 6.1% |
| 2021 | 0.03 | 7.2% |
| 2022 | 0.03 | 10.3% |
| 2023 | 0.05 | 10.9% |
| 2024 | 0.07 | 11.0% |
| 2025 | 0.07 | 10.3% |
| Our estimate, current year | 0.09 | 12.3% on the current price |
Bottom line
IDGC Center delivered strong results for the second quarter of 2026: revenue rose 13.8%, EBITDA – by 33.6%, and net profit more than doubled. The margin reached a record 29.0%, while leverage remains low at 0.8 times EBITDA. However, part of the profit growth may be one-off, and free cash flow is constrained by high capital expenditure. Our estimated dividend yield of 12.3% is above historical levels and the fair yield of 10.5%. With an EV/EBITDA of 1.6 against a three-year average of 2.1, the share looks undervalued. The verdict is 'attractive', but the key question is whether the company can sustain its record margin.
Open the company's financial profile MRKC →
See also: market overview · valuation map · stock screeners