IDGC Siberia: RUB 1.02 bn profit and a 13.1% margin — but operating cash flow swung to minus RUB 4.7 bn
On 27 August IDGC Siberia released its Q2 2026 results: revenue rose 20.7% year on year to RUB 32.9 bn, EBITDA jumped 117.5% to RUB 4.3 bn, and net profit came in at RUB 1.02 bn against a RUB 1.28 bn loss a year earlier. The EBITDA margin climbed to 13.1% from 7.3%, but operating cash flow for the quarter was negative at minus RUB 4.7 bn. With EV/EBITDA at 5.2 and the portal's model pointing to 56% upside to fair value, the share looks rather attractive than neutral — provided cash flow returns to positive territory.
Key takeaways
— Revenue grew 20.7% year on year, but that is a deceleration from 106.1% in Q4 2025
— EBITDA rose 117.5% and the margin climbed to 13.1% from 7.3%, helped by one-off income
— Net profit of RUB 1.02 bn against a loss a year earlier, with RUB 5.4 bn earned in the half-year
— Operating cash flow for the quarter was minus RUB 4.7 bn — working capital consumed the profit
— Leverage at 2.82x EBITDA with net debt of RUB 47.9 bn as of 30 June 2026
— No dividends paid over the last 12 months, and the portal's model expects no payout
— EV/EBITDA 5.2 and P/E 13.2 — valuation below its own history, the portal's model implies 56% upside
Attractiveness
Key figures, RUB bn
| Metric | Q2 2025 | Q2 2026 | Change |
|---|---|---|---|
| Revenue | 27.2 | 32.9 | +20.7% |
| EBITDA | 1.98 | 4.30 | +117.5% |
| Operating profit | 0.77 | 3.04 | +292.4% |
| Net profit | -1.28 | 1.02 | to profit |
| Operating cash flow | 1.45 | -4.69 | -423.4% |
| EBITDA margin | 7.3% | 13.1% | +5.8 pp |
| Net margin | -4.7% | 3.1% | +7.8 pp |
Revenue grew 20.7% year on year, but that is a deceleration from 106.1% in Q4 2025
IDGC Siberia's Q2 2026 revenue reached RUB 32.9 bn, up 20.7% year on year. That is a marked deceleration from 106.1% growth in Q4 2025: the base was low then, and now the company is growing from a higher base.
The main contribution came from electricity transmission — RUB 31.9 bn of total revenue — while technological connection brought in only RUB 0.4 bn. Other revenue, including joint suspension of fibre-optic lines and construction of grid facilities, amounted to RUB 0.5 bn.
Revenue growth of 20.7% is a deceleration from the previous quarter, and the next report will show whether this trend persists. For an investor, the key point is that the company remains dependent on tariff regulation: core income depends on approved tariffs, not market conditions.
EBITDA rose 117.5% and the margin climbed to 13.1% from 7.3%, helped by one-off income
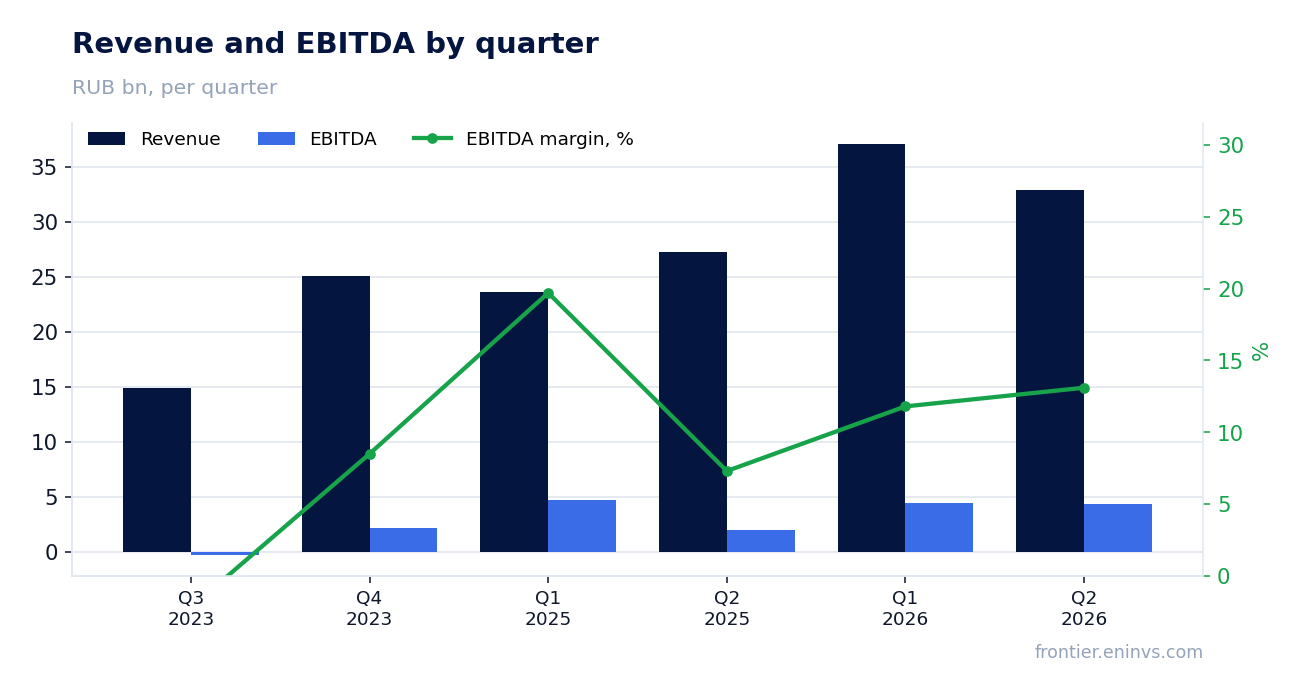
Q2 2026 EBITDA rose 117.5% year on year to RUB 4.3 bn, with the margin climbing to 13.1% from 7.3% a year earlier. Such margin expansion on 20.7% revenue growth means costs grew slower than income.
The report shows other income for the quarter at RUB 0.7 bn versus RUB 0.8 bn a year earlier, but its structure changed: income from fines and penalties fell to RUB 0.3 bn from RUB 0.4 bn, while compensation for the relocation of grid assets rose to RUB 0.2 bn from RUB 0.06 bn. These items are one-off in nature and may not recur.
Operating expenses rose to RUB 30.6 bn from RUB 27.2 bn, but their 12.5% growth lagged the 20.7% revenue increase. The main pressure came from employee benefit expenses — RUB 7.2 bn versus RUB 6.3 bn — and electricity transmission services — RUB 15.4 bn versus RUB 14.0 bn. Savings on other lines allowed the margin to improve.
Net profit of RUB 1.02 bn against a loss a year earlier, with RUB 5.4 bn earned in the half-year
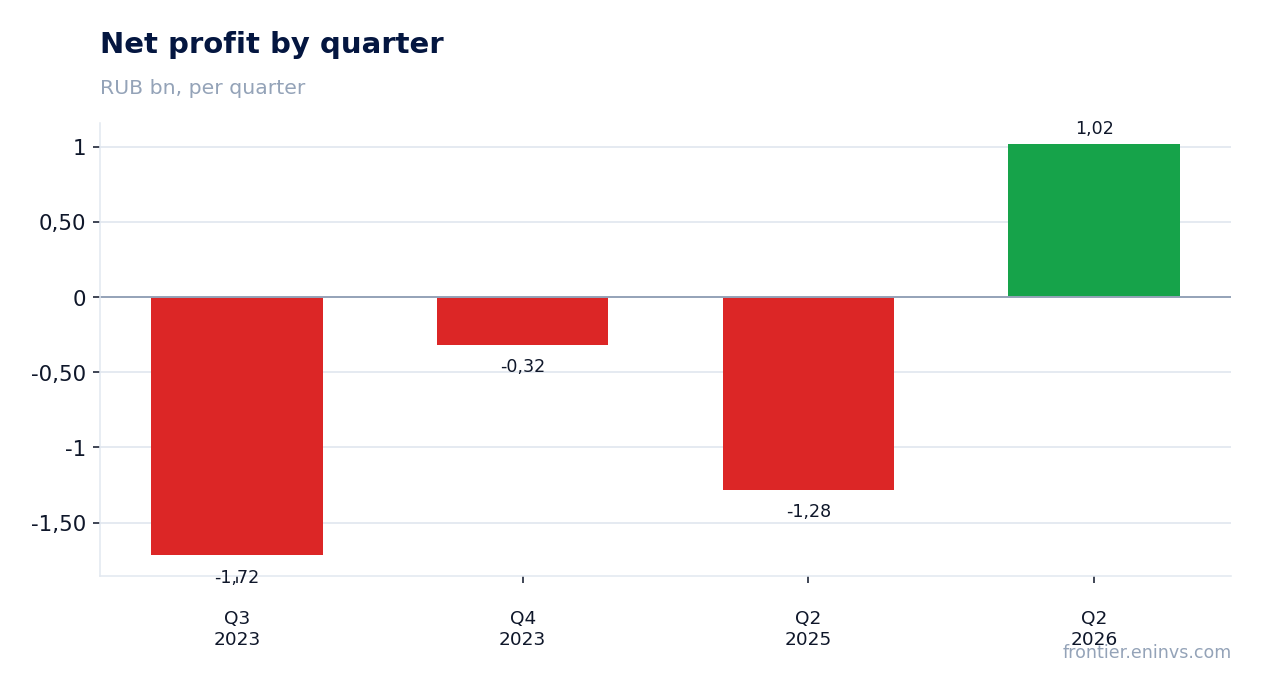
Q2 2026 net profit was RUB 1.02 bn against a RUB 1.28 bn loss in Q2 2025. The net margin rose to 3.1% from minus 4.7% a year earlier.
In H1 2026 the company earned RUB 5.4 bn of net profit against a RUB 0.4 bn loss in the same period of 2025. The gap between the quarter and the half-year is explained by a much stronger first quarter: in the cash flow statement, profit for the six months is RUB 5.4 bn, while for the quarter it is only RUB 1.02 bn.
Profit growth was partly supported by the reversal of a provision for expected credit losses — RUB 0.3 bn in the half-year versus a RUB 0.3 bn charge a year earlier. This is not a cash inflow but an accounting adjustment that flatters reported profit without affecting cash flow.
Operating cash flow for the quarter was minus RUB 4.7 bn — working capital consumed the profit
Q2 2026 operating cash flow was negative at minus RUB 4.7 bn. This contrasts sharply with the RUB 1.02 bn profit and with positive flow of RUB 1.5 bn in Q2 2025.
The reason is visible in the half-year cash flow statement: the change in trade and other payables produced an outflow of RUB 6.2 bn versus an inflow of RUB 2.5 bn a year earlier. The company settled with suppliers and contractors, reducing payables from RUB 22.1 bn at end-2025 to RUB 14.6 bn as of 30 June 2026.
At the same time, advances received rose to RUB 11.8 bn from RUB 11.2 bn, providing an inflow of RUB 0.2 bn. But this is not enough to offset settlements with creditors. For an investor, this means profit is there, but cash did not grow as much: the cash balance fell to RUB 2.0 bn from RUB 9.3 bn at the start of the year.
Leverage at 2.82x EBITDA with net debt of RUB 47.9 bn as of 30 June 2026
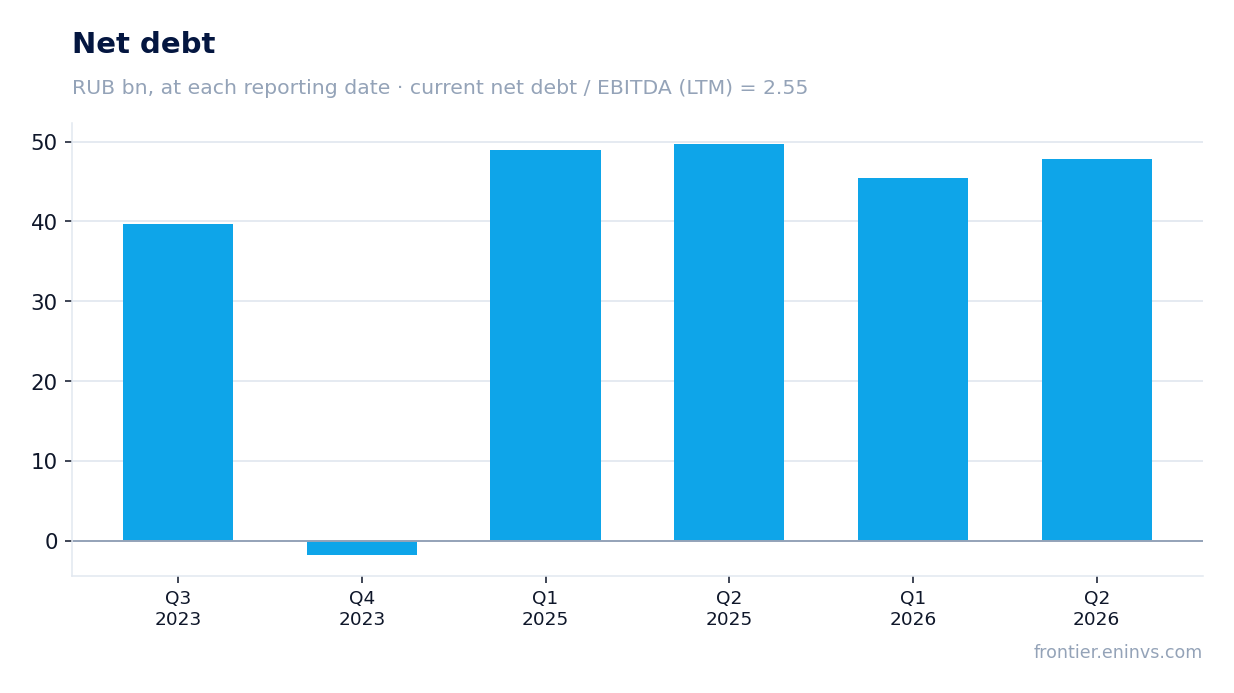
Net debt as of 30 June 2026 was RUB 47.9 bn versus RUB 43.1 bn at 31 December 2025 — an increase of RUB 4.8 bn over six months. A year earlier, on 30 June 2025, net debt was RUB 49.7 bn, meaning it declined by RUB 1.9 bn over 12 months.
The net debt to EBITDA ratio for the trailing twelve months is 2.82. This is a moderate level for a grid company, but it requires servicing: interest expenses on financial liabilities for the half-year were RUB 3.8 bn versus RUB 4.8 bn a year earlier. The decline in interest expenses reflects the general interest rate trend in the economy.
Short-term borrowings and the current portion of long-term debt amount to RUB 9.7 bn, while cash is only RUB 2.0 bn. The company depends on refinancing: in the half-year it raised RUB 24.0 bn of new borrowings and repaid RUB 26.5 bn. With the central bank key rate at 14.0%, the cost of servicing debt remains significant.
No dividends paid over the last 12 months, and the portal's model expects no payout
No dividends were paid over the last 12 months. Our model does not expect payouts next year either: the estimated dividend is RUB 0.0 per share. The yield we consider fair for this name is 12.0%, which is above the 14.0% key rate only if payouts resume.
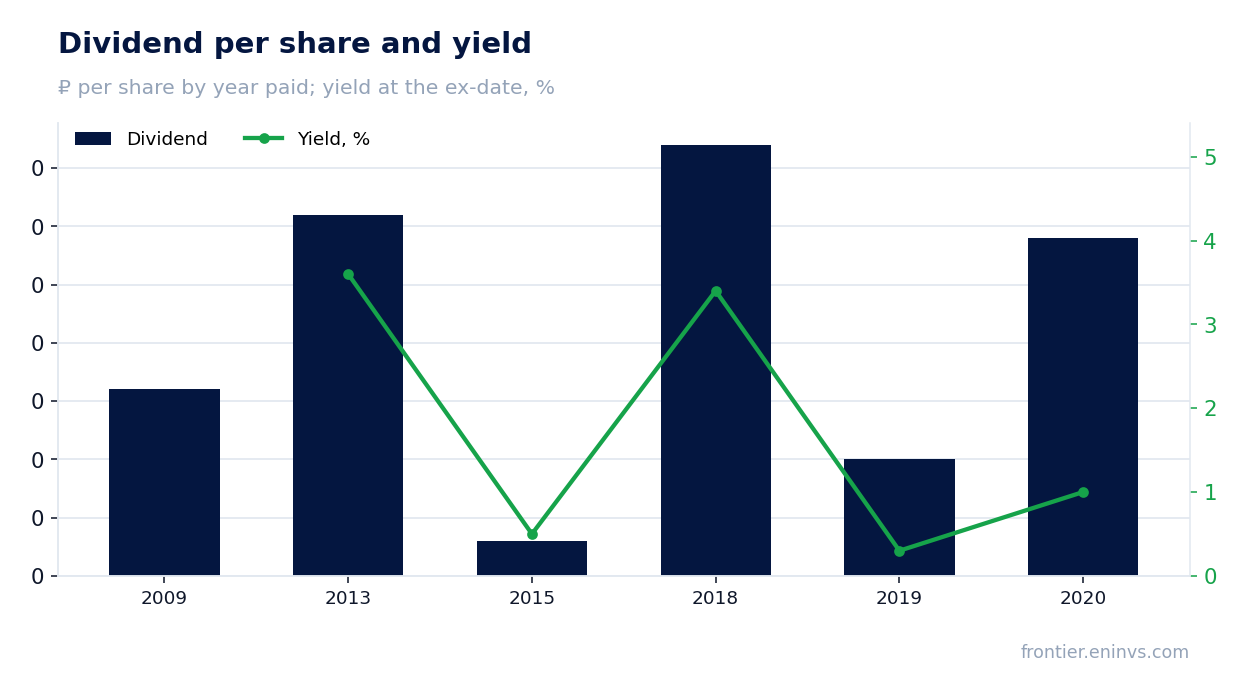
The company's dividend history is intermittent: in 2018 it paid RUB 0.0037 per share with a 3.4% yield at the ex-date, in 2019 — RUB 0.001 with a 0.3% yield, in 2020 — RUB 0.0029 with a 1.0% yield. No payouts have been made in recent years. The reason is the priority of the investment programme and debt servicing over profit distribution.
Based on trailing twelve-month profit, the potential payout ratio could be 0.59, but the company does not follow this benchmark. While cash flow is negative and capital expenditure for the half-year was RUB 5.4 bn, the probability of dividends remains low. For an investor, this means returns can only come through share price growth, not payouts.
EV/EBITDA 5.2 and P/E 13.2 — valuation below its own history, the portal's model implies 56% upside
The trailing twelve-month EV/EBITDA multiple is 5.2, and P/E is 13.2. Return on equity (ROE) is 19.9%, above the yield on debt instruments. Market capitalisation is RUB 45.4 bn against net debt of RUB 47.9 bn.
Our business valuation model, based on EBITDA growth and a target multiple, implies 56% upside to fair value. This is our own estimate, not a market consensus. It relies on EBITDA stability and the current level of debt.
A comparison of the current multiple with its own three-year history is not possible because the data is not in the FACTS. However, an EV/EBITDA of 5.2 for a grid company with ROE of 19.9% looks low. The main risk is negative cash flow, which could require additional borrowing and increase leverage.
Valuation on the latest reported figures
| Metric | Value |
|---|---|
| Market cap | 45.4 bn ₽ |
| P/E (LTM) | 13.2 |
| EV/EBITDA (LTM) | 5.2 |
| P/B | 2.99 |
| Net debt / EBITDA (LTM) | 2.82 |
| Operating cash flow (LTM) | 12.1 bn |
| ROE | 19.9% |
Dividend per share, ₽, and yield at the ex-date
| Year paid | Dividend | Yield |
|---|---|---|
| 2009 | 0.00 | — |
| 2013 | 0.00 | 3.6% |
| 2015 | 0.00 | 0.5% |
| 2018 | 0.00 | 3.4% |
| 2019 | 0.00 | 0.3% |
| 2020 | 0.00 | 1.0% |
Bottom line
The report's strengths are 20.7% revenue growth and a doubling of EBITDA with a 13.1% margin. However, part of this growth came from one-off income, and operating cash flow is negative. Leverage at 2.82x EBITDA and the absence of dividends limit appeal for a conservative investor. Valuation at EV/EBITDA 5.2 and the portal's model (+56%) makes the share rather attractive, but the key question is whether cash flow returns to positive territory next quarter.
Open the company's financial profile MRKS →
See also: market overview · valuation map · stock screeners