IDGC Volga: profit more than doubled, but quarterly cash flow came in at half of EBITDA
On 28 September IDGC Volga reported results for the second quarter of 2026. Revenue rose 25.0% year on year to RUB 34.7 bn, EBITDA jumped 95.4% to RUB 7.0 bn, and net profit more than doubled, up 134.5% to RUB 3.5 bn. The EBITDA margin climbed to 20.3% from 13.0% a year earlier, while operating cash flow for the quarter was only RUB 2.5 bn against capital expenditure of RUB 4.1 bn. With EV/EBITDA at 1.47 versus its own three-year average of 1.34 and an estimated dividend of RUB 0.01 per share, the stock looks rather attractive, but the gap between profit and cash flow needs confirmation in the next report.
Key takeaways
— Revenue growth accelerated to 25.0% year on year from 15.7% a quarter earlier
— EBITDA nearly doubled, with its margin rising to 20.3%
— Net profit more than doubled, but quarterly cash flow is half of EBITDA
— Leverage is minimal: 0.03x EBITDA with net debt of RUB 0.9 bn
— No dividend was paid over the last 12 months, and our estimate is RUB 0.01 per share
— Valuation is below its own history: EV/EBITDA 1.47 versus the three-year average of 1.34
— The portal's model puts the upside to fair value at 68%
Attractiveness
Key figures, RUB bn
| Metric | Q2 2025 | Q2 2026 | Change |
|---|---|---|---|
| Revenue | 27.7 | 34.7 | +25.0% |
| EBITDA | 3.60 | 7.04 | +95.4% |
| Operating profit | 1.93 | 4.63 | +140.2% |
| Net profit | 1.50 | 3.51 | +134.5% |
| Operating cash flow | 1.07 | 2.46 | +129.0% |
| Capex | 2.47 | 4.08 | +65.6% |
| EBITDA margin | 13.0% | 20.3% | +7.3 pp |
| Net margin | 5.4% | 10.1% | +4.7 pp |
Revenue growth accelerated to 25.0% year on year from 15.7% a quarter earlier
In the second quarter of 2026, IDGC Volga's revenue reached RUB 34.7 bn, up 25.0% year on year. This is an acceleration from the first quarter, when growth was 15.7%. A quarter earlier the company showed more modest dynamics; now the pace has increased.
Revenue growth in the power sector is traditionally linked to tariff decisions and transmission volumes, but the provided facts do not break down these drivers. We can only state that the company is growing revenue faster than at the start of the year, which positively affects operating leverage.
It is worth noting that a year earlier growth was significantly higher – 53.7% in the second quarter of 2025. The current acceleration is happening against an already elevated base, which makes it a more valuable signal of demand resilience.
EBITDA nearly doubled, with its margin rising to 20.3%
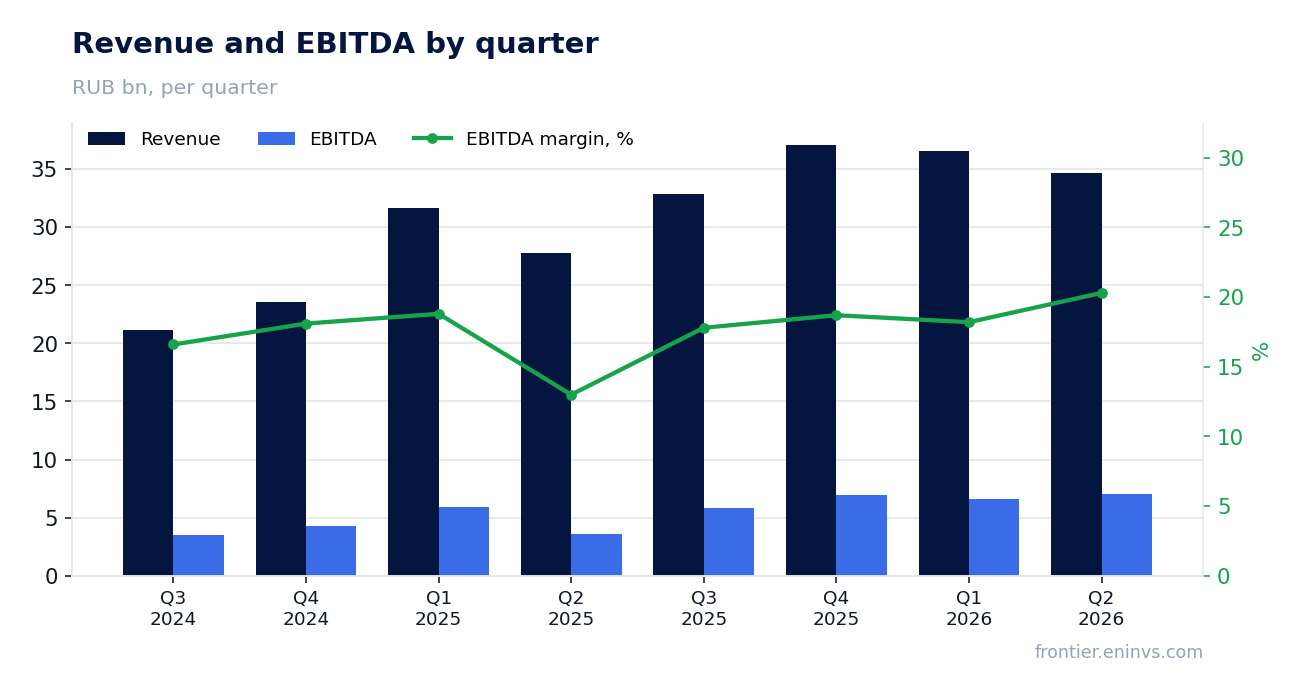
EBITDA in the second quarter of 2026 was RUB 7.0 bn, up 95.4% year on year. The EBITDA margin rose to 20.3% from 13.0% in the second quarter of 2025. Such margin growth with revenue up 25.0% indicates a significant improvement in operating efficiency.
Operating profit rose to RUB 4.6 bn from RUB 1.9 bn a year earlier. The difference between EBITDA and operating profit is depreciation, which likely remained flat or grew insignificantly, as the main lever for improvement lies in controlling operating expenses.
We do not have a breakdown of cost items, so we cannot say exactly which line drove such a jump in margin. However, the very fact of a 7.3 percentage point year-on-year increase in profitability is a strong signal that could be sustainable if the company continues to optimise.
Net profit more than doubled, but quarterly cash flow is half of EBITDA
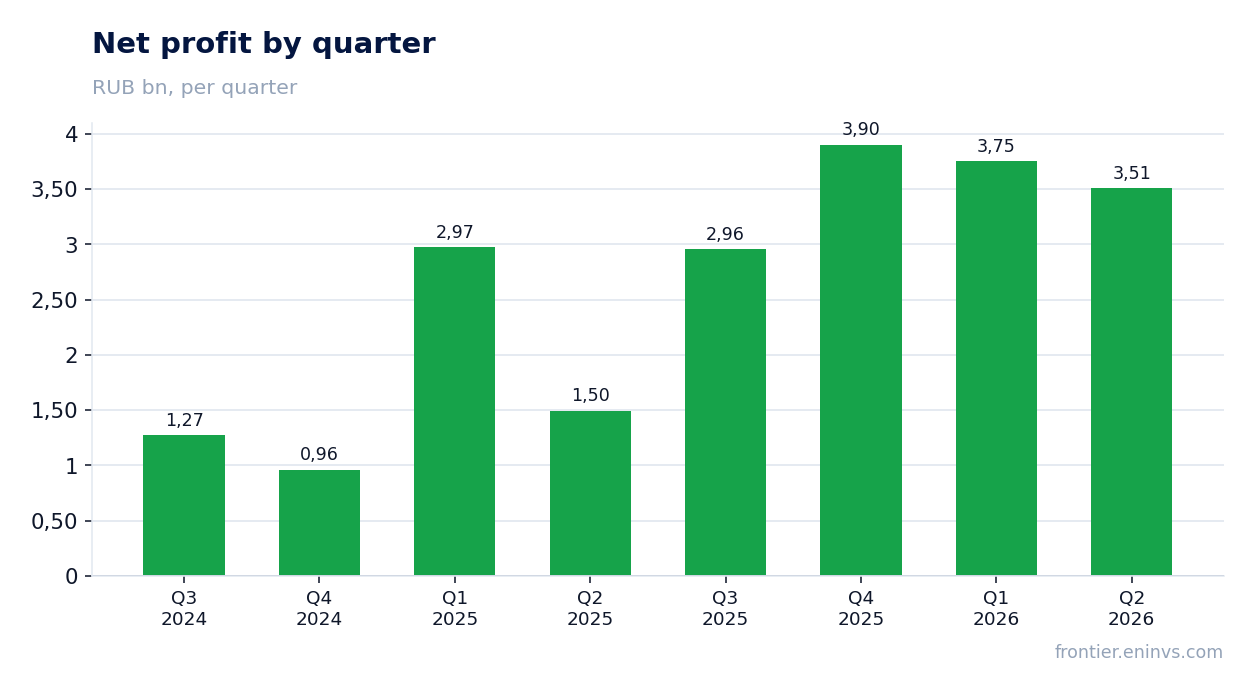
Net profit in the second quarter of 2026 was RUB 3.5 bn, up 134.5% year on year. The net margin rose to 10.1% from 5.4%. However, operating cash flow for the quarter was only RUB 2.5 bn, half of EBITDA.
The gap between profit and cash flow may be explained by working capital growth or seasonal factors, but the facts lack details. Importantly, capital expenditure for the quarter was RUB 4.1 bn, exceeding operating cash flow. This means the company funded investments from other sources, possibly cash balances.
Over the last 12 months, operating cash flow was RUB 21.4 bn, significantly higher than the quarterly figure. This suggests the second quarter may be atypical in terms of profit-to-cash conversion. The next report will show whether this was a one-off working capital spike or a sustainable trend.
Leverage is minimal: 0.03x EBITDA with net debt of RUB 0.9 bn
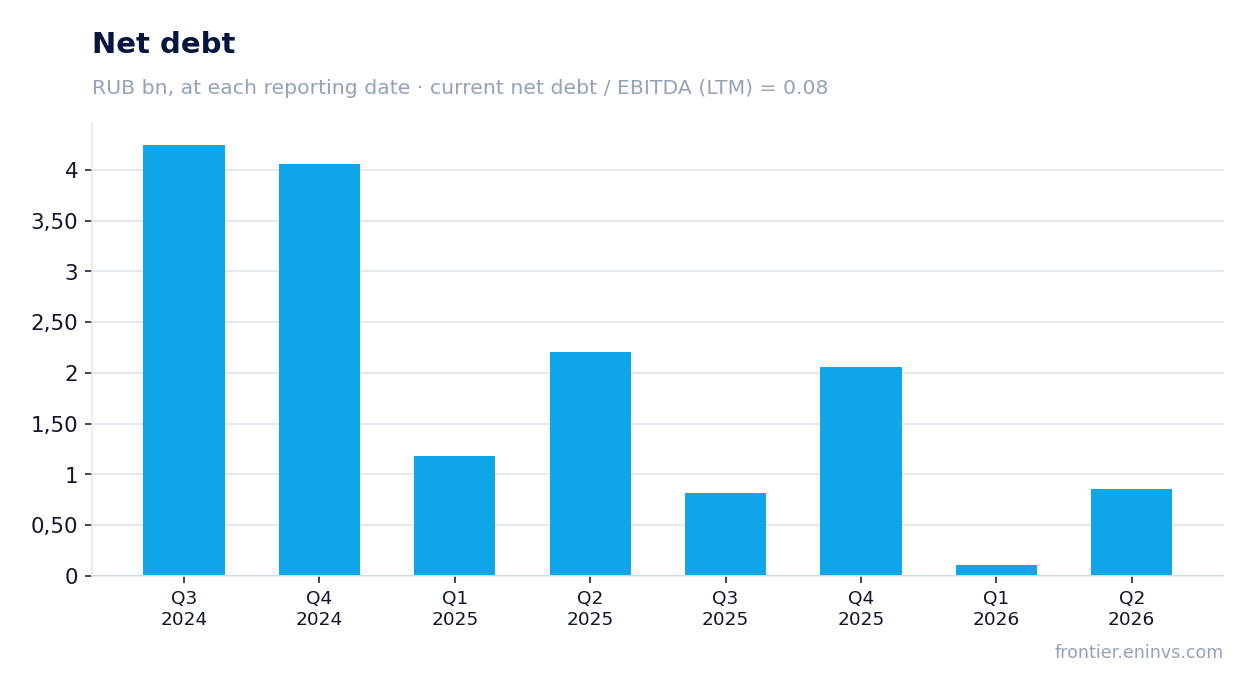
Net debt as of 30 June 2026 was RUB 0.9 bn. This is less than 0.03x trailing twelve-month EBITDA. Such a debt level creates virtually no risks to the company's financial stability.
Compared to 31 March 2026, net debt increased from RUB 0.1 bn to RUB 0.9 bn, i.e. by RUB 0.7 bn. However, over 12 months, from 30 June 2025, net debt decreased from RUB 2.2 bn to RUB 0.9 bn, i.e. by RUB 1.3 bn. This reduction occurred alongside EBITDA growth, further strengthening credit metrics.
Such low leverage gives the company freedom to finance its investment programme without significantly increasing debt. The question is whether this policy will persist if capital expenditure continues to grow.
No dividend was paid over the last 12 months, and our estimate is RUB 0.01 per share
No dividends were paid over the last 12 months. Our estimate for the current financial year, to be paid next year, is RUB 0.01 per share. This is our own forecast, based on the share of profit paid out last year (17%) and trailing twelve-month profit. The board decides.
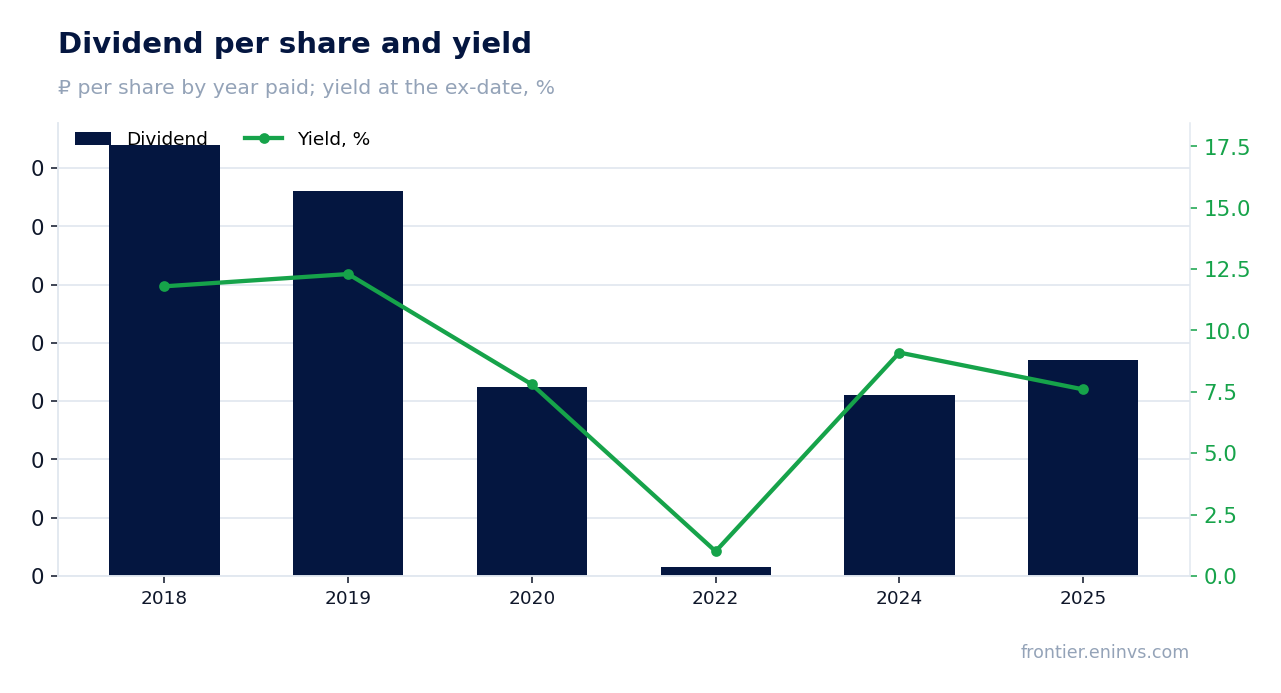
At the current price of RUB 0.1943 per share, the expected dividend yield is 5.9% on our estimate. This is below the 10.5% yield we consider fair and below the central bank key rate of 14.0%. The payout history shows yields reached 11.8% (2018) and 12.3% (2019), but in recent years they were more modest: 9.1% in 2024 and 7.6% in 2025.
The dividend could be smaller if profit declines or the company increases capital expenditure. For now, the projected yield falls short of the fair level, which limits the appeal for income-oriented investors.
Valuation is below its own history: EV/EBITDA 1.47 versus the three-year average of 1.34
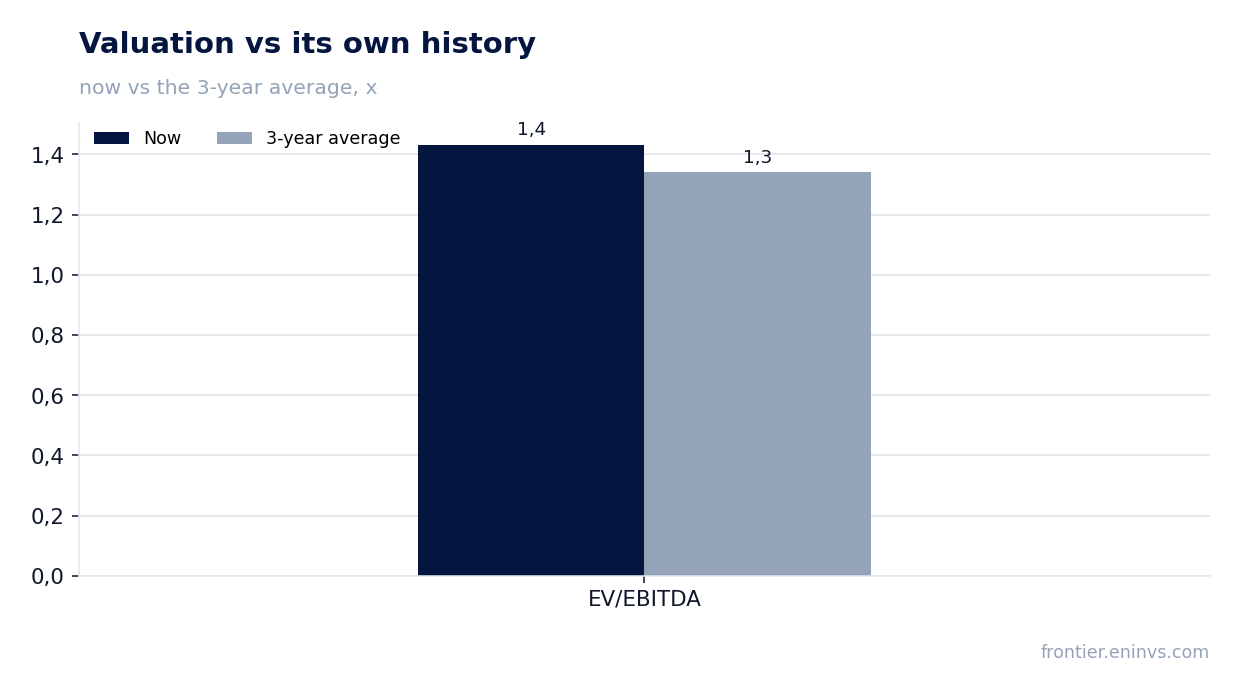
The current EV/EBITDA multiple is 1.47. This is above the three-year average of 1.34. Thus, the stock trades slightly above its historical norm, but still at a very low absolute level.
The trailing twelve-month P/E is 2.70. This extremely low value reflects either high profit or low market valuation. Return on equity (ROE) is 24.2%, indicating efficient use of capital.
Our valuation model, based on EBITDA growth and a target multiple, shows a 68% upside to fair value. This is our own model, not a consensus forecast. Judging by current multiples, the market is pricing in very conservative expectations for the company's future cash flows.
The portal's model puts the upside to fair value at 68%
According to the portal's model, which compares EBITDA growth with a target multiple and market capitalisation, the upside to fair value is 68%. This is our internal estimate, and it is significantly above the current market price.
This gap is primarily explained by the low valuation base: with a market capitalisation of RUB 38.1 bn and trailing twelve-month EBITDA of RUB 27.3 bn, the company appears undervalued. If the multiple returns to the three-year average (1.34), this alone will not drive growth, as the current 1.47 is already above it. However, the model assumes EBITDA growth that could lead to a re-rating.
It is worth remembering that the model is not a price forecast but a valuation tool. The market can ignore fundamental value for a long time, especially in companies with state participation and low liquidity. Nevertheless, the combination of low debt, growing profit, and modest valuation creates prerequisites for growth.
Valuation on the latest reported figures
| Metric | Value |
|---|---|
| Market cap | 38.1 bn ₽ |
| P/E (LTM) | 2.7 |
| EV/EBITDA (LTM) | 1.5 |
| P/B | 0.70 |
| Net debt / EBITDA (LTM) | 0.03 |
| Operating cash flow (LTM) | 21.4 bn |
| ROE | 24.2% |
| EV/EBITDA, 3-year average | 1.3 |
Dividend per share, ₽, and yield at the ex-date
| Year paid | Dividend | Yield |
|---|---|---|
| 2018 | 0.01 | 11.8% |
| 2019 | 0.01 | 12.3% |
| 2020 | 0.01 | 7.8% |
| 2022 | 0.00 | 1.0% |
| 2024 | 0.01 | 9.1% |
| 2025 | 0.01 | 7.6% |
| Our estimate, current year | 0.01 | 6.3% on the current price |
Bottom line
Bottom line: in the second quarter of 2026, IDGC Volga showed strong revenue acceleration to 25.0% year on year and nearly doubled EBITDA, driving a 2.3-fold increase in net profit. However, operating cash flow was half of EBITDA, and capital expenditure exceeded it, raising questions about earnings quality. Leverage is minimal (0.03x EBITDA), and the EV/EBITDA valuation (1.47) is slightly above its own three-year average (1.34). The dividend yield on our estimate (5.9%) falls short of the fair level (10.5%). Verdict – rather attractive: the stock is undervalued on multiples and has upside according to the portal's model (68%), but confirmation requires sustainable cash flow and more generous dividends.
Open the company's financial profile MRKV →
See also: market overview · valuation map · stock screeners