IDGC South: revenue up 2.5x, but quarterly profit is a quarter of the previous one
On 28 September, IDGC South published its Q2 2026 results. Revenue grew 153.8% year on year to 45.2 bn RUB, EBITDA – by 254.2% to 8.6 bn RUB, net profit – by 719.6% to 2.45 bn RUB. However, relative to the first quarter, profit fell threefold, and leverage remains at 1.58 EBITDA LTM. At the current price, the stock trades at 2.84 EV/EBITDA versus the three-year average of 5.63, making it attractive for dividend-oriented holders despite the modest current payout.
Key takeaways
— Revenue grew 2.5x, but quarterly profit is a third of the previous one
— EBITDA margin rose to 19.0% from 13.6% a year earlier
— Debt rose to 39.4 bn RUB, leverage remains at 1.58 EBITDA LTM
— Free cash flow remains negative due to capital expenditure
— Dividend yield of 5.4% is half the fair level for the company
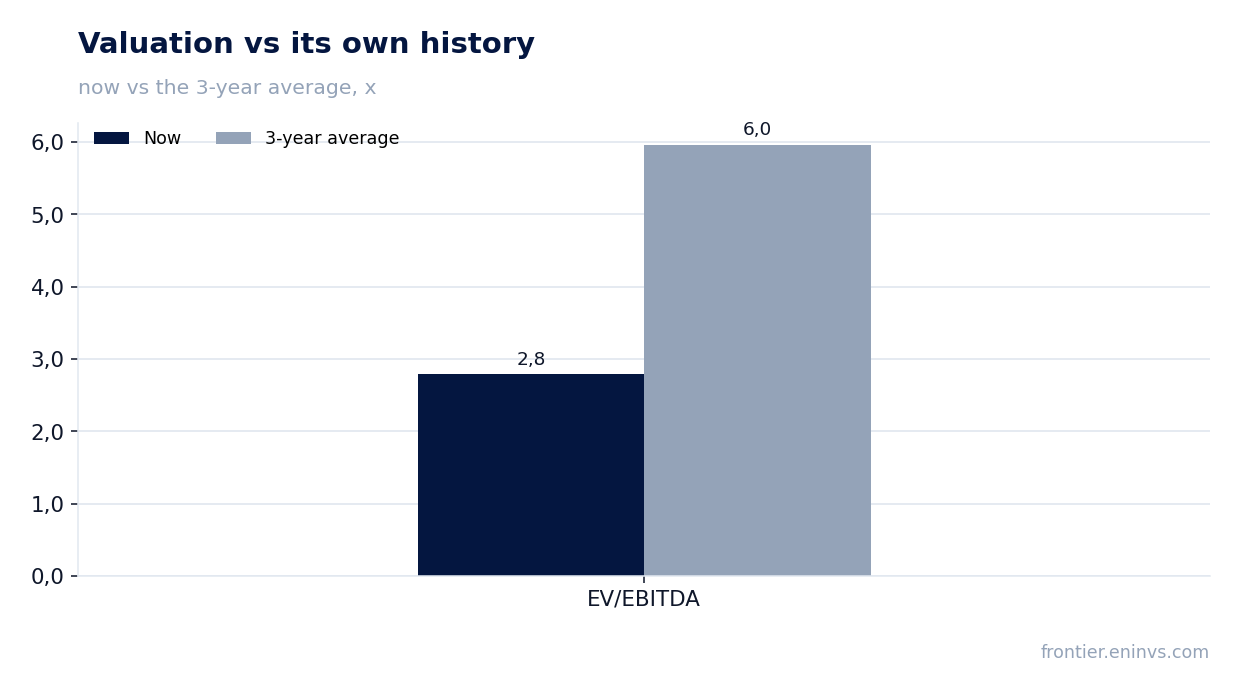
— Valuation at 2.84 EV/EBITDA is half its own three-year average
Attractiveness
Key figures, RUB bn
| Metric | Q2 2025 | Q2 2026 | Change |
|---|---|---|---|
| Revenue | 17.8 | 45.2 | +153.8% |
| EBITDA | 2.42 | 8.57 | +254.2% |
| Operating profit | 1.61 | 5.44 | +237.2% |
| Net profit | 0.30 | 2.45 | +719.6% |
| Operating cash flow | -0.03 | 4.23 | to profit |
| Capex | 1.10 | 7.36 | +566.8% |
| EBITDA margin | 13.6% | 19.0% | +5.4 pp |
| Net margin | 1.7% | 5.4% | +3.7 pp |
Revenue grew 2.5x, but quarterly profit is a third of the previous one
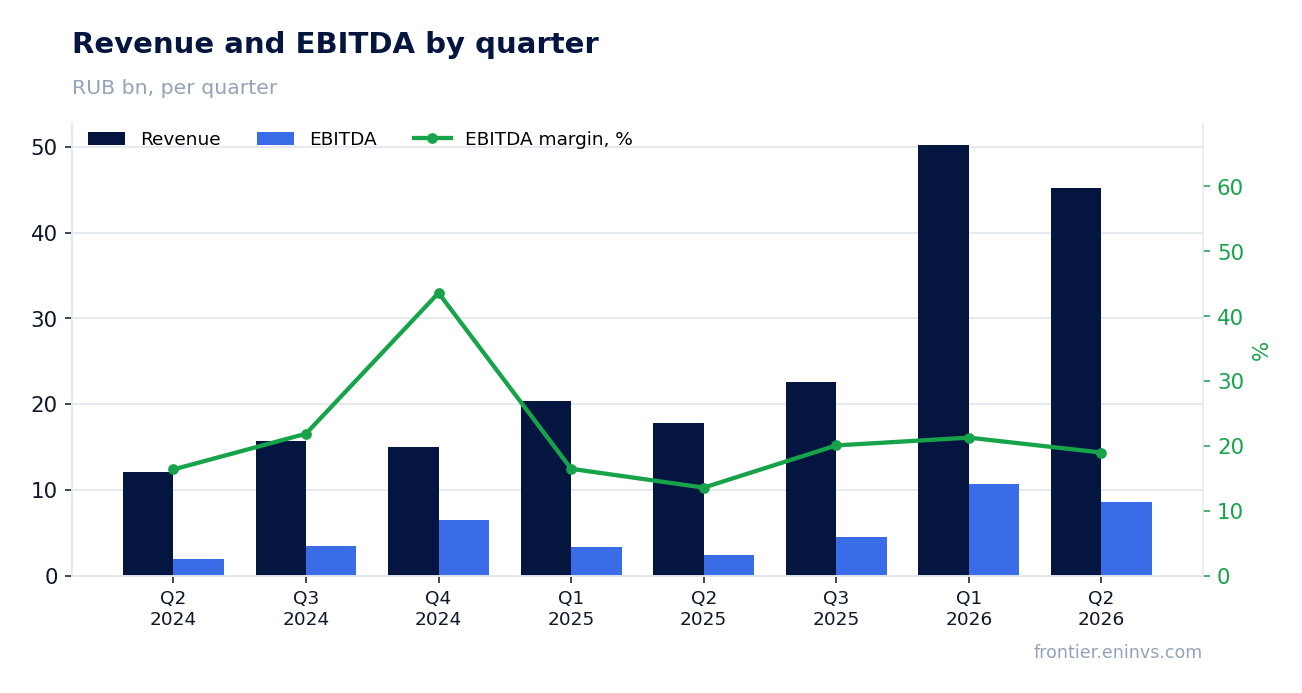
In Q2 2026, IDGC South's revenue reached 45.2 bn RUB, up 153.8% year on year. This is an acceleration from the 146.7% growth in Q1. However, compared to the previous quarter, revenue declined by 10% from 50.2 bn RUB in Q1.
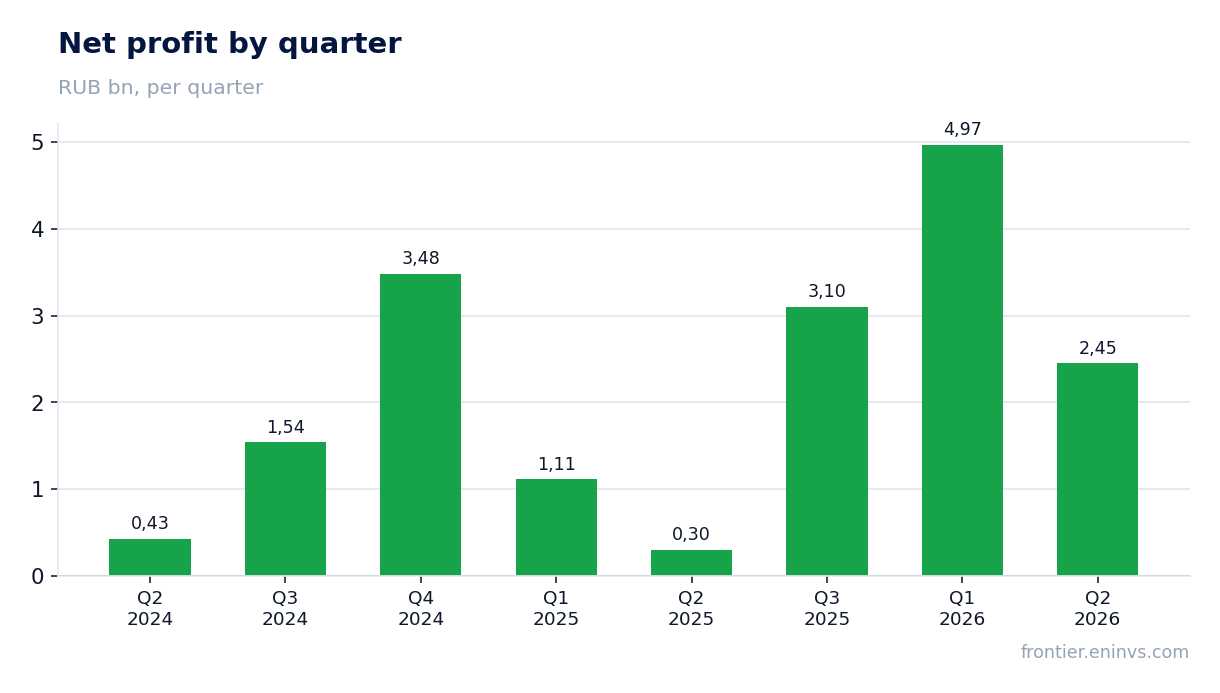
Net profit in Q2 was 2.45 bn RUB, up 719.6% year on year, but a third of the 4.97 bn RUB in Q1. EBITDA also declined from 10.7 bn RUB in Q1 to 8.6 bn RUB.
This dynamics is explained by the one-off base of Q1, when revenue and profit were abnormally high. Nevertheless, year on year the company shows multiple growth in financial indicators, driven by an increase in service volumes.
EBITDA margin rose to 19.0% from 13.6% a year earlier
EBITDA margin in Q2 2026 was 19.0% versus 13.6% a year earlier. The 5.4 pp increase came with a 2.5x rise in revenue, indicating positive operating leverage.
Net margin also increased from 1.7% to 5.4%. This is due to revenue growth outpacing costs, as well as economies of scale.
Operating profit in Q2 was 5.44 bn RUB, up 237% year on year. However, compared to Q1 it declined by 29%.
Debt rose to 39.4 bn RUB, leverage remains at 1.58 EBITDA LTM
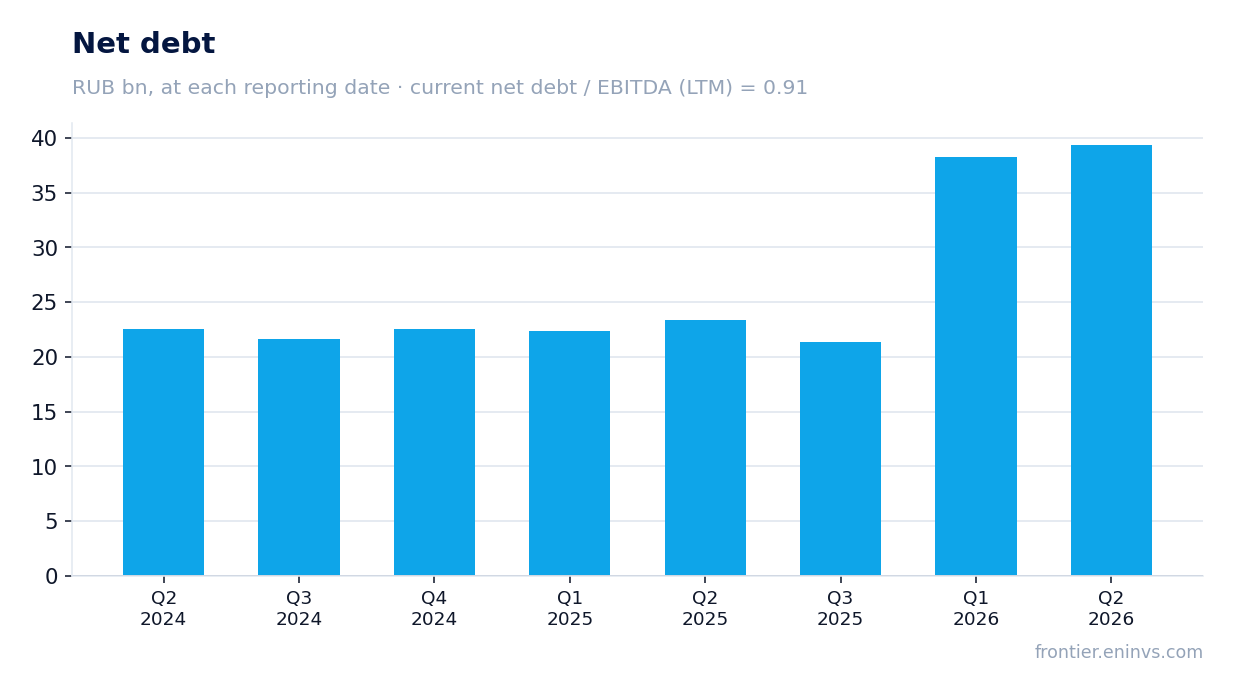
Net debt as of 30 June 2026 was 39.4 bn RUB, up from 38.2 bn RUB on 31 March 2026 (+1.2 bn RUB). Over the year, debt increased significantly from 23.4 bn RUB on 30 June 2025.
The net debt to EBITDA LTM ratio is 1.58. This is a moderate level that does not create excessive leverage.
Interest expenses are not disclosed in the provided data, but with the key rate at 14.0%, debt servicing remains a significant factor for profit.
Free cash flow remains negative due to capital expenditure
Operating cash flow in Q2 2026 was 4.23 bn RUB, significantly lower than 7.04 bn RUB in Q1. Capital expenditures remain high at 7.36 bn RUB in Q2.
Thus, free cash flow (operating cash flow minus capex) in Q2 is negative – minus 3.13 bn RUB. In Q1 it was also negative – minus 1.42 bn RUB.
Negative free cash flow forces the company to finance investments through debt, which explains the increase in net debt.
Dividend yield of 5.4% is half the fair level for the company
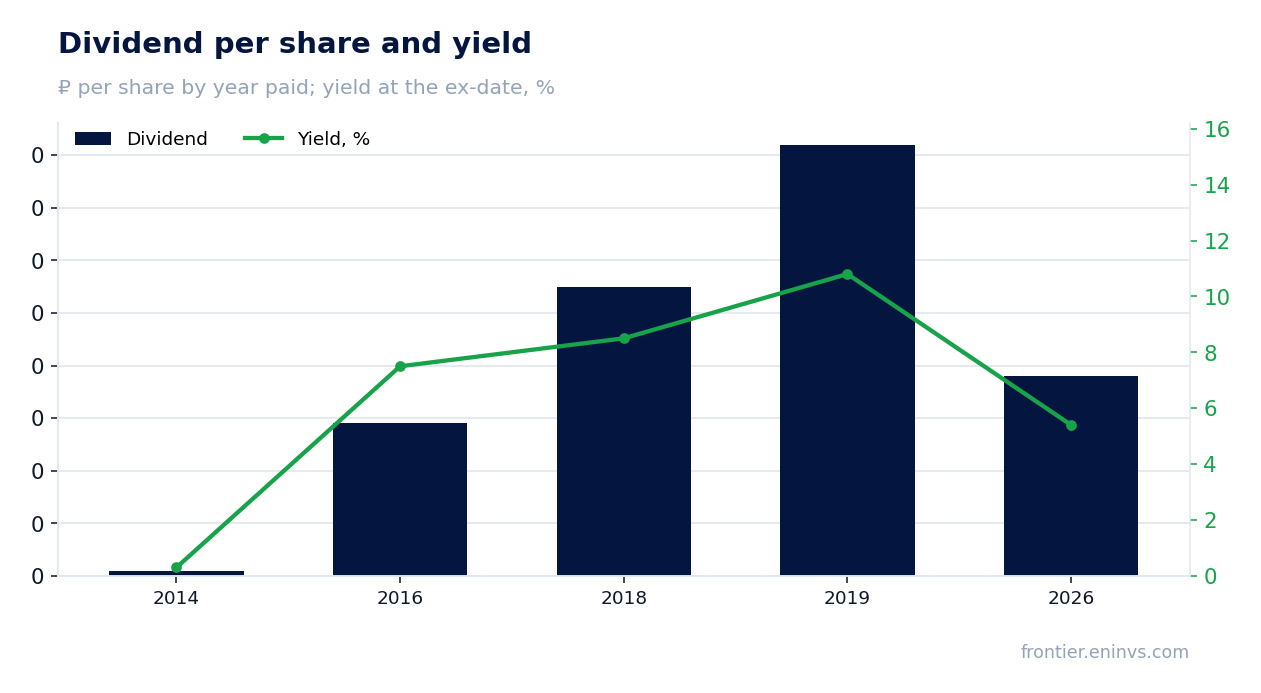
Over the last 12 months, the company paid dividends of 0.0038 RUB per share, giving a current yield of 5.4%. The fair yield for this stock, in our estimate, is 10.5%.
Our estimate for the current financial year's dividend is 0.0 RUB per share, corresponding to a yield of 1.7% on the current price. This is our forecast based on a payout ratio of 6.9% of LTM profit; the final decision is made by the board.
Historical dividend yields for IDGC South: 10.8% in 2019, 8.5% in 2018, 7.5% in 2016. The current yield is below these levels and below the key rate of 14.0%.
Valuation at 2.84 EV/EBITDA is half its own three-year average
The current EV/EBITDA LTM is 2.84. The three-year average of this multiple is 5.63. Thus, the stock trades significantly below its historical norm.
By P/E LTM, the company is valued at 4.15, also implying a low valuation. Market capitalisation is 48.1 bn RUB.
According to the portal's model, the upside to fair value is estimated at +20%. This is our own model, not a market consensus.
Valuation on the latest reported figures
| Metric | Value |
|---|---|
| Market cap | 48.1 bn ₽ |
| P/E (LTM) | 4.1 |
| EV/EBITDA (LTM) | 2.8 |
| P/B | 5.51 |
| Net debt / EBITDA (LTM) | 1.58 |
| Operating cash flow (LTM) | 17.2 bn |
| ROE | 11.2% |
| Dividend yield (12m) | 5.5% |
| EV/EBITDA, 3-year average | 5.6 |
Dividend per share, ₽, and yield at the ex-date
| Year paid | Dividend | Yield |
|---|---|---|
| 2014 | 0.00 | 0.3% |
| 2016 | 0.00 | 7.5% |
| 2018 | 0.01 | 8.5% |
| 2019 | 0.01 | 10.8% |
| 2026 | 0.00 | 5.4% |
| Our estimate, current year | 0.00 | 1.7% on the current price |
Bottom line
Bottom line: in Q2 2026, IDGC South showed multiple growth in revenue and profit year on year, but profit fell threefold relative to Q1. Margin improved, yet free cash flow remains negative due to high capex, and debt is growing. Dividend yield of 5.4% is half the fair level, and our estimate for the current year implies only 1.7%. At the same time, the valuation at 2.84 EV/EBITDA is half its own three-year average, offering a +20% upside on the portal's model. Verdict: the stock is attractive for dividend-oriented holders, but only if payouts recover.
Open the company's financial profile MRKY →
See also: market overview · valuation map · stock screeners