IDGC North West: profit tripled, but all of the quarterly EBITDA growth came off a low base a year ago
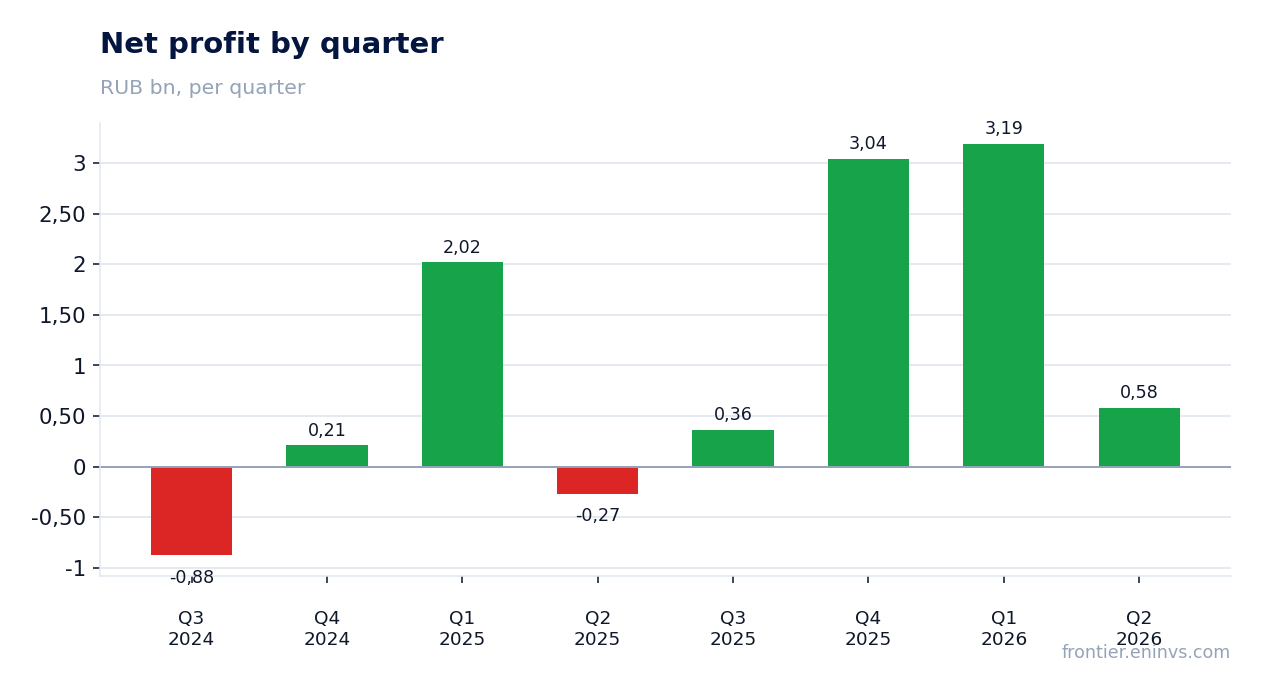
On 28 September IDGC North West reported results for the second quarter of 2026. Revenue came in at RUB 19.6 bn, up 12.7% year on year, EBITDA rose to RUB 2.5 bn, and net profit reached RUB 0.6 bn against a loss a year earlier. The 119.7% jump in EBITDA is explained by the low base of the second quarter of 2025, when the figure was RUB 1.2 bn; against the level of the first quarter of 2026 the result is noticeably more modest. At the same time, revenue growth decelerated from 21.1% in the first quarter to 12.7% in the second, and operating cash flow turned negative at RUB 0.4 bn. At the current price the share looks attractive: EV/EBITDA LTM of 0.76 against a three-year average of 1.14, while the portal's model implies 138% upside.
Key takeaways
— Revenue growth decelerated from 21.1% in the first quarter to 12.7% in the second
— EBITDA rose 119.7% on the low base of last year, not on business improvement
— EBITDA margin rose to 13.0% from 6.7% a year earlier, but remains far from first-quarter levels
— Operating cash flow turned negative at RUB 0.4 bn with capital expenditure of RUB 2.3 bn
— Net debt fell from RUB 5.3 bn on 30 June 2025 to RUB 0.6 bn on 30 June 2026
— No dividends were paid over the last 12 months, and our estimate of the next payout is RUB 0.0 per share
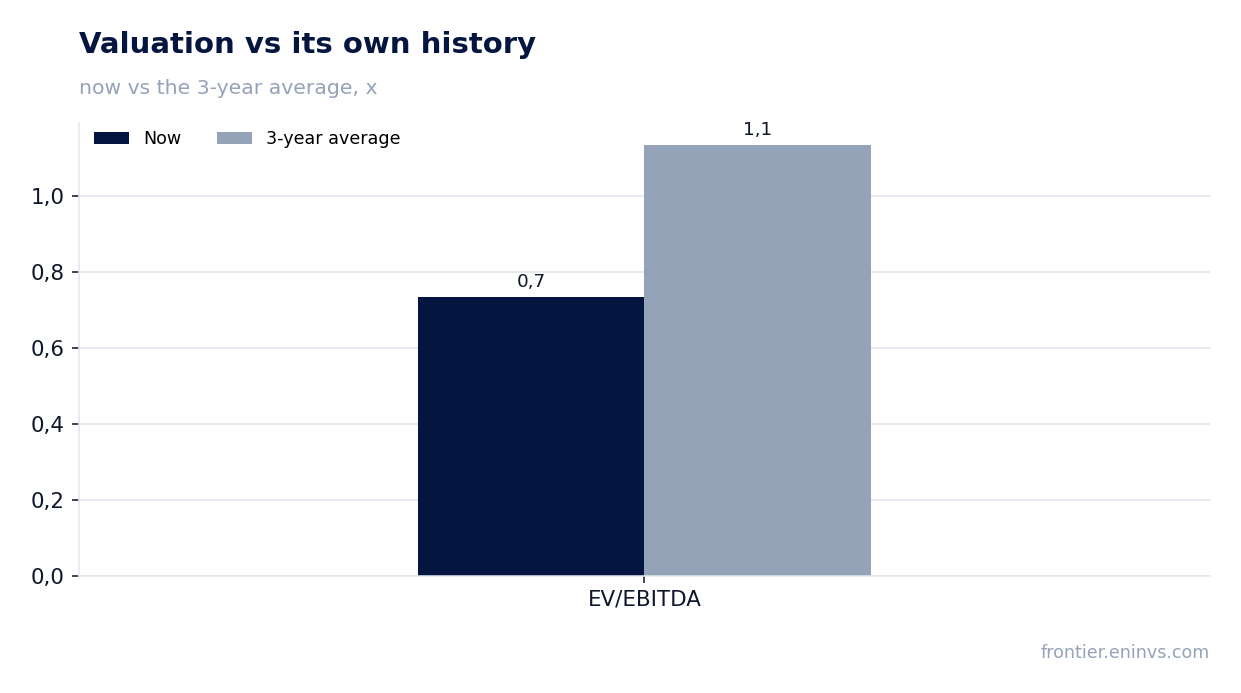
— EV/EBITDA LTM of 0.76 against a three-year average of 1.14 – the share trades below its own history
Attractiveness
Key figures, RUB bn
| Metric | Q2 2025 | Q2 2026 | Change |
|---|---|---|---|
| Revenue | 17.4 | 19.6 | +12.7% |
| EBITDA | 1.16 | 2.54 | +119.7% |
| Operating profit | -0.21 | 0.98 | to profit |
| Net profit | -0.27 | 0.58 | to profit |
| Operating cash flow | 0.65 | -0.41 | -163.5% |
| Capex | 1.55 | 2.33 | +50.4% |
| EBITDA margin | 6.7% | 13.0% | +6.3 pp |
| Net margin | -1.6% | 3.0% | +4.6 pp |
Revenue growth decelerated from 21.1% in the first quarter to 12.7% in the second
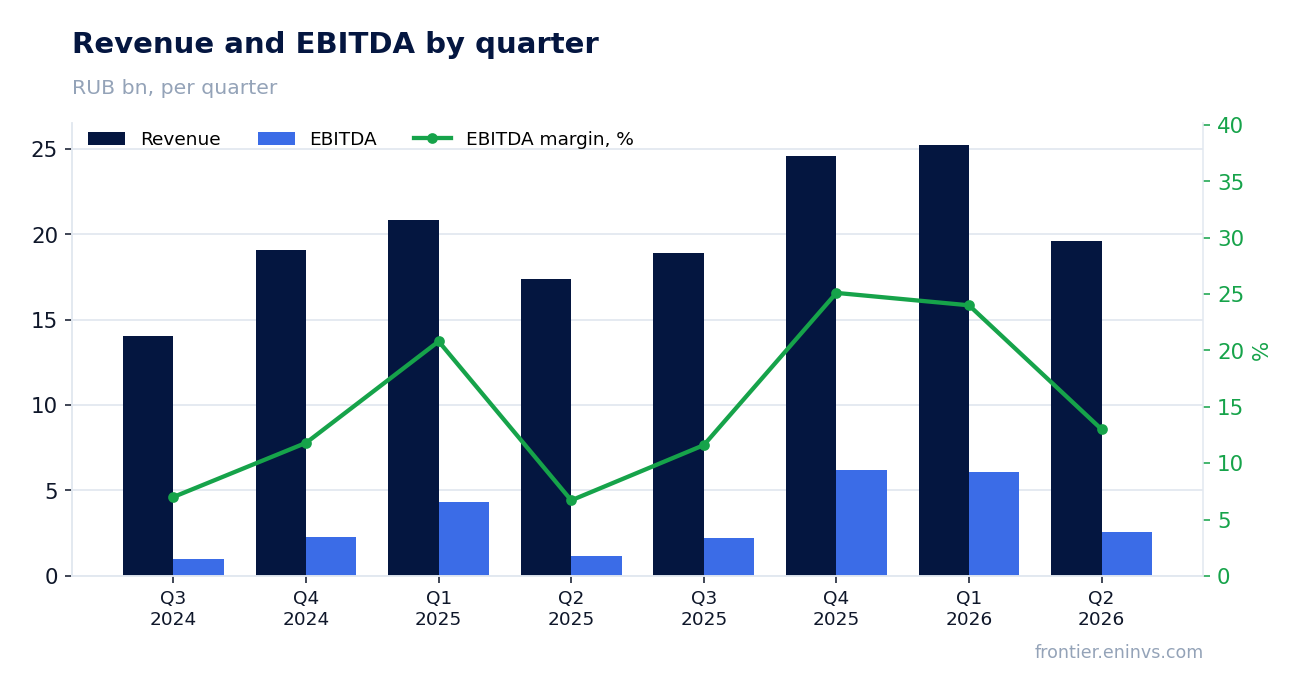
Revenue in the second quarter of 2026 was RUB 19.6 bn, up 12.7% year on year. That is noticeably more modest than in the first quarter, when growth reached 21.1%. The deceleration comes against the high base of the second quarter of 2025, but the absolute revenue level in the second quarter was also lower than in the first (RUB 25.2 bn).
The quarterly revenue dynamics show that after a strong first quarter the company returned to more moderate growth. In the fourth quarter of 2025 revenue was RUB 24.6 bn, in the first quarter of 2026 – RUB 25.2 bn, and in the second – RUB 19.6 bn. The decline relative to the previous quarter may be due to seasonality, but in the absence of company explanations we note only the fact of deceleration.
For an investor, it is important that the slowdown in revenue growth coincides with rising capital expenditure and negative operating cash flow. This puts pressure on free cash flow and limits the scope for dividend payments.
EBITDA rose 119.7% on the low base of last year, not on business improvement
EBITDA in the second quarter of 2026 was RUB 2.5 bn, up 119.7% from the second quarter of 2025, when the figure was only RUB 1.2 bn. This growth is explained entirely by the low base of last year: then EBITDA was the lowest in several quarters.
Compared with the first quarter of 2026, when EBITDA reached RUB 6.1 bn, the second-quarter result looks significantly more modest. This suggests that the improvement is not a sustainable trend but rather a recovery from a weak period.
Operating profit in the second quarter was RUB 1.0 bn against a loss of RUB 0.2 bn a year earlier. The rise in operating profit is also due to the low base, but its absolute level remains low relative to revenue.
EBITDA margin rose to 13.0% from 6.7% a year earlier, but remains far from first-quarter levels
EBITDA margin in the second quarter of 2026 was 13.0%, nearly double the figure a year earlier (6.7%). The margin improvement is explained by revenue growing faster than costs, but to a large extent it is a consequence of the low base of last year.
In the first quarter of 2026, EBITDA margin was around 24.0% (EBITDA of RUB 6.1 bn on revenue of RUB 25.2 bn). Thus, in the second quarter the margin is significantly lower, indicating the improvement is not stable.
Net margin in the second quarter was 3.0% against a negative margin a year earlier (-1.6%). The return to positive territory is a positive fact, but the absolute value remains low.
Operating cash flow turned negative at RUB 0.4 bn with capital expenditure of RUB 2.3 bn
Operating cash flow in the second quarter of 2026 was negative at RUB 0.4 bn, whereas a year earlier it was positive (RUB 0.7 bn). This is a warning signal, given that the company incurs significant capital expenditure.
Capital expenditure in the second quarter was RUB 2.3 bn, comparable to the level a year earlier (RUB 1.6 bn). With negative operating cash flow, the company funds investments through debt or by reducing cash balances.
Over the last 12 months, operating cash flow amounted to RUB 10.5 bn, still significantly above capital expenditure for the same period. However, the quarterly dynamics show deterioration, and this requires attention.
Net debt fell from RUB 5.3 bn on 30 June 2025 to RUB 0.6 bn on 30 June 2026
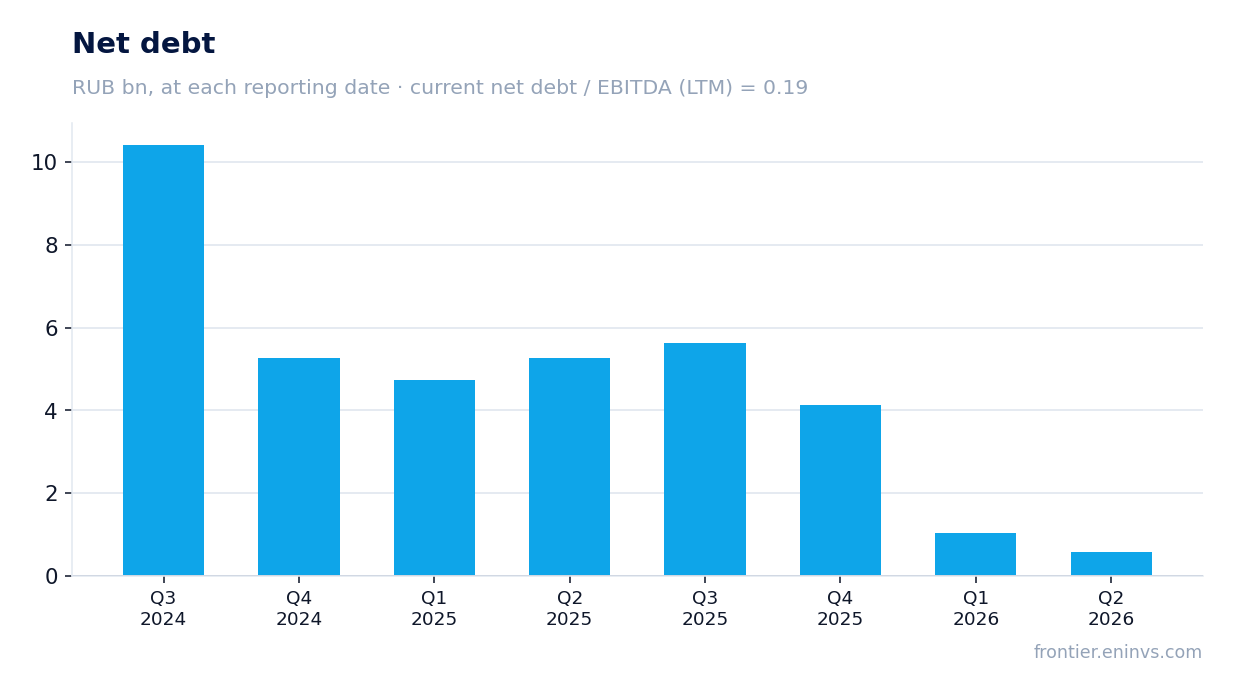
Net debt as of 30 June 2026 was RUB 0.6 bn, down from RUB 5.3 bn on 30 June 2025. The decline over the year was RUB 4.7 bn. This is a positive fact that reduces debt burden.
The net debt to EBITDA LTM ratio is 0.03, an extremely low level. The company has virtually no debt burden, which gives it financial stability.
The debt reduction occurred against negative operating cash flow in the second quarter, which may indicate the use of cash reserves or refinancing. However, the debt level remains comfortable.
No dividends were paid over the last 12 months, and our estimate of the next payout is RUB 0.0 per share
Over the last 12 months the company paid no dividends. Our model estimates the next payout at RUB 0.0 per share as well. This means the dividend yield remains zero.
The fair yield we consider for this name is 12.0%, significantly above the current level. At the same time, the central bank key rate is 14.0%, so even the fair yield is below the key rate, making the share less attractive for income investors.
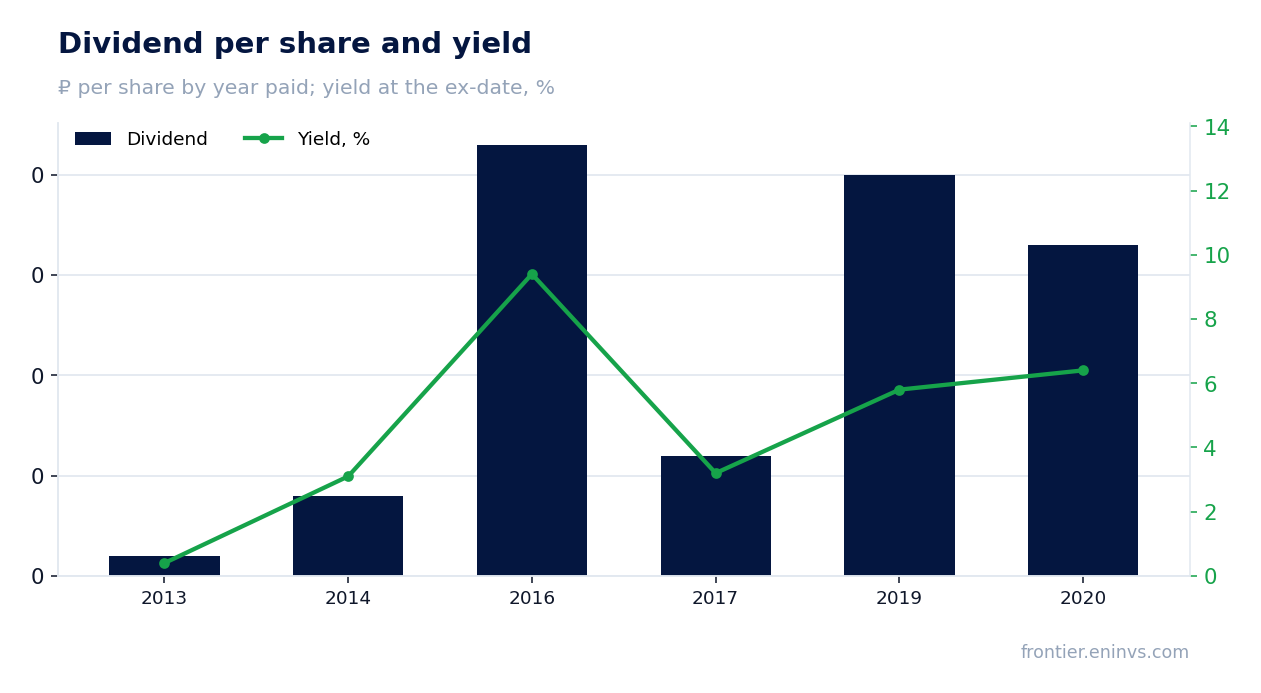
Historically the company paid dividends, but they were symbolic: for example, in 2020 – RUB 0.0033 per share with a yield of 6.4%. There have been no payouts in recent years, and none are expected in the near term due to negative free cash flow and high capital expenditure.
EV/EBITDA LTM of 0.76 against a three-year average of 1.14 – the share trades below its own history
EV/EBITDA LTM is 0.76, below the three-year average of 1.14. This indicates the share is valued cheaper than usual over the past three years.
P/E LTM is 1.71, also very low. Market capitalisation is RUB 12.2 bn, and EV/EBITDA LTM is 0.76. Low multiples may reflect risks associated with negative cash flow and absence of dividends.
Our valuation model (the portal's model) implies upside to fair value of +138%. This is substantial upside, but it is based on the assumption of recovering cash flows and EBITDA growth.
Valuation on the latest reported figures
| Metric | Value |
|---|---|
| Market cap | 12.2 bn ₽ |
| P/E (LTM) | 1.7 |
| EV/EBITDA (LTM) | 0.8 |
| P/B | 0.51 |
| Net debt / EBITDA (LTM) | 0.03 |
| Operating cash flow (LTM) | 10.5 bn |
| ROE | 8.4% |
| EV/EBITDA, 3-year average | 1.1 |
Dividend per share, ₽, and yield at the ex-date
| Year paid | Dividend | Yield |
|---|---|---|
| 2013 | 0.00 | 0.4% |
| 2014 | 0.00 | 3.1% |
| 2016 | 0.00 | 9.4% |
| 2017 | 0.00 | 3.2% |
| 2019 | 0.00 | 5.8% |
| 2020 | 0.00 | 6.4% |
Bottom line
Bottom line: in the second quarter of 2026 IDGC North West showed revenue growth of 12.7% and a significant increase in EBITDA of 119.7%, but this growth is mainly due to the low base of last year. EBITDA margin improved to 13.0%, but remains below first-quarter levels. Operating cash flow turned negative, and no dividends are paid. At the same time, net debt fell to RUB 0.6 bn, and the EV/EBITDA LTM multiple (0.76) is below the three-year average (1.14). At the current price the share looks attractive for investors willing to accept the risks of no dividends and unstable cash flow, but it is hardly suitable for conservative investors.
Open the company's financial profile MRKZ →
See also: market overview · valuation map · stock screeners