Mosenergo: revenue fell 8.4% while EBITDA slipped to a RUB 5.4 bn loss on rising costs
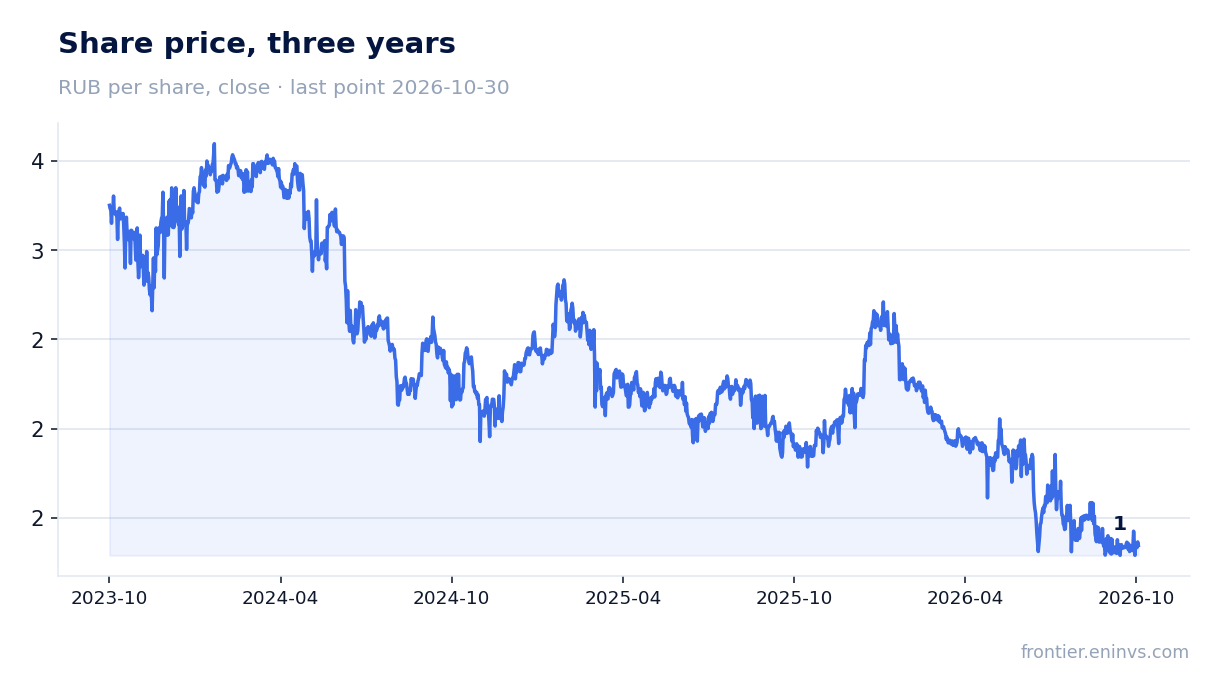
On 1 November Mosenergo released its third-quarter 2026 results. Revenue fell 8.4% year on year to RUB 45.7 bn, EBITDA came in at a RUB 5.4 bn loss versus a RUB 1.8 bn loss a year earlier, and the net loss reached RUB 5.6 bn. Yet the stock trades below its own history on EV/EBITDA (1.1 versus a three-year average of 2.5) and offers a 16.8% dividend yield, so at the current price the share looks rather attractive, though weak results and the risk of a payout cut keep it from a higher rating.
Key takeaways
— Q3 revenue fell 8.4% year on year to RUB 45.7 bn – after 15.3% growth in Q2, the dynamics decelerated
— EBITDA slipped to a RUB 5.4 bn loss and the operating loss reached RUB 9.7 bn – costs are rising faster than revenue
— The quarterly net loss of RUB 5.6 bn pushed the net margin to minus 12.3%
— Operating cash flow stayed positive at RUB 3.4 bn, but capital expenditure of RUB 9.8 bn outweighed it
— Net debt stood at minus RUB 30.3 bn on 30 September 2026 – the company retains a net cash position
— The 16.8% dividend yield is well above the 10.5% we consider fair and the 14.0% key rate, but the payout hinges on profit
— LTM EV/EBITDA of 1.1 is below its own three-year average of 2.5 – the stock is cheaper than its history on this multiple
Attractiveness
Key figures, RUB bn
| Metric | Q3 2025 | Q3 2026 | Change |
|---|---|---|---|
| Revenue | 49.9 | 45.7 | -8.4% |
| EBITDA | -1.80 | -5.42 | — |
| Operating profit | -5.59 | -9.67 | — |
| Net profit | -2.60 | -5.64 | — |
| Operating cash flow | 2.91 | 3.39 | +16.3% |
| Capex | 5.01 | 9.81 | +95.8% |
| EBITDA margin | -3.6% | -11.8% | -8.2 pp |
| Net margin | -5.2% | -12.3% | -7.1 pp |
Q3 revenue fell 8.4% year on year to RUB 45.7 bn – after 15.3% growth in Q2, the dynamics decelerated
In the third quarter of 2026 Mosenergo's revenue amounted to RUB 45.7 bn, 8.4% less than a year earlier. In the second quarter the same metric grew 15.3%, so the quarter-on-quarter comparison shows deceleration: growth turned into a decline.
The revenue decline came in a quarter when the company had already reported growth in the first half. Over nine months the dynamics remain mixed: a strong first quarter with revenue of RUB 118.4 bn partly offset weak second and third quarters.
For an investor, the fact of the decline matters less than the fact that it occurred against rising costs. If revenue does not recover, pressure on profit will persist in the next report.
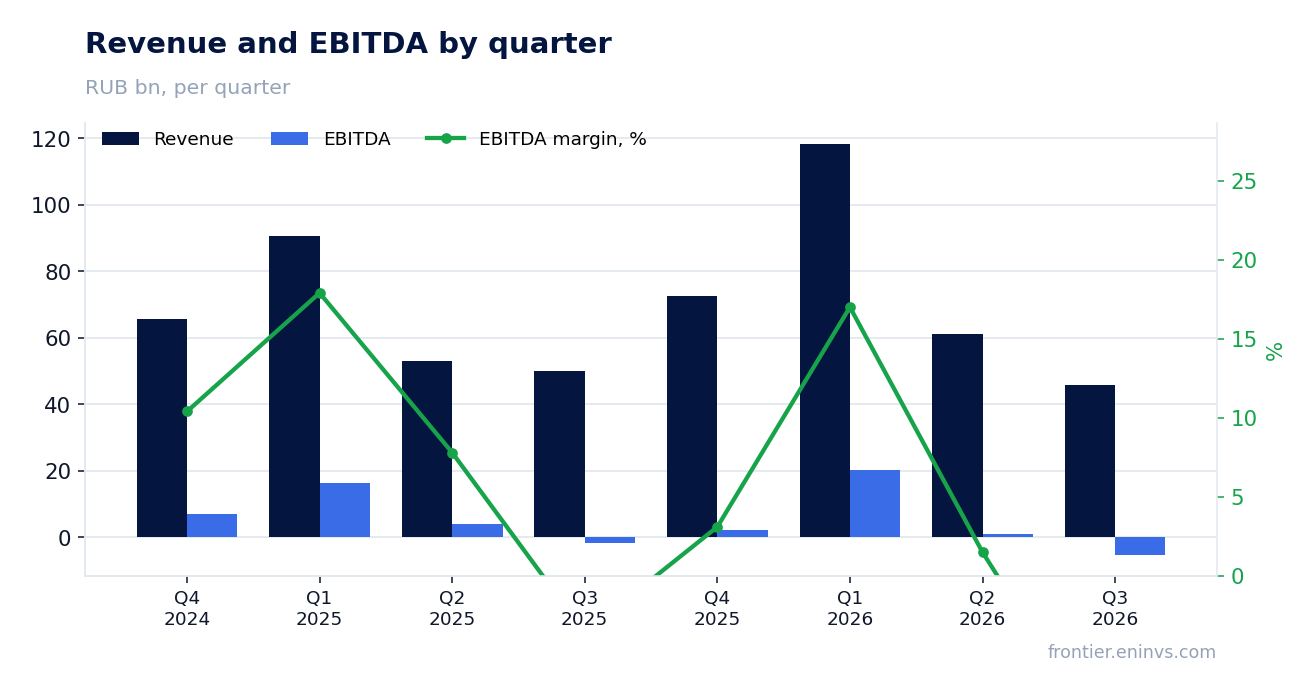
EBITDA slipped to a RUB 5.4 bn loss and the operating loss reached RUB 9.7 bn – costs are rising faster than revenue
EBITDA in the third quarter was a loss of RUB 5.4 bn versus a RUB 1.8 bn loss a year earlier. The operating loss reached RUB 9.7 bn, compared with RUB 5.6 bn a year ago.
The EBITDA margin in the reported quarter was minus 11.8% versus minus 3.6% a year earlier. The gap between revenue and costs widened: with revenue down 8.4%, expenses did not shrink proportionally.
Negative EBITDA means that operating activity in this quarter generated no profit before depreciation. For a company with regulated tariffs such a result is atypical and requires an explanation from management.
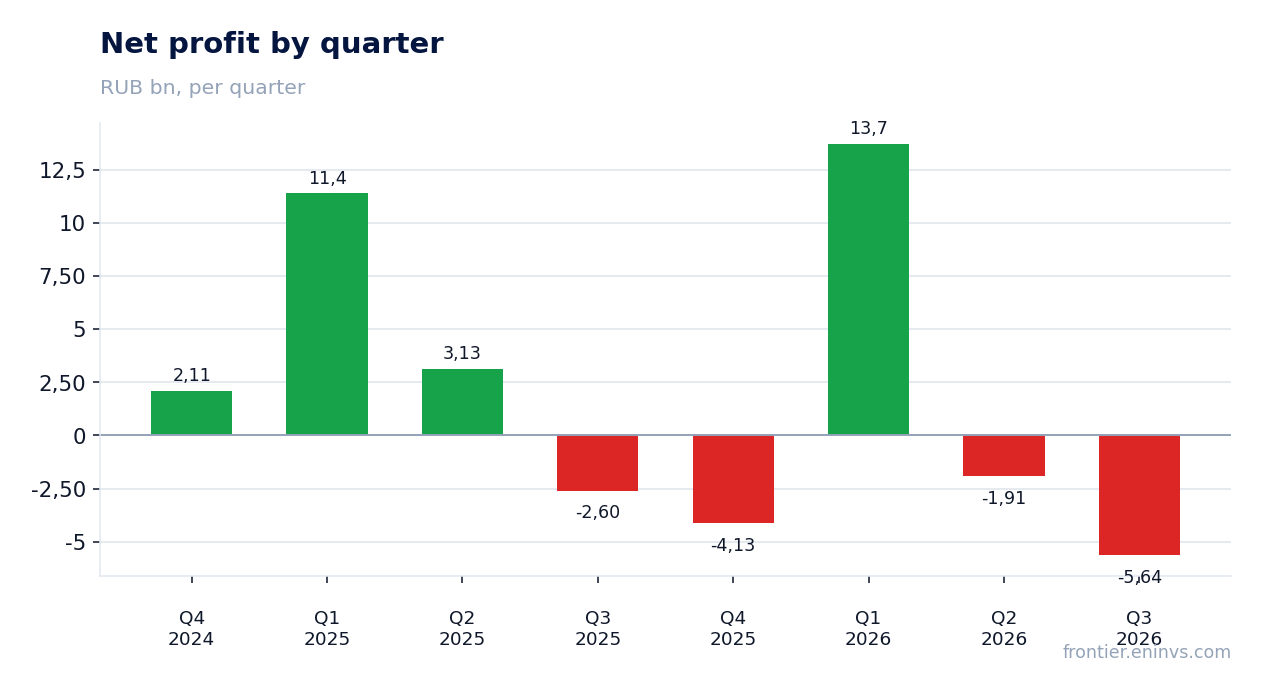
The quarterly net loss of RUB 5.6 bn pushed the net margin to minus 12.3%
The net loss for the third quarter of 2026 amounted to RUB 5.6 bn versus a RUB 2.6 bn loss a year earlier. The net margin fell to minus 12.3% from minus 5.2% a year earlier.
The loss formed at the operating level: negative EBITDA and an operating loss of RUB 9.7 bn outweighed other items. Over the last 12 months net profit remains positive at RUB 6.3 bn, but the quarterly result is pulling it down.
Return on equity over the last 12 months is negative at minus 7.4%. This reflects the weakness of the current year, not just one quarter.
Operating cash flow stayed positive at RUB 3.4 bn, but capital expenditure of RUB 9.8 bn outweighed it
Operating cash flow in the third quarter amounted to RUB 3.4 bn – a positive result despite negative EBITDA. Capital expenditure reached RUB 9.8 bn, more than double the operating flow.
The RUB 6.4 bn gap between capital expenditure and operating flow means the investment programme was financed from accumulated funds. Over the last 12 months operating flow was RUB 14.6 bn.
This matters for the dividend story: if capital expenditure stays at this level, free cash flow will be constrained, and payouts will have to be covered from prior-period profit.
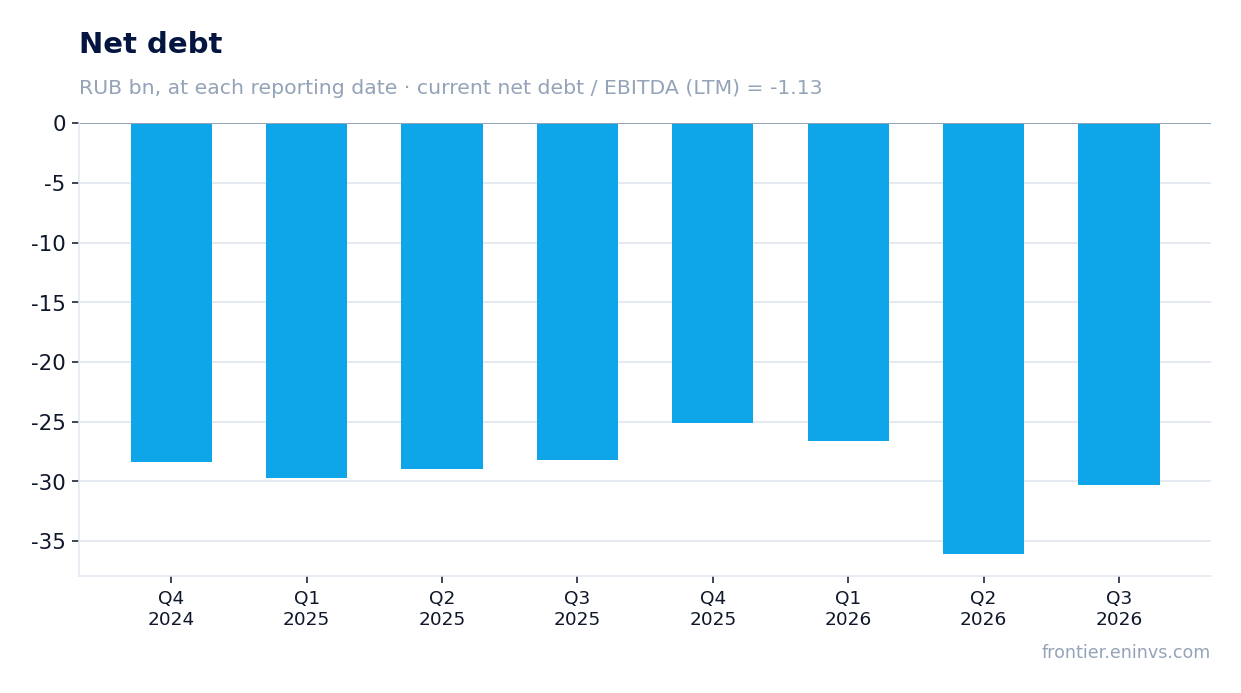
Net debt stood at minus RUB 30.3 bn on 30 September 2026 – the company retains a net cash position
As of 30 September 2026 Mosenergo's net debt stood at minus RUB 30.3 bn – the company has a net cash position. From 30 June 2026 the metric changed from minus RUB 36.1 bn to minus RUB 30.3 bn (+RUB 5.8 bn).
Over the year, from 30 September 2025, net debt changed from minus RUB 28.2 bn to minus RUB 30.3 bn (–RUB 2.1 bn). The cash cushion remains substantial.
The net debt to EBITDA ratio over the last 12 months is minus 1.13 – the negative value reflects the net cash position. This is a level, not a direction of change.
The 16.8% dividend yield is well above the 10.5% we consider fair and the 14.0% key rate, but the payout hinges on profit
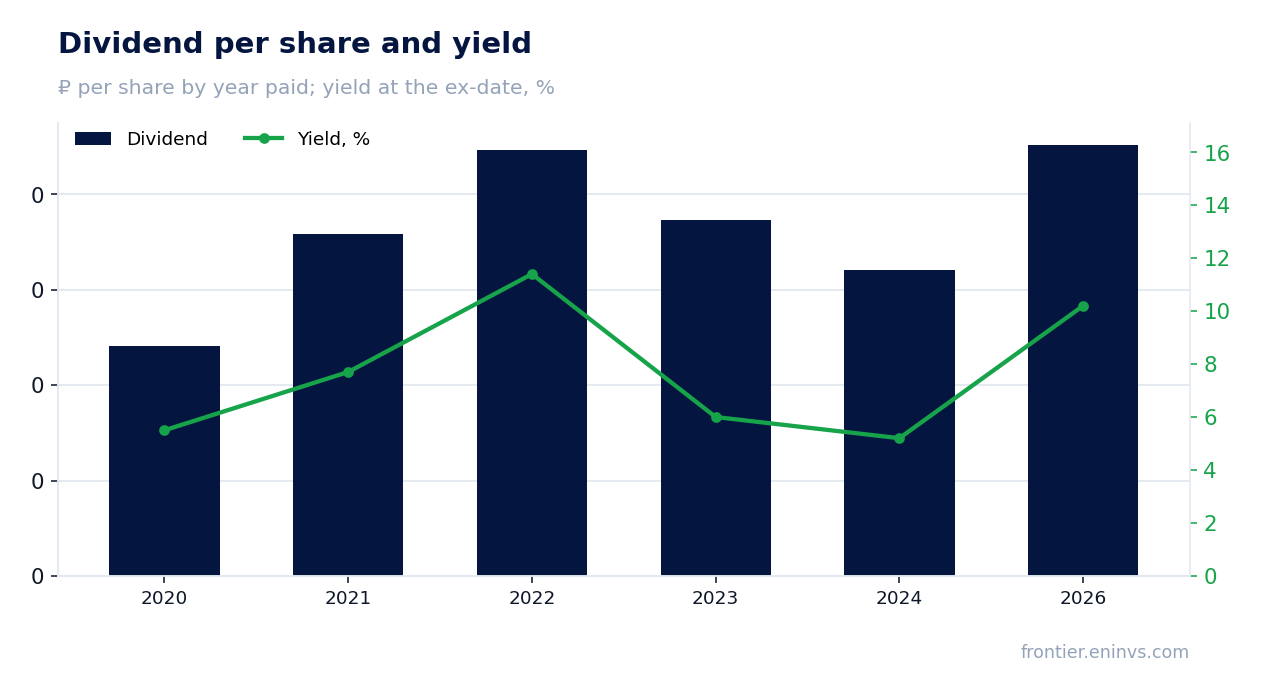
Over the last 12 months Mosenergo paid RUB 0.2261 per share, which at the current price gives a yield of 16.8%. That is above the 14.0% key rate and well above the 10.5% yield we consider fair for the stock.
Our estimate of the annual dividend is RUB 0.23 per share, corresponding to a 17.0% yield at the current price. The estimate relies on the dividend-potential model with a payout ratio of 0.96 of profit and a profit base of RUB 8.6 bn.
The payout history is uneven: RUB 0.1604 per share was paid in 2024, RUB 0.1865 in 2023, and RUB 0.2231 in 2022. The yield at the ex-date price ranged from 5.2% to 11.4%.
The risk to the dividend is the third-quarter loss. If full-year profit comes in below the RUB 8.6 bn base, the payout may be smaller than our estimate. The board decides.
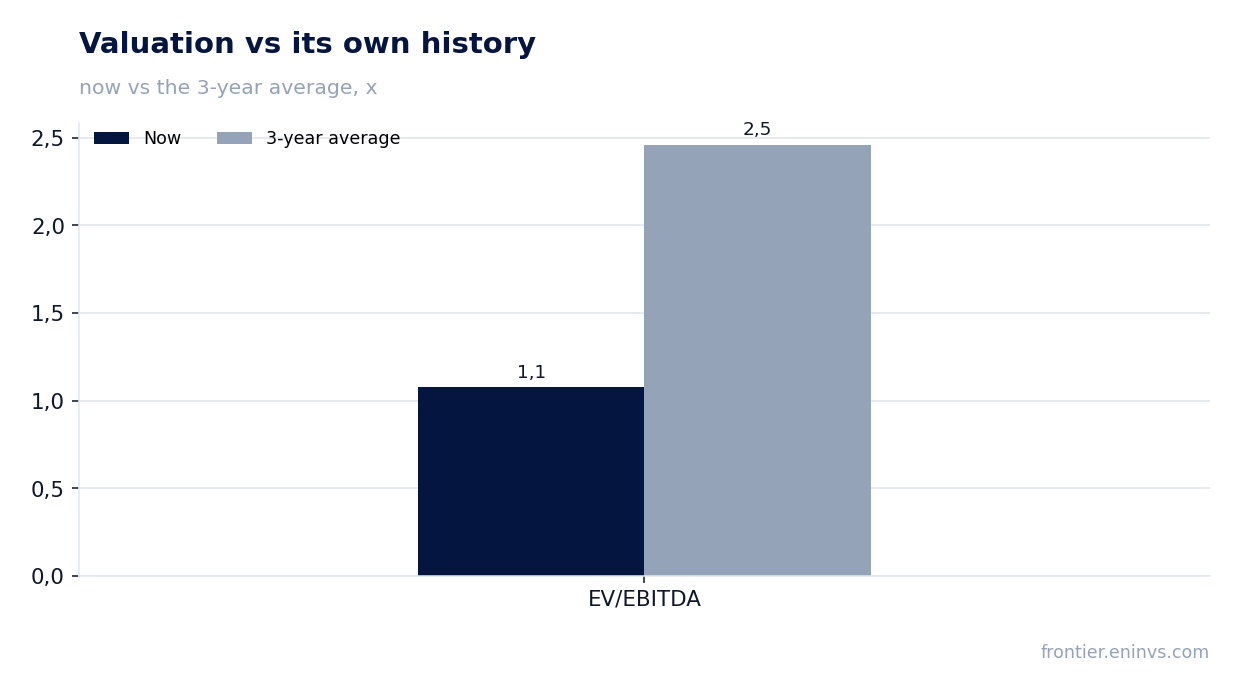
LTM EV/EBITDA of 1.1 is below its own three-year average of 2.5 – the stock is cheaper than its history on this multiple
LTM EV/EBITDA is 1.1 – 56% below its own three-year average of 2.5. On this multiple the stock is cheaper than its history.
The LTM P/E is 8.6. With a market capitalisation of RUB 53.9 bn and a net cash position of RUB 30.3 bn, the valuation looks low, but it reflects weak current profit.
A low multiple does not necessarily mean undervaluation: the market is pricing in the risk of repeated losses. If profit recovers, the multiple can rise without a change in the share price.
Valuation on the latest reported figures
| Metric | Value |
|---|---|
| Market cap | 53.9 bn ₽ |
| P/E (LTM) | 8.6 |
| EV/EBITDA (LTM) | 1.1 |
| P/B | 0.14 |
| Net debt / EBITDA (LTM) | -1.13 |
| Operating cash flow (LTM) | 14.6 bn |
| ROE | -7.4% |
| Dividend yield (12m) | 16.8% |
| EV/EBITDA, 3-year average | 2.5 |
Dividend per share, ₽, and yield at the ex-date
| Year paid | Dividend | Yield |
|---|---|---|
| 2020 | 0.12 | 5.5% |
| 2021 | 0.18 | 7.7% |
| 2022 | 0.22 | 11.4% |
| 2023 | 0.19 | 6.0% |
| 2024 | 0.16 | 5.2% |
| 2026 | 0.23 | 10.2% |
Bottom line
The strong side of the report is the retained net cash position of RUB 30.3 bn and positive operating flow of RUB 3.4 bn. The weak side is negative EBITDA of RUB 5.4 bn and a net loss of RUB 5.6 bn, which outweigh the dividend appeal. The stock trades below its own history on EV/EBITDA (1.1 versus 2.5), and the 16.8% yield is above the 10.5% we consider fair. The key question for a holder is whether profit recovers to a level that keeps the RUB 0.23 per share dividend covered.
Open the company's financial profile MSNG →
See also: market overview · valuation map · stock screeners