MTS H1 2026: net profit up 8x, but the real question is whether cash covers dividends and capex

On August 25, MTS reported H1 2026 results: revenue up 11.8% to RUB 414.7 bn, OIBDA up 17.1% to RUB 159.3 bn, and net profit up 8.3x to RUB 74.0 bn. This review looks behind the profit jump and why cash flow remains under pressure.
Key takeaways
— Net profit for the half-year rose 8x, but almost all of it came from one-off items
— OIBDA grows faster than revenue thanks to operating leverage and cost control
— Debt burden remains high, and interest expenses eat into operating growth
— Capex rose 40%, but operating cash flow still covers it
— Dividend of RUB 35 per share yields 19.3%, but the payout exceeds free cash flow
— Valuation below history: EV/EBITDA 3.3 vs 4.1 three-year average
Key figures, RUB bn
| Metric | H1 2025 | H1 2026 | Change |
|---|---|---|---|
| Revenue | 371 | 415 | +11.8% |
| EBITDA | 136 | 159 | +17.1% |
| Operating profit | 71.3 | 89.2 | +25.2% |
| Net profit | 8.87 | 74.0 | +734.9% |
| Operating cash flow | 117 | — | — |
| Capex | 29.0 | 75.9 | +161.3% |
| EBITDA margin | 36.7% | 38.4% | +1.7 pp |
| Net margin | 2.4% | 17.9% | +15.5 pp |
Net profit for the half-year rose 8x, but almost all of it came from one-off items
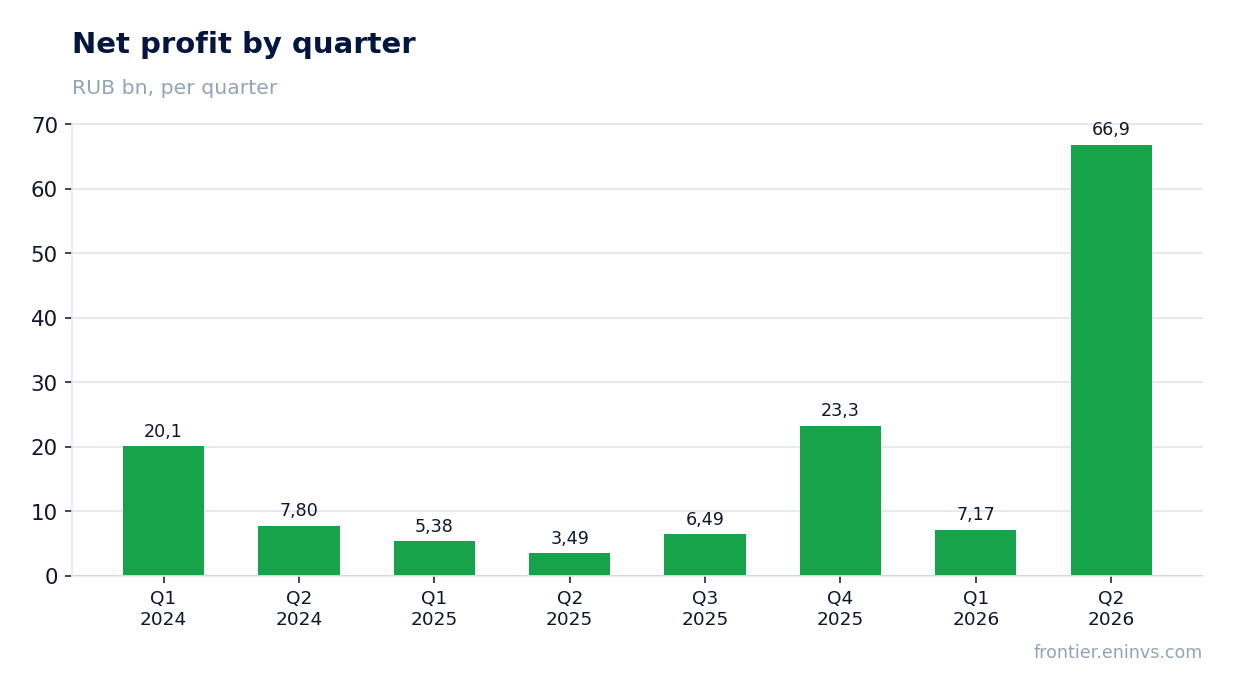
For H1 2026, MTS net profit reached RUB 74.0 bn versus RUB 8.9 bn a year earlier – an 8.3x increase. The main contribution came from Q2, where profit hit RUB 66.9 bn, while Q1 was only RUB 7.2 bn.
The key factor is the sale of a stake in tower infrastructure, reflected in other non-operating income. Without this one-off, profit would have stayed around RUB 7–8 bn per quarter, comparable to last year.
Operating profit for the half-year rose 17.1% to RUB 89.2 bn, but net profit grew many times faster – a clear sign that the growth is driven by items below operating profit, not by operations.
OIBDA grows faster than revenue thanks to operating leverage and cost control
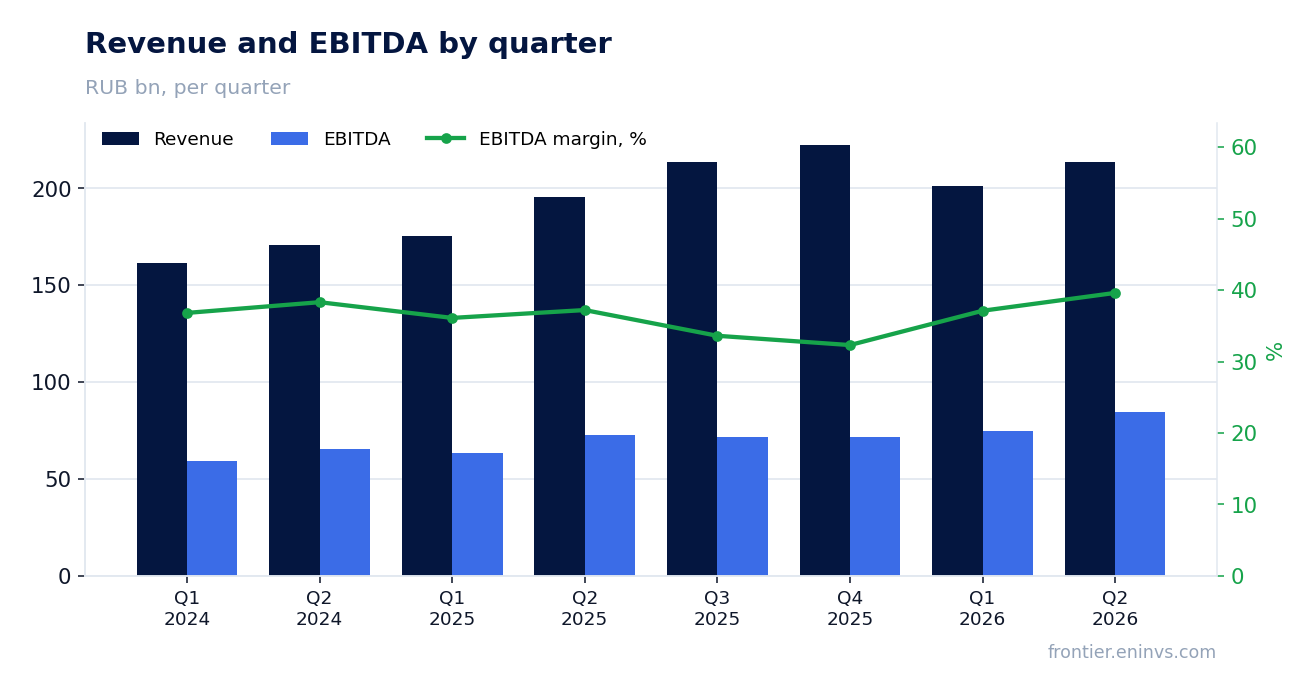
Revenue for H1 rose 11.8% to RUB 414.7 bn, while OIBDA grew 17.1% to RUB 159.3 bn. OIBDA margin expanded from 36.7% to 38.4% – the best in recent years.
In Q2, dynamics accelerated: revenue +9.2% YoY, OIBDA +16.3% to RUB 84.6 bn, margin reached 39.6%. The main contribution came from telecom services, especially interconnect (B2O), whose revenue grew 33.7% in Q1.
Operating leverage worked: with revenue up 12%, OIBDA rose 17%, indicating control over commercial and administrative expenses. However, part of this effect may be temporary – if cost inflation accelerates, margin will start to compress.
Debt burden remains high, and interest expenses eat into operating growth
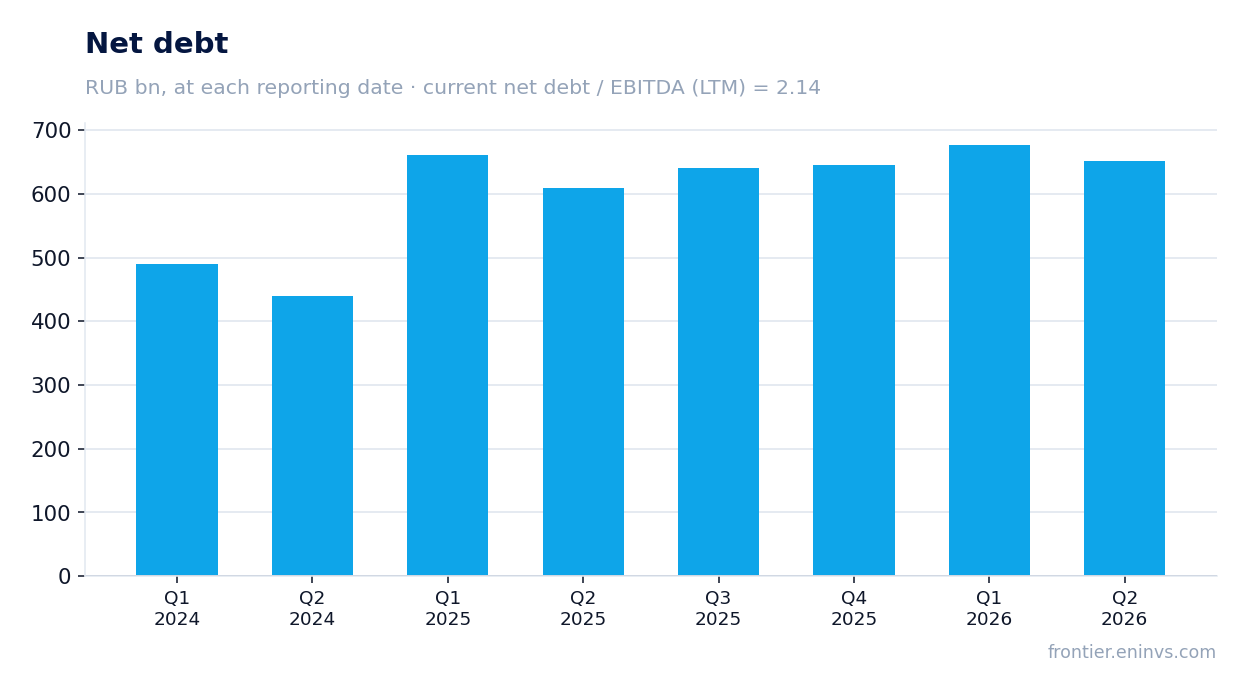
Net debt at end-Q2 stood at RUB 651.9 bn, up RUB 98.4 bn over the year. Net debt / EBITDA for the last 12 months is 2.14, above the telecom average but not critical.
Interest expenses for H1 were around RUB 68 bn (estimated from quarterly data), comparable to half of OIBDA. Even with the rate cuts the company expects, the debt burden will remain significant.
The company placed 4 bond issues worth RUB 60 bn in 2026, replacing expensive bank funding. This should lower the cost of debt, but for now net profit without one-offs barely covers interest expenses.
Capex rose 40%, but operating cash flow still covers it
Capex for H1 rose 40% to RUB 75.9 bn – 18.3% of revenue, above MTS's usual level. Main investments are in 5G preparation and fintech development.
Operating cash flow for the last 12 months was RUB 274.4 bn, comfortably covering capex. However, OCF for Q2 2026 is not disclosed, and Q1 was negative at minus RUB 31.2 bn (per cash flow statement).
Free cash flow ex-bank was negative in Q1 at minus RUB 7.0 bn. This means after capex and interest, no cash is left for dividends, and the company funds payouts with debt.
Dividend of RUB 35 per share yields 19.3%, but the payout exceeds free cash flow
The board recommended a dividend of RUB 35 per share for FY2025, total payout RUB 69.9 bn. At the current price, this yields 19.3% – one of the highest on the market.
However, free cash flow ex-bank for the last 12 months was only RUB 10.1 bn (per 2025 data), and for H1 2026 it is likely negative. The dividend payout is 7 times free cash flow.
The company pays dividends with debt, increasing leverage. Our model forecasts the same RUB 35 per share next year, but if free cash flow does not recover, the payout may be cut.
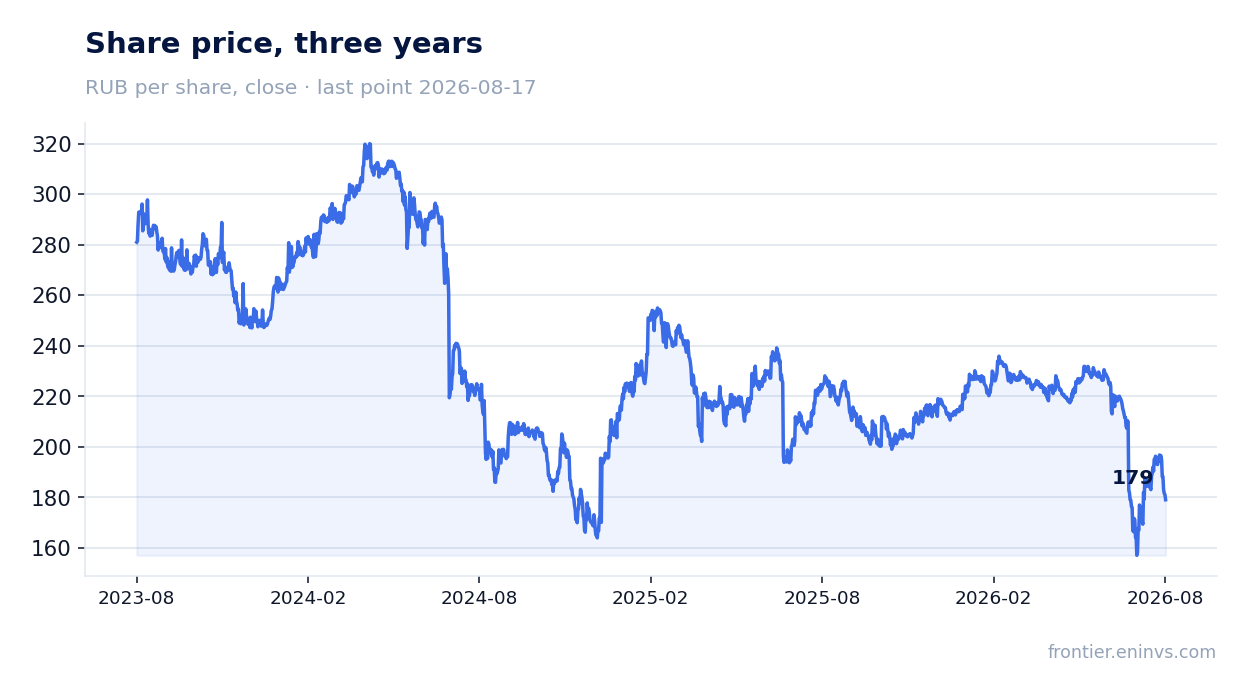
Valuation below history: EV/EBITDA 3.3 vs 4.1 three-year average
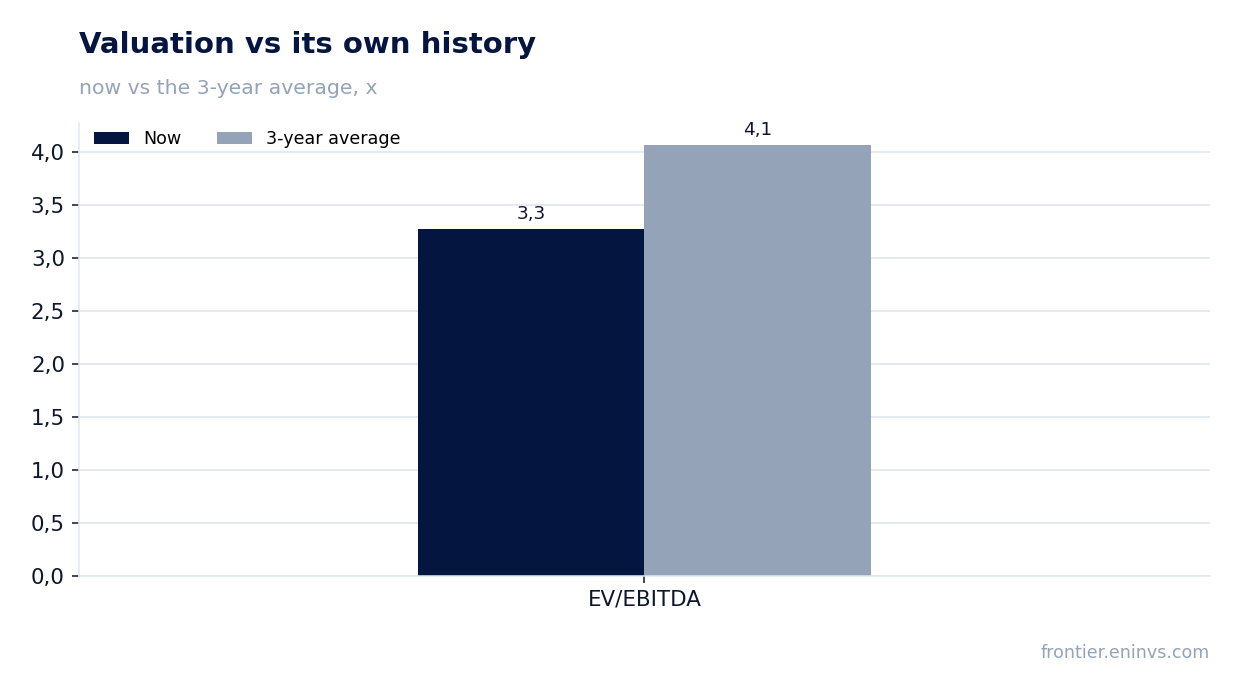
Current EV/EBITDA is 3.27 – well below the three-year average of 4.07. P/E based on last-12-month profit is 3.27, also below historical levels.
The low valuation reflects risks: high debt, dividend uncertainty, and reliance on one-off income. But if the company continues to grow OIBDA and reduce debt, there is re-rating potential.
For comparison: dividend yield of 19.3% versus our fair yield of 12% – the market prices in either a payout cut or a price decline. While the company pays, the stock looks attractive, but the sustainability of the payout is questionable.
Valuation on the latest reported figures
| Metric | Value |
|---|---|
| Market cap | 339 bn ₽ |
| P/E (LTM) | 3.3 |
| EV/EBITDA (LTM) | 3.3 |
| P/B | 20.02 |
| Net debt / EBITDA (LTM) | 2.14 |
| Operating cash flow (LTM) | 274 bn |
| ROE | 132.8% |
| Dividend yield (12m) | 15.4% |
| EV/EBITDA, 3-year average | 4.1 |
Bottom line
The strong side of the report is operational: OIBDA grows faster than revenue, margin expands, and telecom and fintech show double-digit growth. But net profit of RUB 74 bn is almost entirely due to a one-off asset sale, and without it profit would be at last year's level. The key question for shareholders is where the money for dividends will come from: free cash flow is negative, debt is rising, and the RUB 69.9 bn payout is funded with borrowings. As long as the company pays RUB 35 per share, the 19.3% yield looks attractive, but the sustainability of this payout is highly questionable. The next report will show whether operating cash flow has recovered and debt has started to decline.
Open the company's financial profile MTSS →
See also: market overview · valuation map · stock screeners