MTS in Q2 2026: profit jumped 19-fold, but working capital absorbed the entire quarterly cash flow

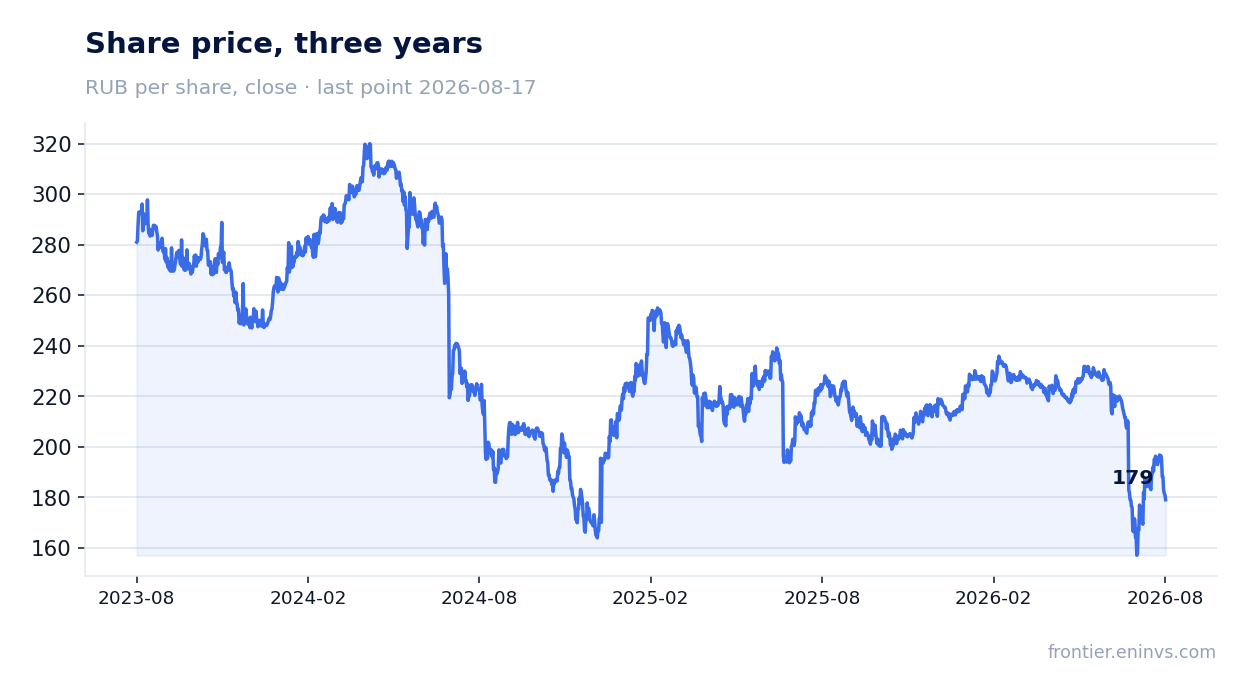
On 25 August MTS reported results for Q2 2026. Revenue grew 9.2% year-on-year to RUB 213.5 bn, EBITDA rose 16.3% to RUB 84.6 bn, and net profit surged 1817.4% to RUB 66.9 bn, largely on a low base effect from the prior year. Operating cash flow turned negative at RUB -32.8 bn amid working capital growth. At the current price the share looks attractive: a 20.2% dividend yield and an EV/EBITDA of 3.46x below its own three-year average, though decelerating revenue growth and negative cash flow warrant monitoring.
Key takeaways
— Net profit jumped 19-fold to RUB 66.9 bn — a low base effect from last year's weak quarter
— EBITDA rose 16.3% with margin up to 39.6% — margin expansion despite revenue deceleration
— Operating cash flow turned negative at RUB -32.8 bn — working capital absorbed the entire quarterly flow
— Debt load at 2.23x EBITDA LTM — a level without dynamics, but comfortable for a telecom
— Dividend of RUB 35 per share for 2025 yields 20.2% — double the key rate
— EV/EBITDA at 3.46x versus a three-year average of 4.02x — a discount to its own history
— Revenue grows 9.2% versus 14.4% a year earlier — deceleration that needs explaining
Attractiveness
Key figures, RUB bn
| Metric | Q2 2025 | Q2 2026 | Change |
|---|---|---|---|
| Revenue | 195 | 213 | +9.2% |
| EBITDA | 72.7 | 84.6 | +16.3% |
| Operating profit | 39.4 | 48.2 | +22.4% |
| Net profit | 3.49 | 66.9 | +1817.4% |
| Operating cash flow | 79.4 | -32.8 | -141.3% |
| Capex | 11.8 | 31.6 | +168.5% |
| EBITDA margin | 37.2% | 39.6% | +2.4 pp |
| Net margin | 1.8% | 31.3% | +29.5 pp |
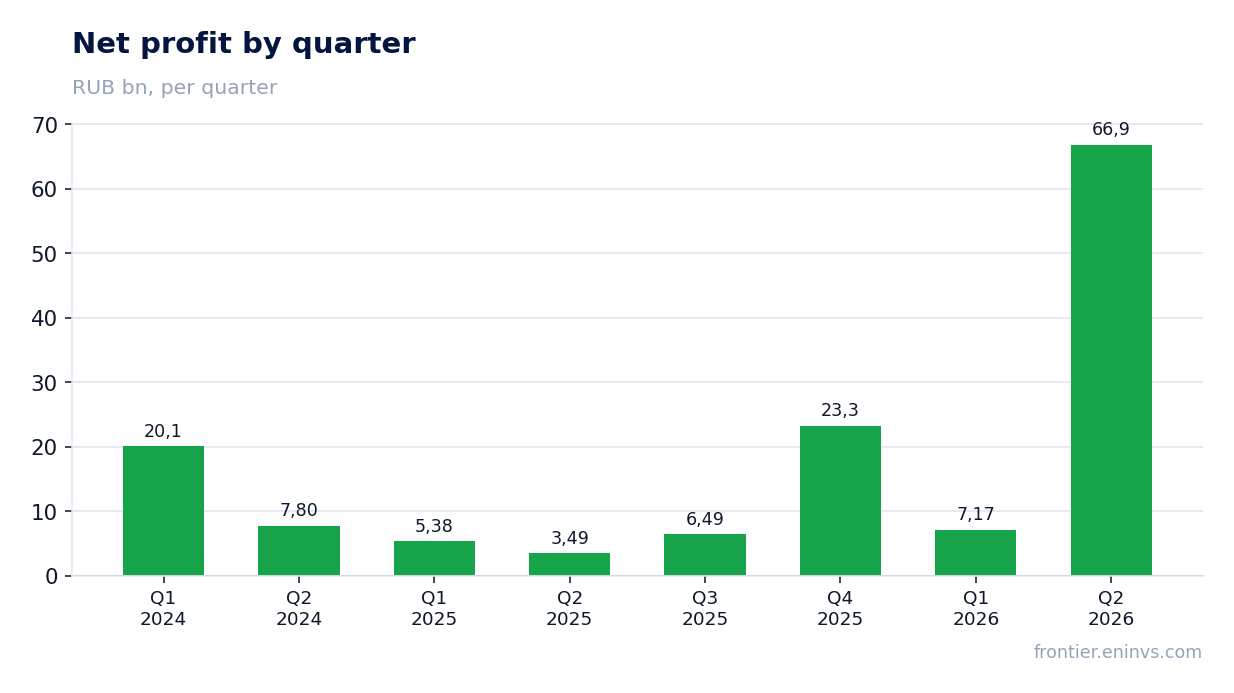
Net profit jumped 19-fold to RUB 66.9 bn — a low base effect from last year's weak quarter
In Q2 2026 MTS net profit reached RUB 66.9 bn versus RUB 3.5 bn a year earlier. The 19-fold jump is explained not so much by current successes as by the low base: in Q2 2025 profit was almost zero at RUB 3.5 bn on revenue of RUB 195.4 bn. Back then the result was pressured by high interest costs and likely one-off write-offs.
Net margin rose to 31.3% from 1.8% a year earlier. Such a jump is a direct consequence of the low base, not a sustainable improvement in operating efficiency. For comparison: in Q1 2026 profit was RUB 7.2 bn, so Q2 was indeed strong, but not enough to call it a new norm.
Two factors drove profit dynamics: EBITDA growth of 16.3% and a reduction in the effective tax rate or interest expenses. Without detail on these items in the report, assessing the sustainability of this profit level is difficult. The next quarter will show whether this was a one-off normalisation or a new trend.
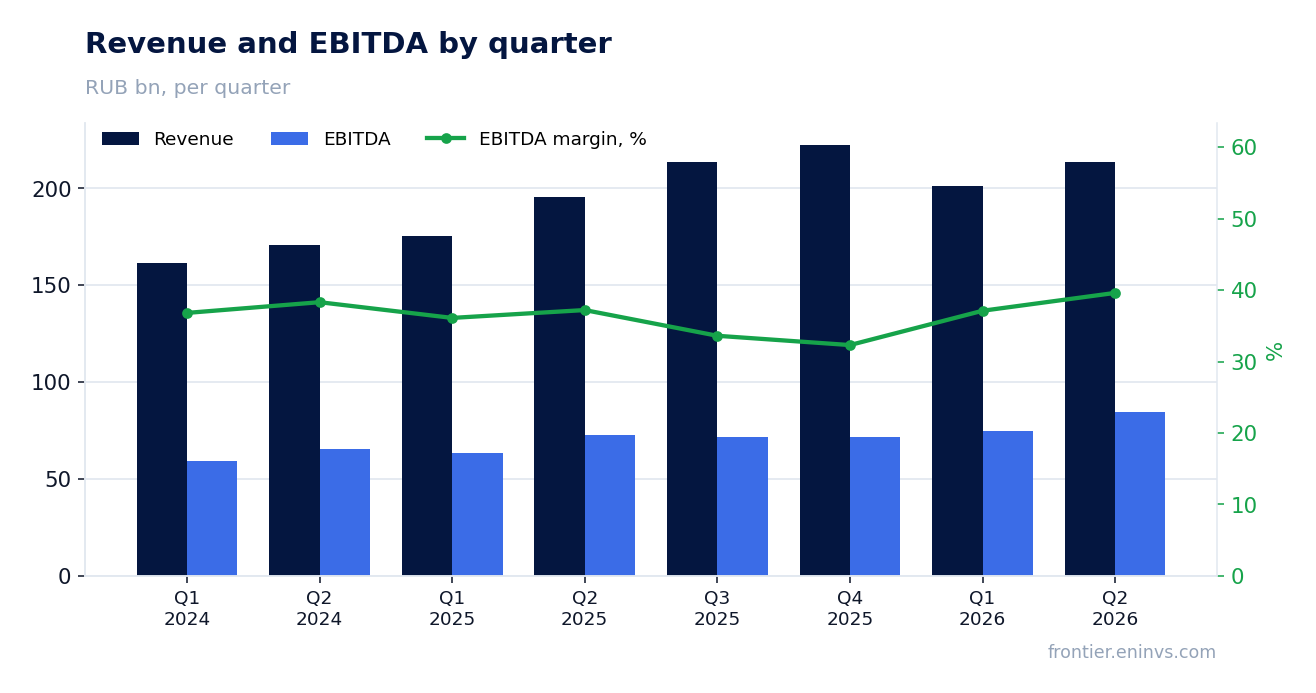
EBITDA rose 16.3% with margin up to 39.6% — margin expansion despite revenue deceleration
EBITDA in Q2 2026 grew 16.3% year-on-year to RUB 84.6 bn, with margin rising to 39.6% from 37.2% a year earlier. Margin growth of 2.4 percentage points amid revenue deceleration means the company is controlling costs better. Revenue added 9.2% versus 14.4% in Q2 2025 — that is a deceleration, but EBITDA is growing faster than revenue.
EBITDA outpacing revenue points to operating leverage: costs are growing slower than income. In Q1 2026 EBITDA was RUB 74.7 bn with a 37.1% margin, so Q2 saw a notable leap. This may be due to seasonality or one-off factors, but the report does not detail specific reasons.
Operating profit rose to RUB 48.2 bn from RUB 39.4 bn a year earlier. Growth of 22.4% also outpaces revenue dynamics. If this trend persists, it will strengthen the company's ability to generate cash flow and service debt.
Operating cash flow turned negative at RUB -32.8 bn — working capital absorbed the entire quarterly flow
Operating cash flow in Q2 2026 was negative RUB 32.8 bn versus positive RUB 79.4 bn a year earlier. This is a sharp deterioration that requires explanation. Meanwhile capital expenditures rose to RUB 31.6 bn from RUB 11.8 bn a year earlier — nearly a threefold increase.
Negative operating flow with positive profit means a significant portion of revenue did not convert into cash this quarter. The reason is working capital growth: possibly an increase in receivables or inventory accumulation. The report does not disclose details, but the scale of the movement — over RUB 110 bn year-on-year — indicates a substantial change in the settlement cycle.
Capex of RUB 31.6 bn represents 14.8% of revenue. For a telecom this is a moderate level, but combined with negative operating flow it means the quarter ended with negative free cash flow. This is a key risk for the dividend story if the situation does not normalise next quarter.
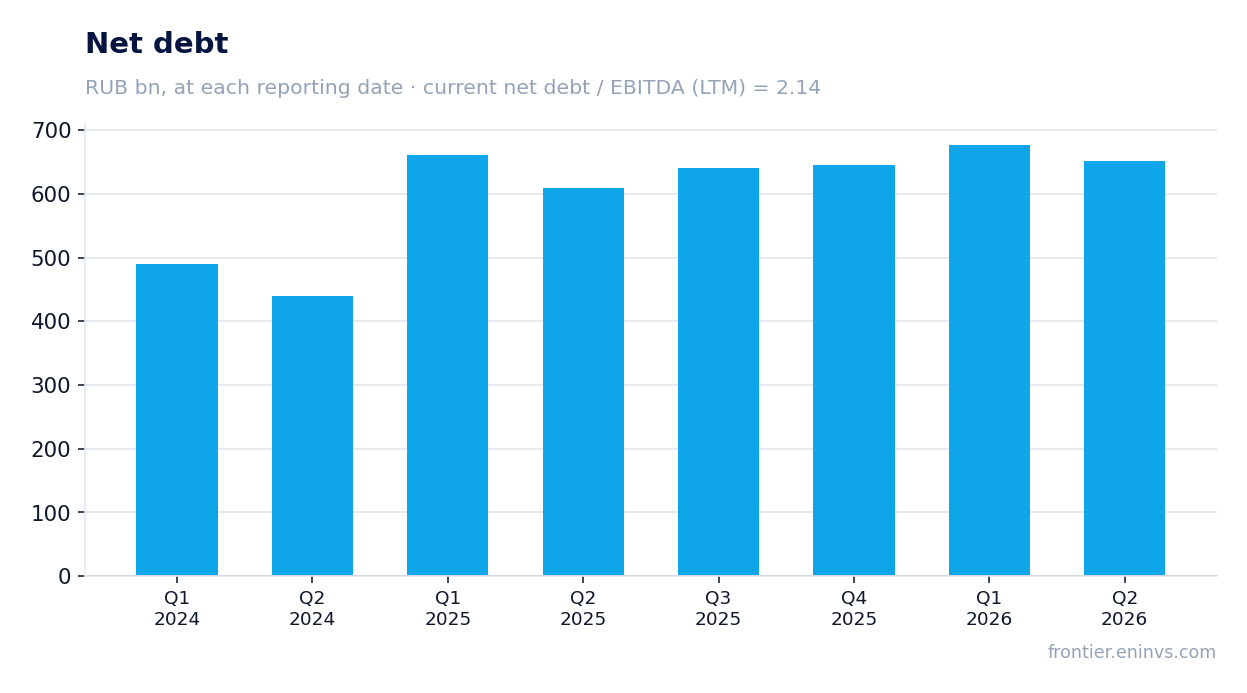
Debt load at 2.23x EBITDA LTM — a level without dynamics, but comfortable for a telecom
Net debt as of 30 June 2026 was RUB 640.9 bn versus RUB 666.9 bn on 31 December 2025 — a decrease of RUB 26.0 bn. Over the year debt fell by RUB 30.6 bn: from RUB 671.4 bn on 30 June 2025. The net debt to EBITDA LTM ratio is 2.23x. This is a moderate level for a telecommunications company.
The RUB 26.0 bn debt reduction over six months amid negative operating cash flow in Q2 looks contradictory. The company likely raised debt in Q1 and repaid it in Q2, or used cash balances. The report does not detail debt movement.
Interest expenses are not disclosed in the provided data, but with a key rate of 14.0% debt servicing remains expensive. Reducing debt by even RUB 26.0 bn saves about RUB 3.6 bn annually in interest — a positive factor for future profit.
Dividend of RUB 35 per share for 2025 yields 20.2% — double the key rate
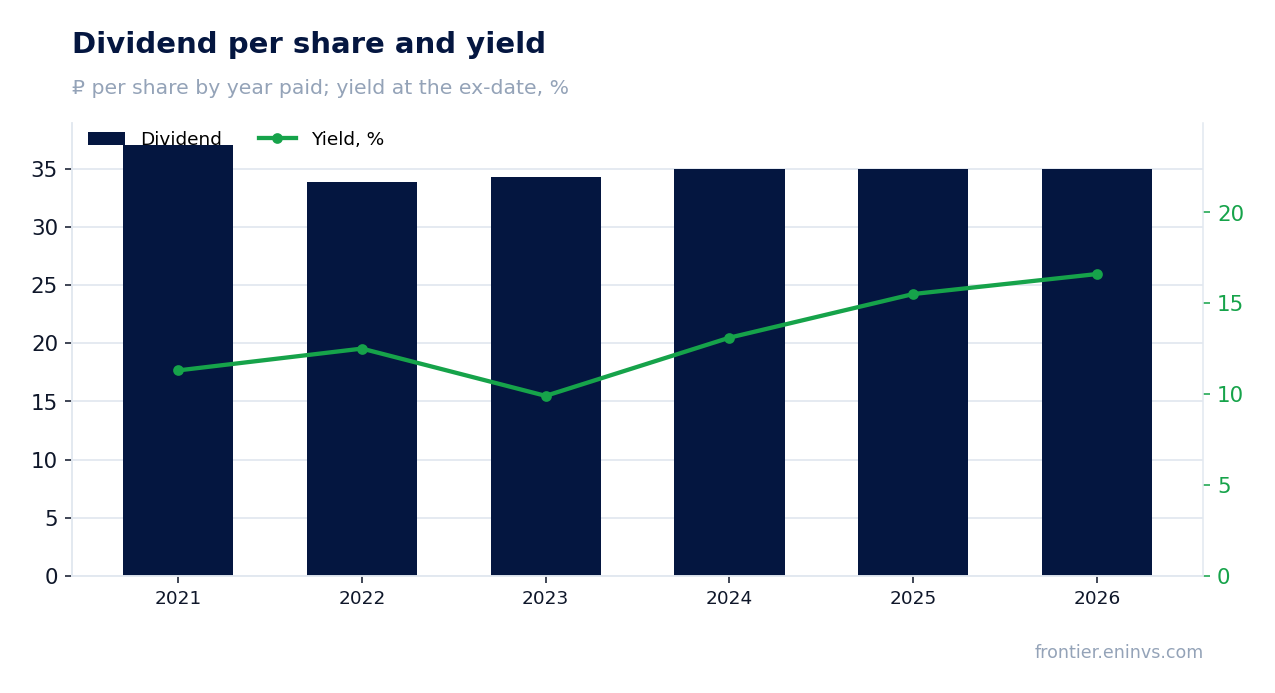
Over the last 12 months MTS paid RUB 35.0 per share, which at the current price yields 20.2%. That is more than double the key rate of 14.0%. In our estimate, the next dividend for the current financial year will be RUB 20.46 per share — this is our estimate, not a board decision. It is based on trailing twelve-month profit and a payout ratio of about 1.0.
The 20.2% yield significantly exceeds the 11.8% level we consider fair for this name. The payout history shows stability: RUB 37.06 in 2021, RUB 33.85 in 2022, RUB 34.29 in 2023, and RUB 35.0 in 2024–2026. The company has not cut the dividend in ruble terms despite profit volatility.
Our estimate of the next dividend at RUB 20.46 implies an 11.8% yield on the current price. That is below the current 20.2% yield but still close to the fair level. The risk of a lower payout is linked to negative operating cash flow in Q2: if it does not recover, the company will have to fund dividends from debt or cut the payout.
EV/EBITDA at 3.46x versus a three-year average of 4.02x — a discount to its own history
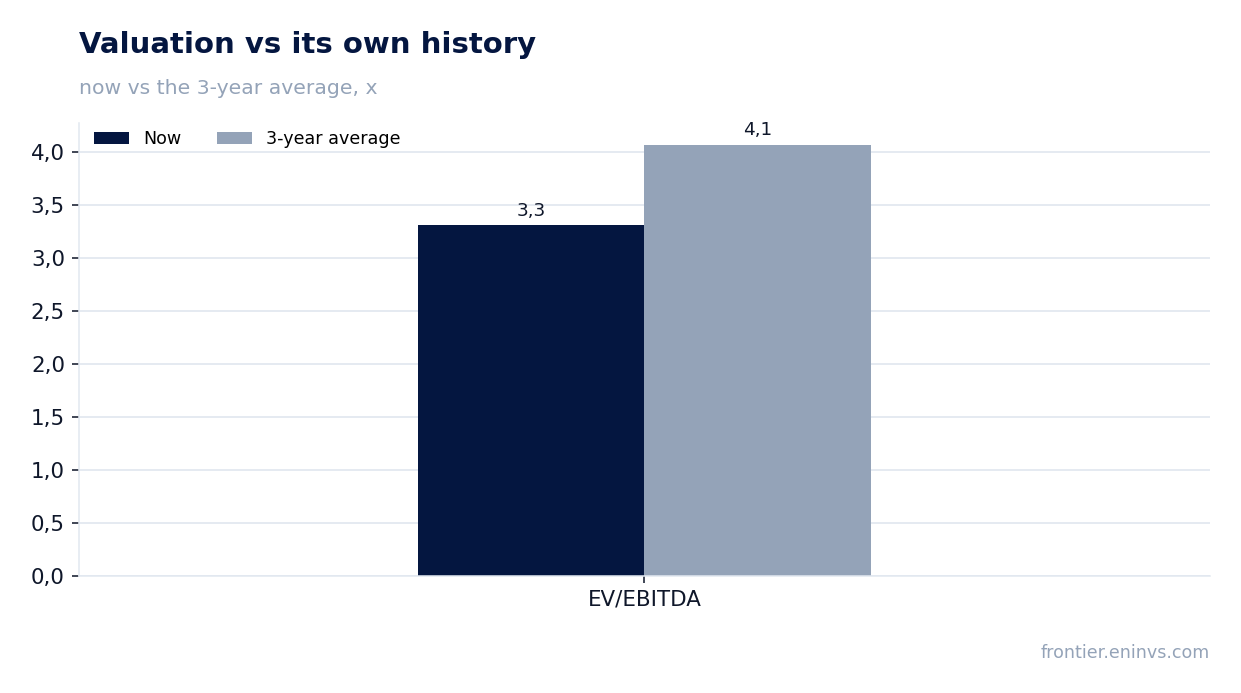
EV/EBITDA LTM is 3.46x versus a three-year average of 4.02x. The stock trades 14% below its historical valuation. P/E LTM is 8.44x. According to the portal's model, upside to fair value is +87%. This is our own model, not a market consensus.
The discount to its own history may reflect market concerns about revenue deceleration and negative cash flow. However, with an EBITDA margin of 39.6% and quarterly profit of RUB 66.9 bn, the current valuation looks undervalued. If the company restores cash flow, the multiple could return to its average level.
For comparison: EV/EBITDA of 3.46x means the entire business is valued at 3.46 annual EBITDA. With current debt of RUB 640.9 bn and market capitalisation of RUB 326.0 bn, this implies a high return on invested capital if operating efficiency persists.
Revenue grows 9.2% versus 14.4% a year earlier — deceleration that needs explaining
Revenue in Q2 2026 was RUB 213.5 bn, up 9.2% year-on-year. In Q2 2025 growth was 14.4%. This is a deceleration of 5.2 percentage points. In Q1 2026 revenue grew 14.7% to RUB 201.3 bn, so the deceleration occurred specifically in Q2.
The reasons for the deceleration are not detailed in the report. It may be due to a base effect: Q2 2025 saw particularly high growth. Or saturation in key segments. Without a segment breakdown for Q2 2026, it is impossible to say precisely.
Nevertheless, revenue of RUB 213.5 bn is a historical maximum for the company. Even with decelerating growth, the absolute level of income continues to rise. The question is whether the deceleration will persist in coming quarters or is a one-off effect.
Valuation on the latest reported figures
| Metric | Value |
|---|---|
| Market cap | 326 bn ₽ |
| P/E (LTM) | 8.4 |
| EV/EBITDA (LTM) | 3.5 |
| P/B | 19.22 |
| Net debt / EBITDA (LTM) | 2.23 |
| ROE | -199.1% |
| Dividend yield (12m) | 20.2% |
| EV/EBITDA, 3-year average | 4.0 |
Dividend per share, ₽, and yield at the ex-date
| Year paid | Dividend | Yield |
|---|---|---|
| 2021 | 37.06 | 11.3% |
| 2022 | 33.85 | 12.5% |
| 2023 | 34.29 | 9.9% |
| 2024 | 35.00 | 13.1% |
| 2025 | 35.00 | 15.5% |
| 2026 | 35.00 | 16.6% |
| Our estimate, current year | 20.46 | 11.8% on the current price |
Bottom line
The report's strengths are EBITDA growth of 16.3% with a 39.6% margin and net profit of RUB 66.9 bn. However, profit grew 19-fold mainly due to last year's low base, while operating cash flow turned negative at RUB -32.8 bn. A dividend yield of 20.2% and EV/EBITDA of 3.46x versus a three-year average of 4.02x make the stock attractive for income-oriented holders. The key question is whether cash flow recovers next quarter, otherwise the dividend story will come under pressure.
Open the company's financial profile MTSS →
See also: market overview · valuation map · stock screeners