Nizhnekamsknef-m: profit plunges 93.8%, but net debt down RUB 89.9 bn in H1
25 августа «Нижнекамскнеф-м» раскрыл результаты за первое полугодие 2026 года. Выручка снизилась на 6,1% до 128,4 млрд руб., EBITDA упала на 48,6% до 29,8 млрд руб., а чистая прибыль обвалилась на 93,8% до 1,6 млрд руб. В обзоре разбираем, что привело к такому падению, как изменился долг и что это значит для акционеров.
Key takeaways
— Net profit for the half-year fell 16-fold to RUB 1.6 bn on higher finance costs and asset impairment
— EBITDA nearly halved to RUB 29.8 bn, margin down from 23.7% to 12.9%
— Revenue fell 6.1% to RUB 128.4 bn, with elastomer sales down 26.7%
— Net debt fell RUB 89.9 bn in the half-year to RUB 176.6 bn
— Capex for the half-year was RUB 32.3 bn, almost equal to operating cash flow before tax
— Dividends over 12 months: RUB 0.83 per share, yield 1.9% – far from our fair yield
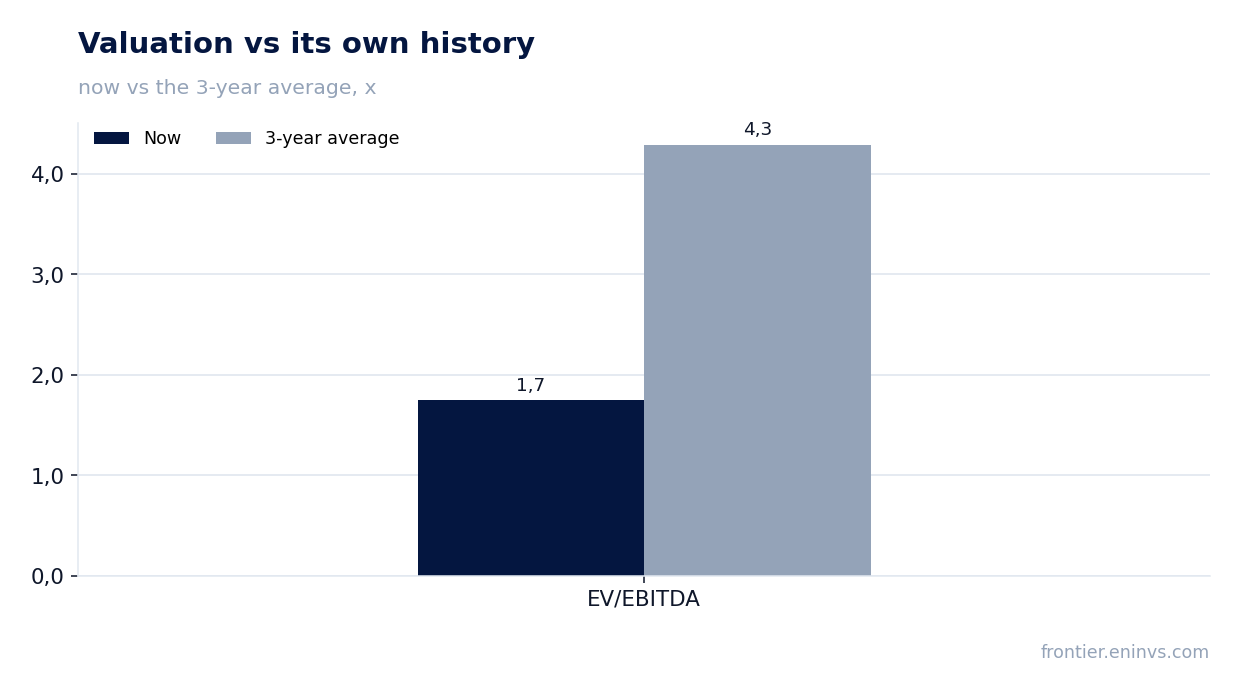
— Shares trade at a discount to their own history: EV/EBITDA 1.75 vs 4.29 three-year average
Key figures, RUB bn
| Metric | H1 2025 | H1 2026 | Change |
|---|---|---|---|
| Revenue | 137 | 128 | -6.1% |
| EBITDA | 32.4 | 16.6 | -48.6% |
| Operating profit | 19.7 | 3.93 | -80.0% |
| Net profit | 26.5 | 1.64 | -93.8% |
| Operating cash flow | 52.8 | 38.1 | -28.0% |
| Capex | 49.2 | 32.8 | -33.3% |
| EBITDA margin | 23.7% | 12.9% | -10.8 pp |
| Net margin | 19.4% | 1.3% | -18.1 pp |
Net profit for the half-year fell 16-fold to RUB 1.6 bn on higher finance costs and asset impairment
For H1 2026, Nizhnekamsknef-m's net profit was RUB 1.6 bn versus RUB 26.5 bn a year earlier. The 93.8% drop is explained by several factors: finance costs rose from RUB 0.4 bn to RUB 7.1 bn, and impairment of non-current assets was RUB 2.5 bn versus RUB 0.3 bn last year.
Foreign exchange gains, which contributed RUB 15.4 bn in H1 2025, shrank to RUB 4.2 bn this year. As a result, profit before tax fell from RUB 35.7 bn to RUB 2.3 bn, and income tax was just RUB 0.1 bn versus RUB 1.7 bn a year earlier.
EBITDA nearly halved to RUB 29.8 bn, margin down from 23.7% to 12.9%
EBITDA for H1 2026 was RUB 29.8 bn, down 48.6% year-on-year. EBITDA margin fell from 23.7% to 12.9%. The main driver was operating costs: raw materials fell 19.1% to RUB 48.5 bn, but depreciation and amortisation doubled to RUB 23.4 bn, and asset impairment added RUB 2.5 bn.
In dollar terms, the decline is less pronounced: USD 391 mn versus USD 363 mn a year earlier, reflecting a weaker rouble. Still, margins remain under pressure from higher depreciation and impairment.
Revenue fell 6.1% to RUB 128.4 bn, with elastomer sales down 26.7%
Revenue for H1 2026 was RUB 128.4 bn, down 6.1% year-on-year. The main decline came from elastomers – RUB 30.0 bn versus RUB 40.9 bn, i.e. minus 26.7%. Plastics and organic synthesis products fell 16.3% to RUB 28.8 bn.
At the same time, semi-finished products and other petrochemicals rose 36.2% to RUB 29.3 bn, and MTBE and fuel components grew 14.9% to RUB 8.6 bn. Construction services revenue fell 33.7% to RUB 5.9 bn, due to completion of one contract with a related party.
Net debt fell RUB 89.9 bn in the half-year to RUB 176.6 bn
As of June 30, 2026, Nizhnekamsknef-m's net debt was RUB 176.6 bn, down RUB 89.9 bn from end-2025. Over the last 12 months, the reduction was RUB 179.8 bn. Net debt to EBITDA for the last 12 months stands at 1.24.
The reduction came amid loan repayments of RUB 39.0 bn in the half-year and new borrowings of RUB 29.3 bn. Cash on the balance sheet fell from RUB 22.7 bn to RUB 10.6 bn, but that did not prevent the debt reduction.
Capex for the half-year was RUB 32.3 bn, almost equal to operating cash flow before tax
Capital expenditures on fixed assets for H1 2026 were RUB 32.3 bn, only slightly below operating cash flow before income tax of RUB 38.2 bn. After tax paid (RUB 0.2 bn), free cash flow before financing was about RUB 5.8 bn.
Total construction and acquisition of fixed assets, including advances, was RUB 41.4 bn versus RUB 49.0 bn a year earlier. Capitalised borrowing costs fell from RUB 13.0 bn to RUB 7.3 bn, reflecting lower debt and rates.
Dividends over 12 months: RUB 0.83 per share, yield 1.9% – far from our fair yield
Over the last 12 months, the company paid RUB 0.83 per share, implying a yield of 1.9%. Our model estimates the next payout at RUB 0.83 per share, giving a forward yield of 1.9% – well below our fair yield of 10.5%.
The payout ratio is only 0.09 of profit, reflecting a cautious dividend policy amid high debt and capex needs. For comparison, in H1 2025 dividends per share were RUB 2.93.
Shares trade at a discount to their own history: EV/EBITDA 1.75 vs 4.29 three-year average
The current EV/EBITDA multiple on LTM is 1.75 versus a three-year average of 4.29. This means the market values the company significantly cheaper than its own history. P/E LTM is 32.4, reflecting low profitability due to one-off factors.
The discount is explained by weak operating results and uncertainty about margin recovery. However, at this EV/EBITDA level, the market is effectively pricing in no recovery of EBITDA to historical levels.
Valuation on the latest reported figures
| Metric | Value |
|---|---|
| Market cap | 72.7 bn ₽ |
| P/E (LTM) | 32.4 |
| EV/EBITDA (LTM) | 1.7 |
| P/B | 0.22 |
| Net debt / EBITDA (LTM) | 1.24 |
| Operating cash flow (LTM) | 103 bn |
| ROE | 0.9% |
| Dividend yield (12m) | 5.1% |
| EV/EBITDA, 3-year average | 4.3 |
Bottom line
Bottom line: H1 2026 was weak for Nizhnekamsknef-m – EBITDA nearly halved, net profit fell 16-fold. The positive is a significant reduction in net debt by RUB 89.9 bn in the half-year, lowering leverage. However, operating cash flow barely covers capex, and dividends remain minimal. The key question for shareholders is when margins will recover and whether that will allow higher payouts. For now, the market values the company at a discount to its history, reflecting these uncertainties.
Open the company's financial profile NKNC →
See also: market overview · valuation map · stock screeners