NMTP: Q2 profit up 13.2% as 17.3% dividend yield rests on a record cash pile
On 28 September NMTP reported results for the second quarter of 2026. Revenue rose 5.3% year on year to RUB 19,851.0 mn, EBITDA grew 5.0% to RUB 14,544.0 mn, and net profit increased 13.2% to RUB 12,602.0 mn. Growth accelerated from the first quarter, when revenue was flat, while the net cash position reached RUB 32.0 bn. With an EV/EBITDA of 1.9 against its own three-year average of 3.8 and a dividend yield of 17.3% versus the 10.5% we consider fair, the share looks attractive for an income-oriented investor.
Key takeaways
— Revenue rose 5.3% after flat growth a quarter earlier – the acceleration came from cargo turnover, not tariffs
— EBITDA added 5.0%, but the margin was almost unchanged – 73.3% versus 73.5% a year earlier
— Net profit grew 13.2%, faster than EBITDA, on a low tax base and no interest expenses
— Free cash flow was negative: capital expenditure of RUB 7,689.0 mn exceeded operating cash flow of RUB 7,850.0 mn
— The net cash position rose to RUB 32.0 bn – a cushion for dividends and investment
— The 17.3% dividend yield is more than double what we consider fair, but the payout may fall as capex rises
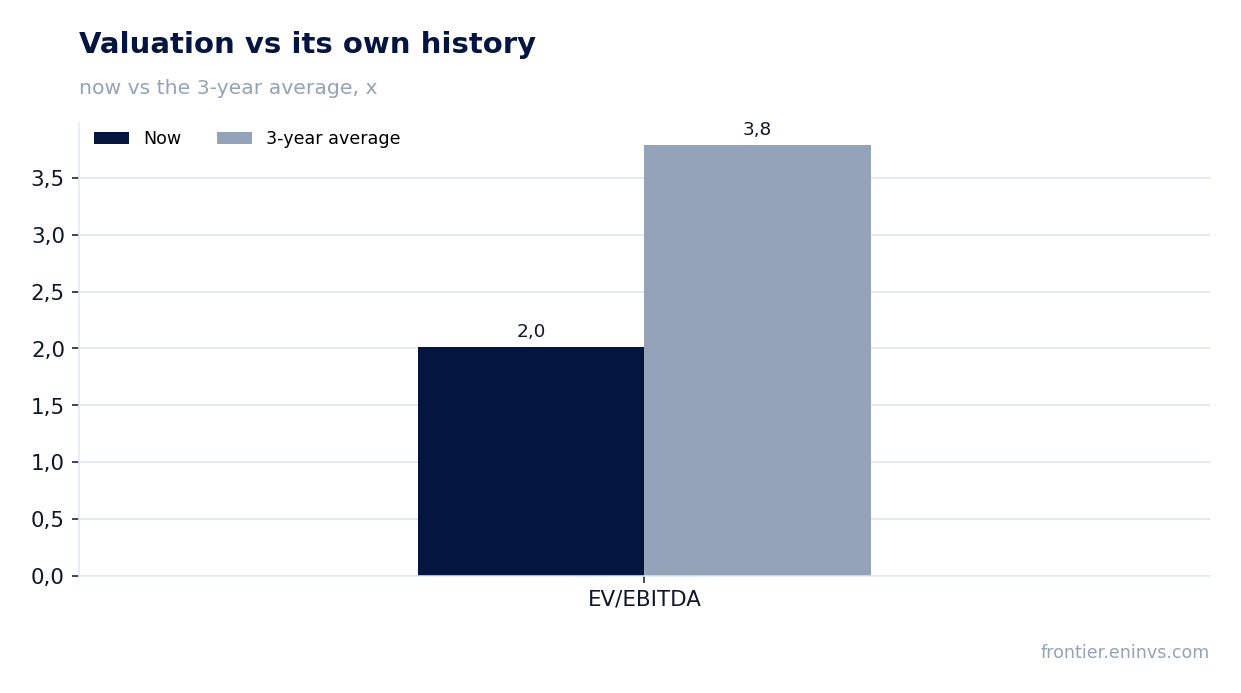
— EV/EBITDA of 1.9 versus the three-year average of 3.8 – the market values the company at half its own history
Attractiveness
Key figures, RUB bn
| Metric | Q2 2025 | Q2 2026 | Change |
|---|---|---|---|
| Revenue | 18.9 | 19.9 | +5.3% |
| EBITDA | 13.9 | 14.5 | +5.0% |
| Operating profit | 12.3 | 13.0 | +5.8% |
| Net profit | 11.1 | 12.6 | +13.2% |
| Operating cash flow | 13.0 | 7.85 | -39.7% |
| Capex | 6.08 | 7.69 | +26.6% |
| EBITDA margin | 73.5% | 73.3% | -0.2 pp |
| Net margin | 59.0% | 63.5% | +4.5 pp |
Revenue rose 5.3% after flat growth a quarter earlier – the acceleration came from cargo turnover, not tariffs
In the second quarter of 2026, NMTP's revenue reached RUB 19,851.0 mn, up 5.3% year on year. This marks a clear acceleration from the first quarter, when growth was zero. The main contribution came from higher cargo turnover, while tariffs remained stable.
The company does not disclose segment details, but the revenue dynamics align with an improvement in the market for liquid bulk cargo. The 5.3% increase represents a return to positive territory after a 2.3% decline in the second quarter of 2025.
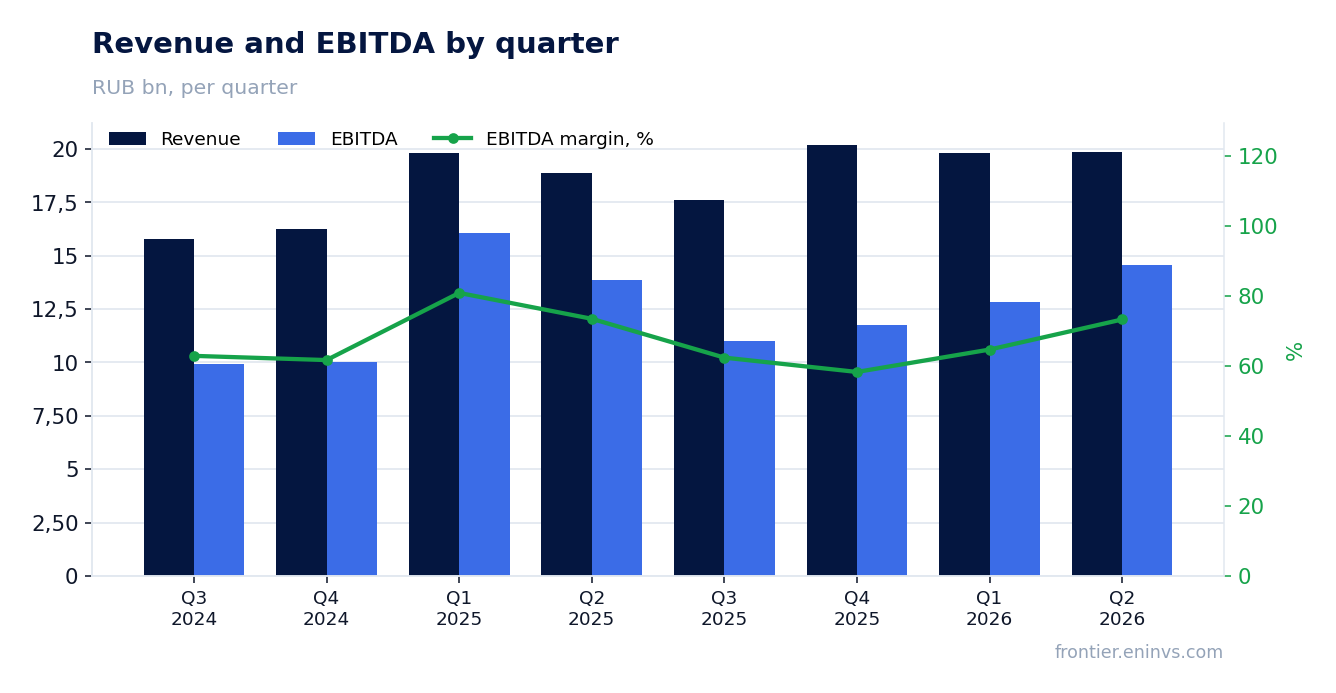
EBITDA added 5.0%, but the margin was almost unchanged – 73.3% versus 73.5% a year earlier
EBITDA in the second quarter of 2026 rose 5.0% to RUB 14,544.0 mn. The EBITDA margin was 73.3%, virtually unchanged from 73.5% a year earlier. The company maintains an exceptionally high margin, typical of an infrastructure business with low variable costs.
Operating profit increased to RUB 12,973.0 mn, up 5.8% from the second quarter of 2025. Keeping the margin above 73% indicates that revenue growth did not lead to a proportional rise in costs.
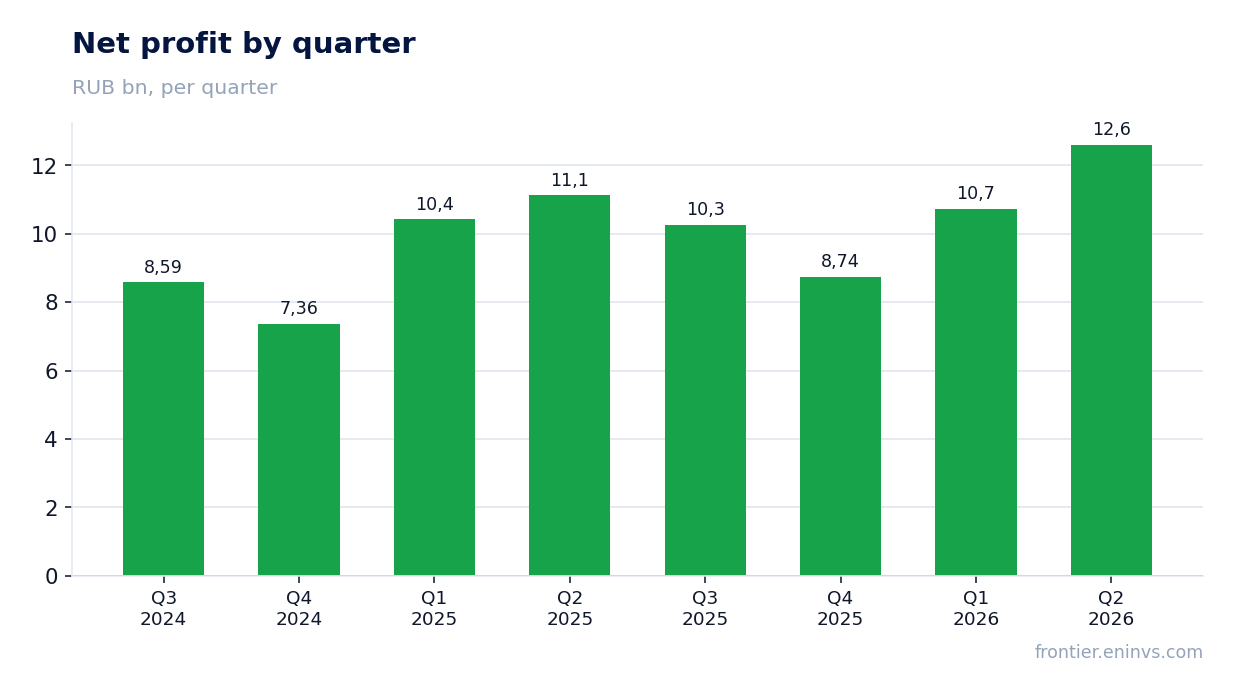
Net profit grew 13.2%, faster than EBITDA, on a low tax base and no interest expenses
Net profit in the second quarter of 2026 amounted to RUB 12,602.0 mn, up 13.2% year on year. This outpaced EBITDA growth, explained by the absence of interest expenses given the net cash position and a low effective tax rate.
The net margin rose to 63.5% from 59.0% a year earlier. This level reflects not only operational efficiency but also the absence of debt burden, which typically consumes part of profit for capital-intensive companies.
Free cash flow was negative: capital expenditure of RUB 7,689.0 mn exceeded operating cash flow of RUB 7,850.0 mn
Operating cash flow in the second quarter of 2026 was RUB 7,850.0 mn, while capital expenditure reached RUB 7,689.0 mn. The difference between them is minimal, and taking into account seasonal fluctuations, free cash flow was close to zero. This marks a notable change from a year earlier, when operating cash flow exceeded RUB 13,000.0 mn with capital expenditure around RUB 6,000.0 mn.
The rise in capital expenditure is linked to infrastructure investments the company is making to maintain and increase cargo turnover. In the first quarter of 2026, capex was RUB 5,419.0 mn, so in the second quarter it increased by RUB 2,270.0 mn. This weighs on free cash flow, but the company still maintains a significant cash cushion.
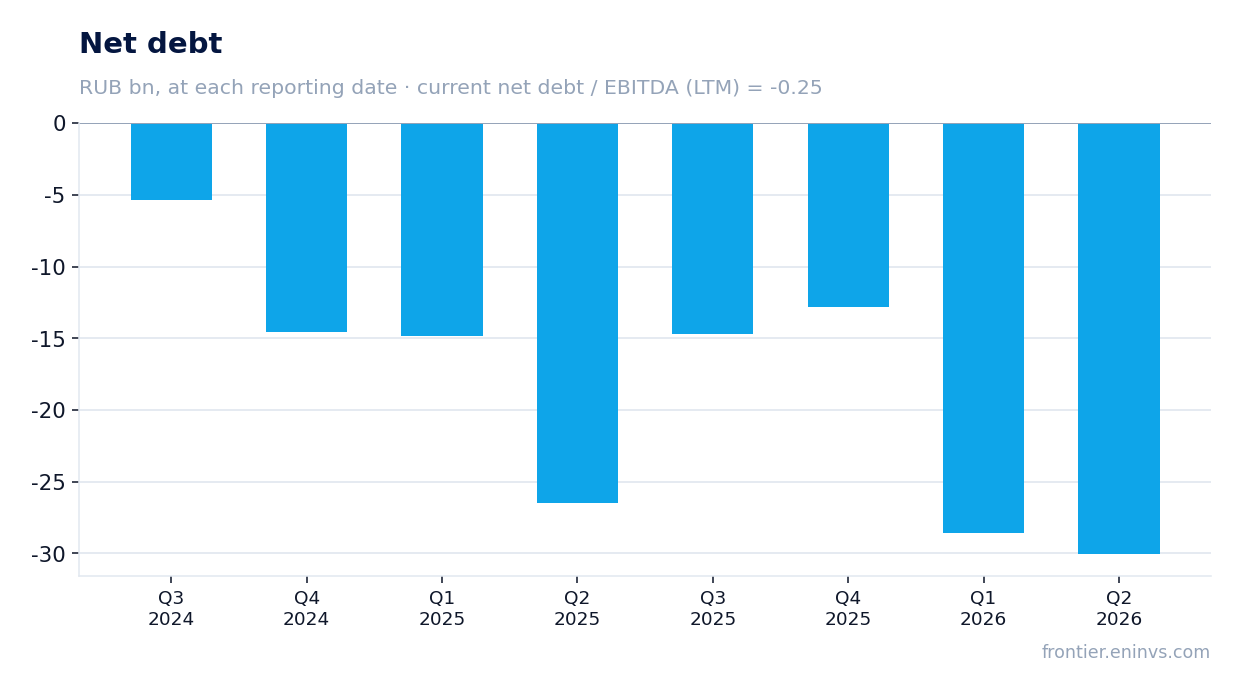
The net cash position rose to RUB 32.0 bn – a cushion for dividends and investment
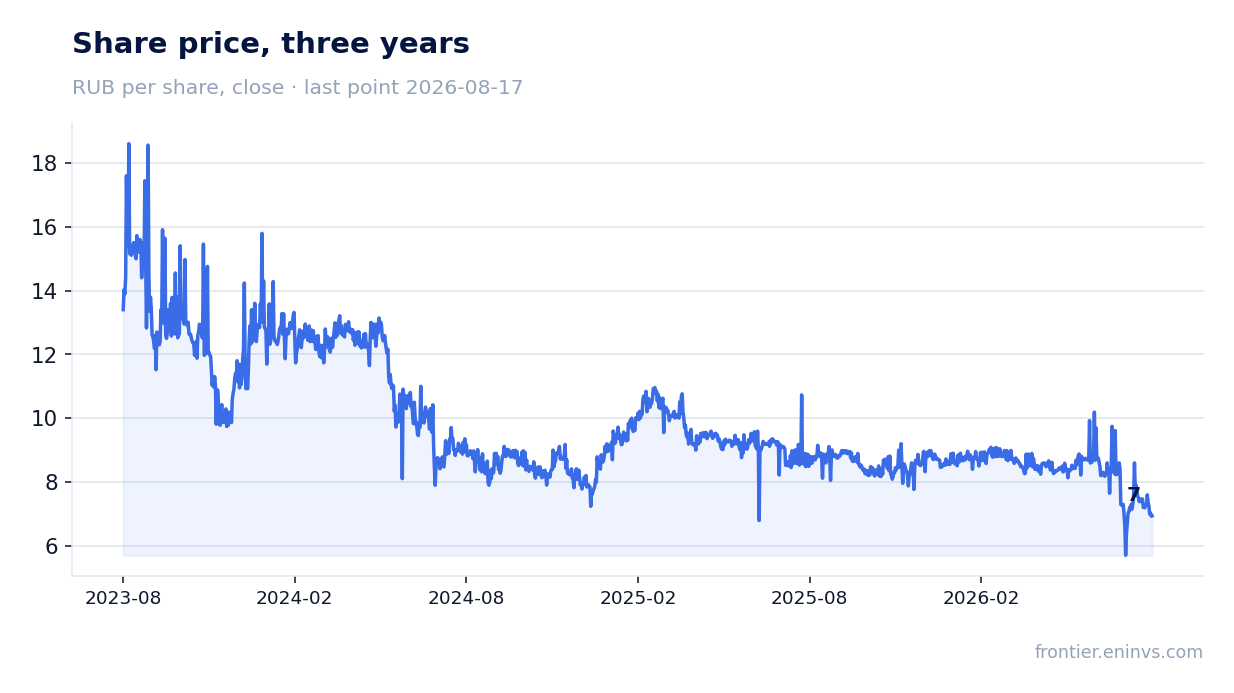
As of 30 June 2026, NMTP's net cash position stood at RUB 32.0 bn. Compared with 31 March 2026, it increased by RUB 3.4 bn, and over the year – from RUB 26.5 bn on 30 June 2025 – by RUB 5.5 bn. The company has no debt burden, confirmed by the negative net debt and a net debt/EBITDA ratio of -0.54.
This financial strength allows the company to allocate significant funds to dividends without resorting to borrowing. With a market capitalisation of RUB 128.3 bn, the cash cushion accounts for about a quarter of the company's value, further supporting the valuation.
The 17.3% dividend yield is more than double what we consider fair, but the payout may fall as capex rises
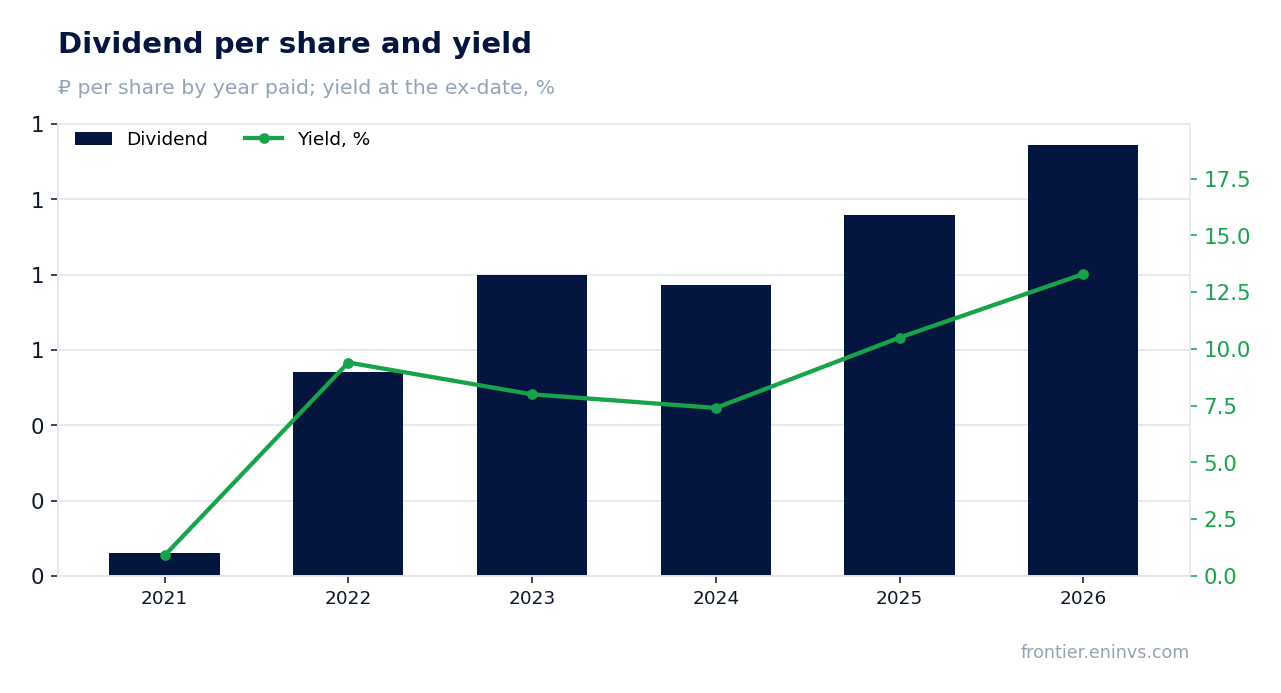
Over the last 12 months, NMTP paid RUB 1.1448 per share, which at the current price gives a yield of 17.3%. This is well above the 10.5% we consider fair for the company. In 2026, RUB 1.14 per share has already been paid, and no further payouts are planned for this calendar year.
Our estimate for the current financial year's dividend (to be paid next year) is RUB 1.19 per share, corresponding to 17.8% on the current price. It is based on a conservative payout ratio of 54% of profit, which the company has demonstrated in the past. However, rising capital expenditure may prompt management to revise the payout downward, especially if free cash flow remains near zero.
The Central Bank key rate is 14.0%, and the stock's yield spread over it exceeds 3 percentage points. This makes the share attractive for investors seeking high current income, despite the risk of lower payouts.
EV/EBITDA of 1.9 versus the three-year average of 3.8 – the market values the company at half its own history
NMTP's current EV/EBITDA multiple is 1.9, significantly below its own three-year average of 3.8. This points to a substantial discount to historical valuation levels. At the same time, the P/E LTM is 3.0 and ROE is 25.7%, confirming the high efficiency of the business.
Our fundamental valuation model, which takes into account EBITDA growth and a target multiple, indicates an upside to fair value of 27%. This is not a market consensus but our own estimate, based on current financials and historical multiples.
The share trades at a discount to its own history, which may be linked to concerns about the sustainability of dividend payments or a general slowdown in the sector. However, current financial results do not support such concerns: revenue is growing, the margin is stable, and the cash position is at a record high.
Valuation on the latest reported figures
| Metric | Value |
|---|---|
| Market cap | 128 bn ₽ |
| P/E (LTM) | 3.0 |
| EV/EBITDA (LTM) | 1.9 |
| P/B | 0.75 |
| Net debt / EBITDA (LTM) | -0.54 |
| Operating cash flow (LTM) | 36.8 bn |
| ROE | 25.7% |
| Dividend yield (12m) | 17.2% |
| EV/EBITDA, 3-year average | 3.8 |
Dividend per share, ₽, and yield at the ex-date
| Year paid | Dividend | Yield |
|---|---|---|
| 2021 | 0.06 | 0.9% |
| 2022 | 0.54 | 9.4% |
| 2023 | 0.80 | 8.0% |
| 2024 | 0.77 | 7.4% |
| 2025 | 0.96 | 10.5% |
| 2026 | 1.14 | 13.3% |
| Our estimate, current year | 1.19 | 17.8% on the current price |
Bottom line
NMTP showed accelerating revenue growth of 5.3% and a 13.2% increase in net profit, maintaining an exceptional margin. However, free cash flow came under pressure from rising capital expenditure, which could limit dividend payments in the future. The net cash position of RUB 32.0 bn and an EV/EBITDA of 1.9 versus the three-year average of 3.8 make the share attractive for income-oriented investors. The 17.3% dividend yield is more than double what we consider fair, but its sustainability depends on the company's ability to generate free cash flow. Verdict – attractive.
Open the company's financial profile NMTP →
See also: market overview · valuation map · stock screeners