NMTP: revenue fell by a third, but cash and dividends hold the stock
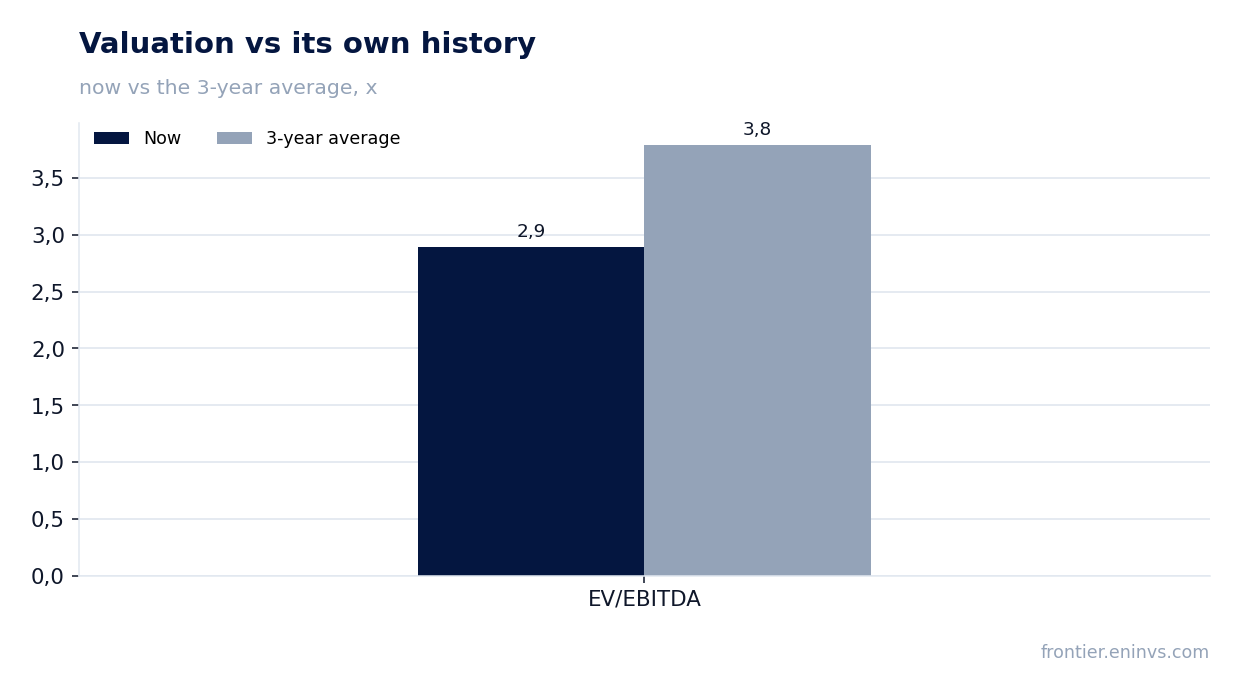
On 25 November NMTP reported results for the third quarter of 2026. Revenue fell 32.3% year on year to RUB 11,944 mn, EBITDA – by 49.0% to RUB 5,613 mn, net profit – by 47.2% to RUB 5,426 mn. The EBITDA margin compressed to 47.0% from 62.4%, but the company remains in a net cash position of RUB 5,379 mn and pays generous dividends. At the current price the stock looks rather attractive: EV/EBITDA of 2.9 is below its own three-year average of 3.8, and the dividend yield of 16.3% is well above the 10.5% we consider fair for the name.
Key takeaways
— Revenue collapsed 32.3% year on year in Q3 after a 5.3% rise in Q2 – the transshipment portfolio failed to hold last year's level
— EBITDA fell twice as fast as revenue – the margin dropped to 47.0% from 62.4%, and each tonne of cargo now brings noticeably less operating profit
— Net profit fell 47.2% but remained above operating profit – items below the operating line supported it in the reported quarter
— The company sits on net cash of RUB 5,379 mn with negative net debt and EV/EBITDA of 2.9 – the market values it below its own three-year average of 3.8
— Dividends remain the main argument: RUB 1.1448 per share paid over the last 12 months with a 16.3% yield, and we estimate RUB 1.05 per share for the current year
— Operating cash flow for the quarter was RUB 2,592 mn – it covers capital expenditure but leaves no cushion for higher payouts
— On our fair-value model the stock trades 23% above its estimated fair value – upside is exhausted, and it is worth holding for dividends, not for re-rating
Attractiveness
Key figures, RUB bn
| Metric | Q3 2025 | Q3 2026 | Change |
|---|---|---|---|
| Revenue | 17.6 | 11.9 | -32.3% |
| EBITDA | 11.0 | 5.61 | -49.0% |
| Operating profit | 9.39 | 4.00 | -57.4% |
| Net profit | 10.3 | 5.43 | -47.2% |
| Operating cash flow | 7.43 | 2.59 | -65.1% |
| Capex | 5.21 | — | — |
| EBITDA margin | 62.4% | 47.0% | -15.4 pp |
| Net margin | 58.2% | 45.4% | -12.8 pp |
Revenue collapsed 32.3% year on year in Q3 after a 5.3% rise in Q2 – the transshipment portfolio failed to hold last year's level
In the third quarter of 2026 NMTP's revenue amounted to RUB 11,944 mn, 32.3% below the same quarter a year earlier. This is a sharp deceleration after 5.3% growth in the second quarter: the top-line dynamic reversed from a slight plus to a deep minus.
A revenue decline of this magnitude means that cargo turnover and tariffs did not offset the lost volumes. The company did not disclose a line-by-line breakdown in the facts, so it is impossible to name the segment that fell most. One thing is clear: the quarter was a failure compared with last year's level, when revenue was RUB 17,632 mn.
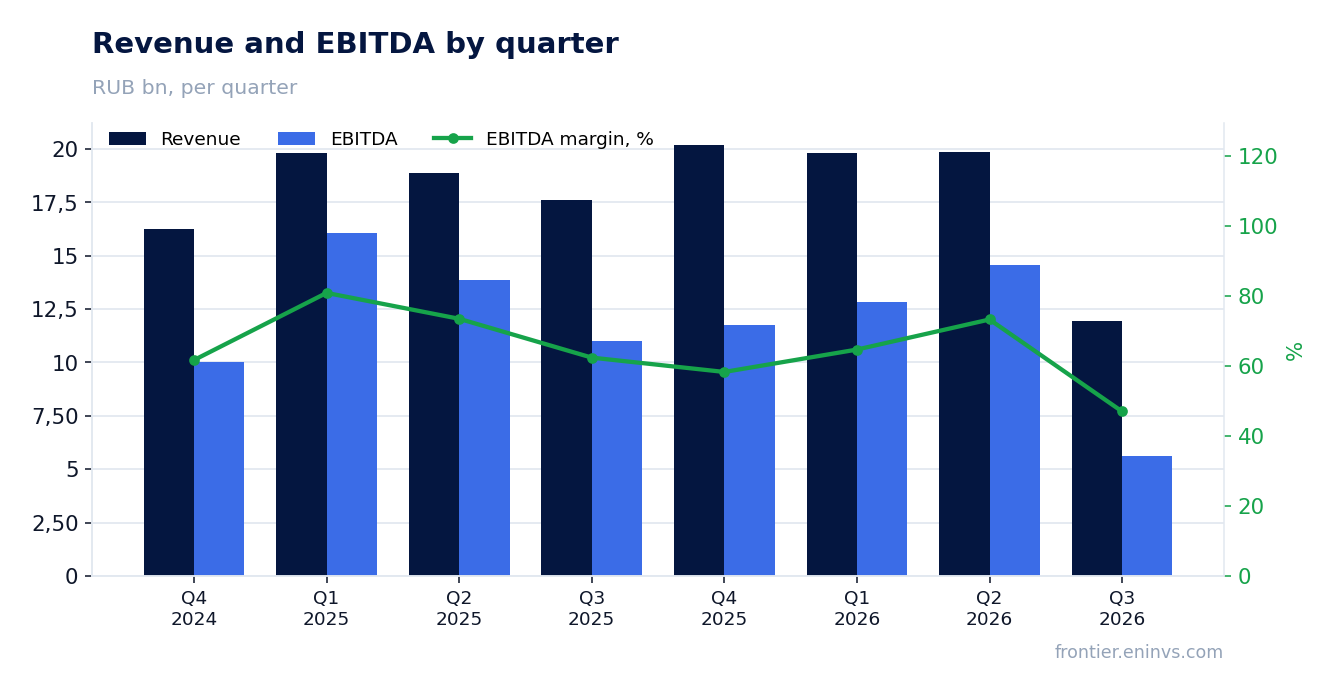
EBITDA fell twice as fast as revenue – the margin dropped to 47.0% from 62.4%, and each tonne of cargo now brings noticeably less operating profit
EBITDA in the third quarter was RUB 5,613 mn, down 49.0% year on year – faster than revenue, which fell 32.3%. Operating profit declined to RUB 4,002 mn, and that fall was deeper than the top line's.
The EBITDA margin compressed to 47.0% from 62.4% a year earlier, the net margin – to 45.4% from 58.2%. This gap suggests that fixed costs did not adjust quickly enough to the smaller transshipment volume. Each rouble of revenue now brings almost half as much operating profit as a year ago.
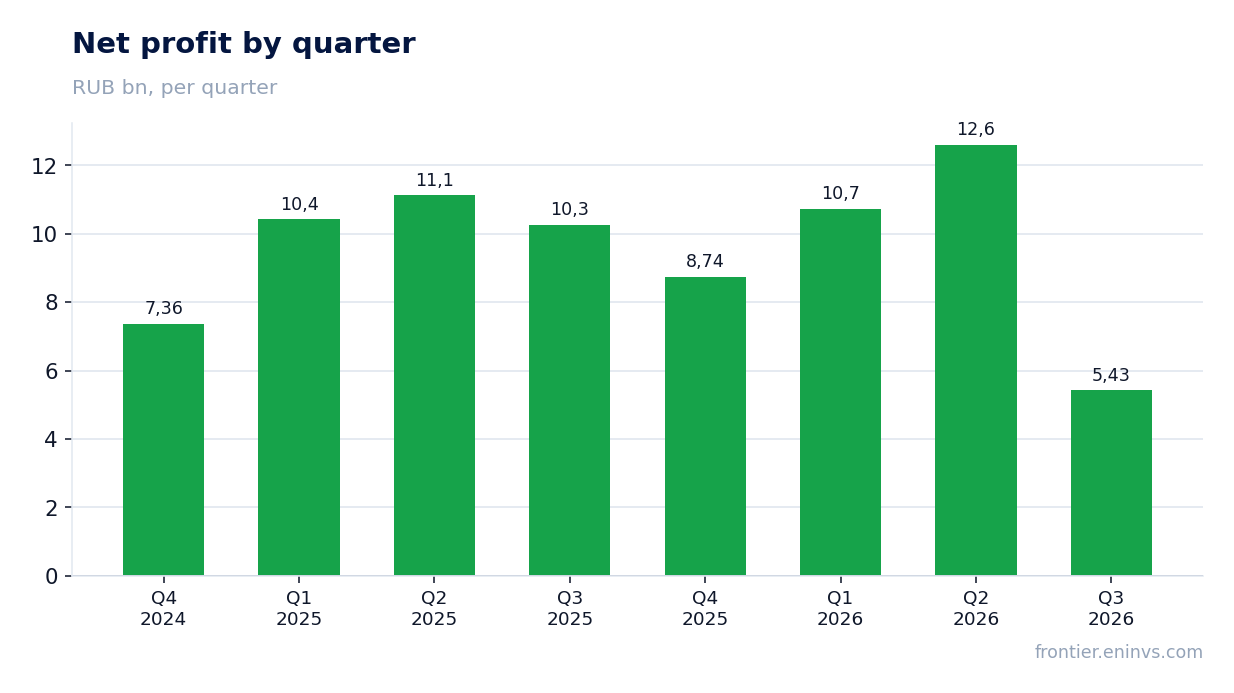
Net profit fell 47.2% but remained above operating profit – items below the operating line supported it in the reported quarter
Net profit for the third quarter was RUB 5,426 mn against RUB 10,268 mn a year earlier, a decline of 47.2%. At the same time profit exceeded operating profit, which was RUB 4,002 mn. The difference of RUB 1,424 mn came from items below the operating line – likely interest on the cash position and other income, but the exact composition is not disclosed in the facts.
For the investor it matters that net profit remains positive and exceeds operating profit. This means that even in a weak quarter the company generates profit sufficient to support the dividend base. However, the sustainability of this support depends on how one-off or recurring the income below the operating line is.
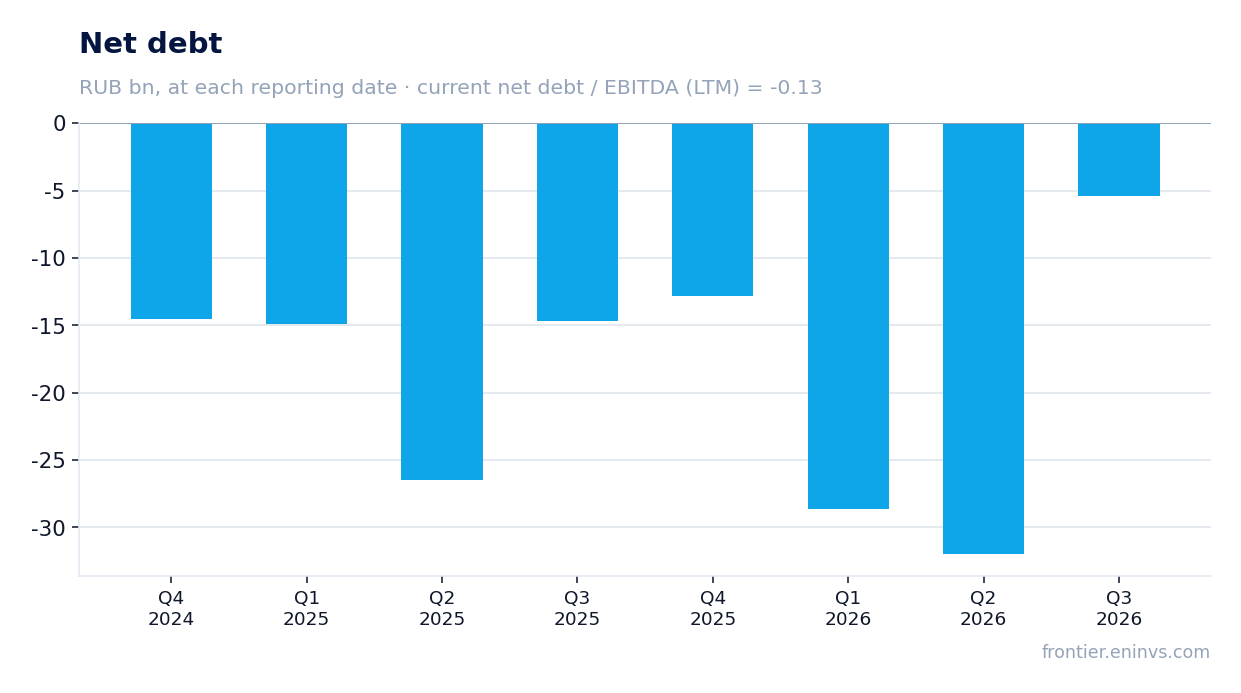
The company sits on net cash of RUB 5,379 mn with negative net debt and EV/EBITDA of 2.9 – the market values it below its own three-year average of 3.8
Net debt as of 30 September 2026 was minus RUB 5,379 mn, meaning the company has a net cash position. The ratio of net debt to EBITDA over the last twelve months is minus 0.13. This is a level, not a direction: it cannot be compared with past values, but the net cash position itself removes debt pressure.
The EV/EBITDA multiple over the last twelve months is 2.9, 24% below its own three-year average of 3.8. The stock trades cheaper than usual on this multiple. P/E over the last twelve months is 3.6 – a low level reflecting both the weakness of profit and general undervaluation.
On our fair-value model, which compares EBITDA growth with the target multiple, the stock trades 23% above its estimated fair value. This is our own calculation, not a market consensus. It suggests that the current price already prices in a recovery, and one should not count on re-rating upwards.
Dividends remain the main argument: RUB 1.1448 per share paid over the last 12 months with a 16.3% yield, and we estimate RUB 1.05 per share for the current year
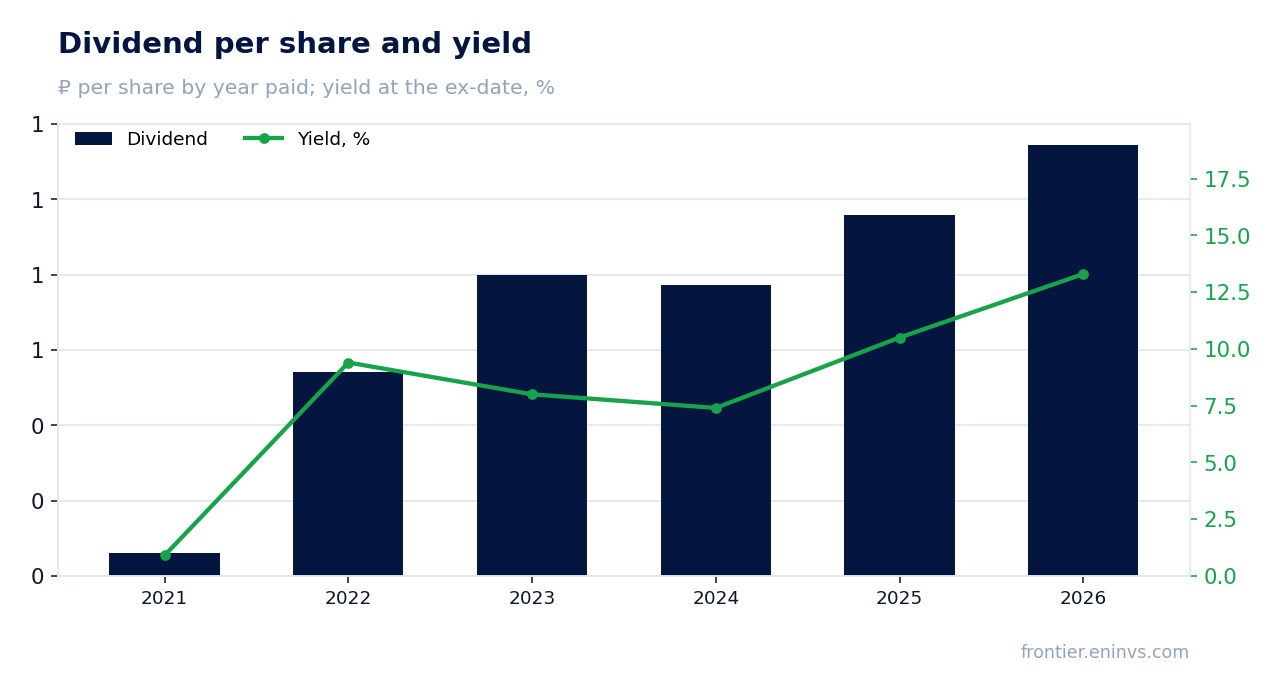
Over the last twelve months NMTP paid RUB 1.1448 per share, which at the current price gives a yield of 16.3%. In calendar 2026, RUB 1.14 per share has already been paid, and no further payouts are planned for this year. This is a generous stream: the yield is more than double the key rate of 14.0%.
Our estimate of the payout for the current financial year, to be paid next year, is RUB 1.05 per share, corresponding to 15.0% on the current price. This is our calculation: we take net profit over the last twelve months, multiply by the share of profit paid out last year (0.54), and divide by the number of shares. The board decides, and the actual payout may differ.
The yield history shows that the current level is not anomalous: in 2025 the yield at the ex-date was 10.5%, in 2026 – 13.3%. We consider a yield of 10.5% fair for this name. The current yield of 16.3% is above both the fair and historical levels, which compensates for the weakness of profit.
A further fall in revenue and profit, as well as rising capital expenditure, could reduce the payout. Capital expenditure is not disclosed for the third quarter, but in the second quarter it was RUB 7,689 mn – a significant burden. If profit continues to decline, the dividend base will narrow, and the board may revise the payout ratio.
Operating cash flow for the quarter was RUB 2,592 mn – it covers capital expenditure but leaves no cushion for higher payouts
Operating cash flow in the third quarter was RUB 2,592 mn against RUB 7,435 mn a year earlier. The more than twofold decline reflects lower revenue and profit. Over the last twelve months the flow was RUB 31,990 mn – a solid base, but the quarterly dynamic shows that the margin of safety is shrinking.
Capital expenditure is not disclosed for the reported quarter, but in the second quarter it was RUB 7,689 mn, and in the first – RUB 5,419 mn. With quarterly flow of RUB 2,592 mn, the company does not cover such investment from current flow and is spending its accumulated cash. The net cash position of RUB 5,379 mn still allows this, but the cushion is not endless.
For dividends this means that payouts are financed not only by flow but also by cash balances. If operating flow does not recover and capital expenditure remains high, the dividend may be cut. For now the company pays more than it earns in the quarter – a warning signal for the sustainability of payouts.
On our fair-value model the stock trades 23% above its estimated fair value – upside is exhausted, and it is worth holding for dividends, not for re-rating
Our fair-value model, which compares EBITDA growth with the target multiple, shows that the stock trades 23% above its estimated fair value. This is our own calculation, not a market consensus. It suggests that the current price already prices in a recovery of profit, and one should not count on re-rating upwards.
At the same time, the EV/EBITDA multiple of 2.9 is 24% below its own three-year average of 3.8. This indicates that the stock is cheaper than usual on this multiple. The discrepancy with the model is explained by the fact that the model takes into account not only the current multiple but also the EBITDA dynamic, which was weak in the third quarter.
For the investor this means that the main return will come from dividends, not from share price growth. A yield of 16.3% against the fair 10.5% is a weighty argument in favour of holding the stock. But if profit continues to fall, the dividend base will narrow, and then the current price will not look so low.
Valuation on the latest reported figures
| Metric | Value |
|---|---|
| Market cap | 135 bn ₽ |
| P/E (LTM) | 3.6 |
| EV/EBITDA (LTM) | 2.9 |
| P/B | 0.79 |
| Net debt / EBITDA (LTM) | -0.13 |
| Operating cash flow (LTM) | 32.0 bn |
| ROE | 3.6% |
| Dividend yield (12m) | 16.2% |
| EV/EBITDA, 3-year average | 3.8 |
Dividend per share, ₽, and yield at the ex-date
| Year paid | Dividend | Yield |
|---|---|---|
| 2021 | 0.06 | 0.9% |
| 2022 | 0.54 | 9.4% |
| 2023 | 0.80 | 8.0% |
| 2024 | 0.77 | 7.4% |
| 2025 | 0.96 | 10.5% |
| 2026 | 1.14 | 13.3% |
| Our estimate, current year | 1.05 | 15.0% on the current price |
Bottom line
The strong side of the report remains financial stability: a net cash position of RUB 5,379 mn and an EV/EBITDA multiple of 2.9 below its own three-year average of 3.8. However, revenue fell 32.3%, EBITDA – by 49.0%, and the margin compressed to 47.0% from 62.4%. The dividend yield of 16.3% against the fair 10.5% is the main argument in favour of the stock, but operating flow of RUB 2,592 mn does not cover capital expenditure. On our fair-value model the stock trades 23% above its estimated fair value, so it is worth holding for dividends, not for share price growth.
Open the company's financial profile NMTP →
See also: market overview · valuation map · stock screeners