OZON: RUB 10.1 bn profit alongside negative operating cash flow – growth funded by Fintech client money

On 7 August OZON released its Q2 2026 results. Revenue rose 46.8% year-on-year to RUB 334.2 bn, EBITDA grew 82.0% to RUB 55.2 bn, and net profit reached RUB 10.1 bn versus RUB 0.4 bn a year earlier. Operating cash flow was negative at minus RUB 106.2 bn, driven by Fintech client lending and securities purchases. At the current price the stock looks attractive: EV/EBITDA of 5.2 against 82% EBITDA growth, a 7.9% dividend yield and 71% upside on the portal's model outweigh the negative cash flow risk.
Key takeaways
— Revenue grew 46.8% year-on-year, but the pace decelerated from 48.9% a quarter earlier
— EBITDA rose 82.0%, lifting the margin to 16.5% from 13.3% a year earlier
— Net profit of RUB 10.1 bn – a 28-fold increase, but ROE remains negative due to accumulated losses
— Operating cash flow turned negative at minus RUB 106.2 bn on Fintech client lending
— Net debt rose to RUB 239.3 bn, but the ratio to LTM EBITDA stands at 1.6 – a moderate level
— Dividends for 2026 could reach about RUB 140 per share if the current profit trajectory holds
— EV/EBITDA of 5.2 and 71% upside on the portal's model make the valuation attractive against growth
Attractiveness
Key figures, RUB bn
| Metric | Q2 2025 | Q2 2026 | Change |
|---|---|---|---|
| Revenue | 228 | 334 | +46.8% |
| EBITDA | 30.3 | 55.2 | +82.0% |
| Operating profit | 20.3 | 31.3 | +53.8% |
| Net profit | 0.36 | 10.1 | +2709.7% |
| Operating cash flow | 180 | -106 | -159.0% |
| Capex | 12.6 | 15.4 | +22.0% |
| EBITDA margin | 13.3% | 16.5% | +3.2 pp |
| Net margin | 0.2% | 3.0% | +2.8 pp |
Revenue grew 46.8% year-on-year, but the pace decelerated from 48.9% a quarter earlier
In Q2 2026 OZON's revenue reached RUB 334.2 bn, up 46.8% from RUB 227.6 bn a year earlier. This is 2.1 percentage points slower than Q1, when growth was 48.9%. The deceleration does not look alarming: quarterly revenue has grown sequentially from RUB 300.9 bn in Q1 to RUB 334.2 bn in Q2.
The main contributors were service revenue and Fintech interest income. Service revenue rose to RUB 210.8 bn from RUB 140.9 bn, while interest revenue reached RUB 45.7 bn from RUB 29.3 bn. Goods sales grew more modestly to RUB 77.7 bn from RUB 57.4 bn, reflecting the shift towards the marketplace and financial services model.
The E-commerce segment generated RUB 273.4 bn in external revenue, Fintech RUB 60.8 bn. Within Fintech, interest revenue reached RUB 45.7 bn versus RUB 29.3 bn a year earlier, confirming the scaling of the loan portfolio. The slowdown in the overall pace is explained by the high base of last year: in Q2 2025 growth was 86.6%.
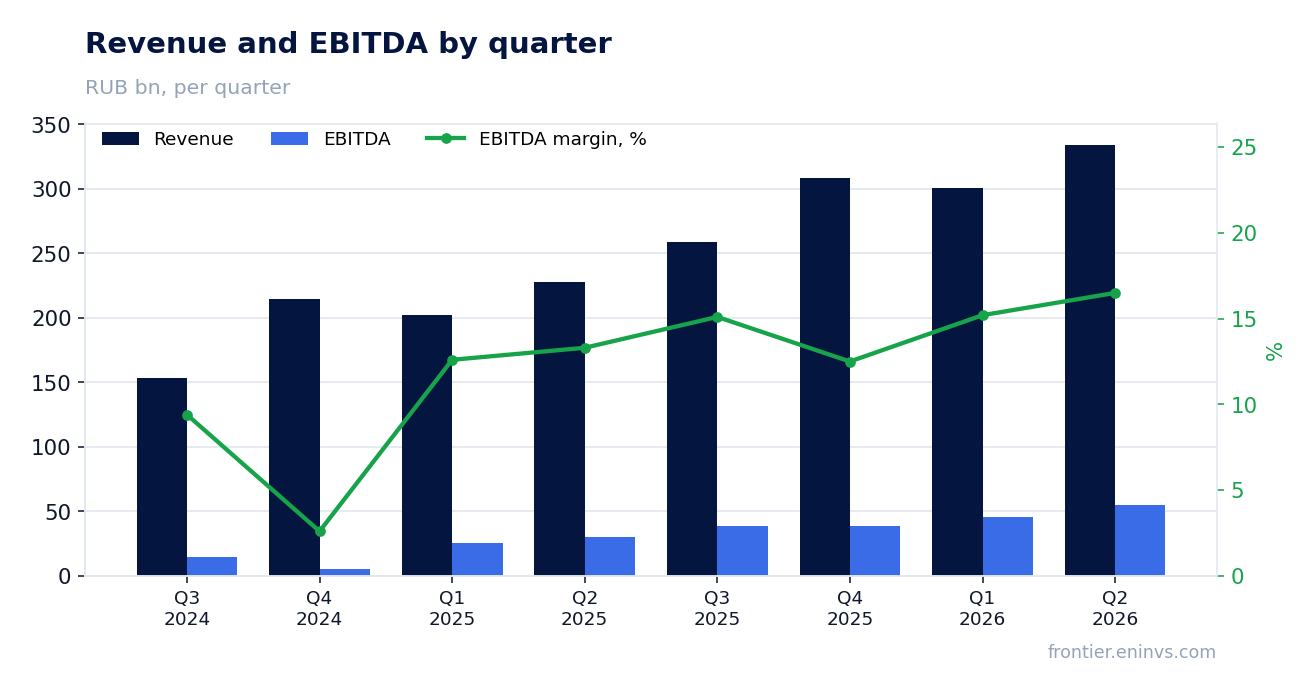
EBITDA rose 82.0%, lifting the margin to 16.5% from 13.3% a year earlier
EBITDA in Q2 2026 reached RUB 55.2 bn, up 82.0% from RUB 30.3 bn a year earlier. The EBITDA margin rose to 16.5% from 13.3% a year earlier – an increase of 3.2 percentage points. This is the highest quarterly margin in at least the past eighteen months.
The margin improvement came as revenue growth outpaced expenses. Cost of sales rose to RUB 254.3 bn from RUB 170.1 bn, but its share of revenue declined. Both segments contributed to EBITDA growth: E-commerce generated RUB 38.2 bn in adjusted EBITDA, Fintech RUB 19.7 bn versus RUB 24.9 bn and RUB 14.3 bn a year earlier respectively.
Operating profit reached RUB 31.3 bn versus RUB 20.3 bn a year earlier. Operating profit growth of 53.7% lags EBITDA growth due to higher depreciation – RUB 23.9 bn versus RUB 15.0 bn. This reflects the expansion of logistics infrastructure and growth in right-of-use assets.
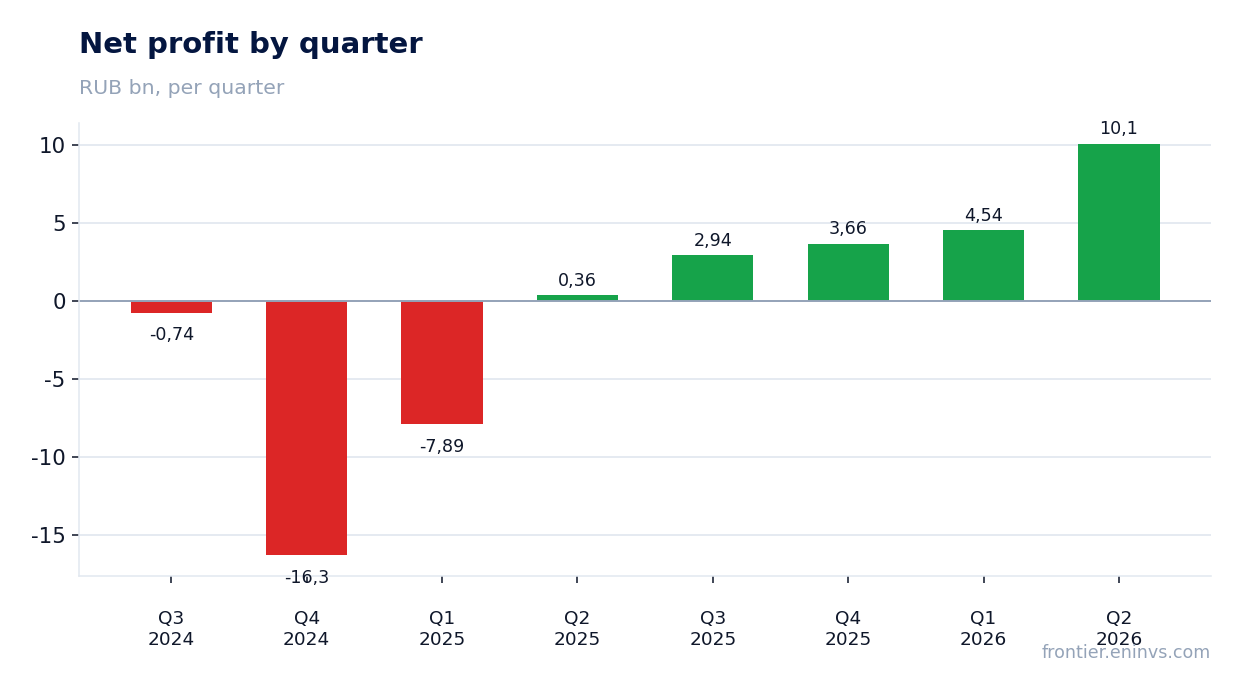
Net profit of RUB 10.1 bn – a 28-fold increase, but ROE remains negative due to accumulated losses
Net profit in Q2 2026 reached RUB 10.1 bn versus RUB 0.4 bn a year earlier. The 28-fold increase reflects not only improved operating efficiency but also lower finance costs: net finance costs declined to RUB 16.7 bn from RUB 17.3 bn a year earlier, despite higher debt.
The net margin rose to 3.0% from 0.2% a year earlier. This is the fourth consecutive profitable quarter, confirming the sustainability of the positive financial result. However, ROE remains negative at minus 26.2%, due to accumulated losses of RUB 311.5 bn and negative equity of RUB 154.0 bn.
Negative equity is a historical artefact, not a sign of current insolvency. The company generates positive EBITDA and has access to liquidity. Nevertheless, until equity is restored, ROE will remain negative, limiting the usefulness of this metric for valuation.
Operating cash flow turned negative at minus RUB 106.2 bn on Fintech client lending
Operating cash flow in Q2 2026 was minus RUB 106.2 bn versus positive RUB 179.9 bn a year earlier. This reversal is explained by Fintech activity: lending to clients and investments in securities require significant cash outflows. For H1 2026, net operating cash flow remains positive at RUB 285.3 bn, though lower than RUB 212.4 bn a year earlier.
The key factor is the growth of the Fintech loan portfolio. Over the six months of 2026, loans to clients increased to RUB 175.7 bn from RUB 130.1 bn at end-2025. At the same time, Fintech client funds grew to RUB 882.6 bn from RUB 627.3 bn, partially funding this growth. However, in the standalone quarter, the outflow from loans exceeded the inflow of client funds, leading to negative cash flow.
Capital expenditures in Q2 were RUB 15.4 bn, slightly above RUB 12.6 bn a year earlier. For H1, capex reached RUB 29.8 bn versus RUB 25.7 bn a year earlier. Property, plant and equipment grew to RUB 167.1 bn from RUB 158.7 bn at end-2025. Negative operating cash flow combined with capital expenditures means the company is funding growth from its balance sheet rather than internal cash generation.
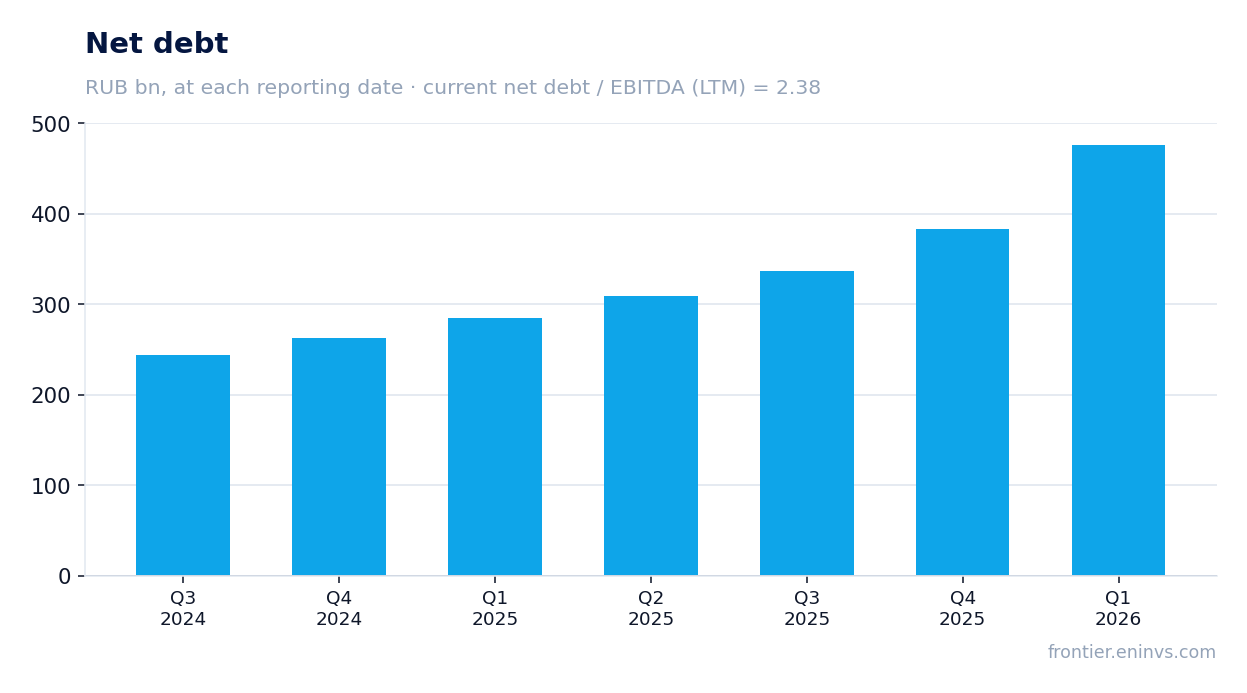
Net debt rose to RUB 239.3 bn, but the ratio to LTM EBITDA stands at 1.6 – a moderate level
Net debt as of 30 June 2026 was RUB 239.3 bn, up from RUB 212.2 bn on 31 March 2026 (+RUB 27.2 bn) and from RUB 171.0 bn on 30 June 2025 (+RUB 68.3 bn). The increase reflects financing of capital expenditures and the Fintech loan portfolio. The ratio of net debt to LTM EBITDA stands at 1.6 – a moderate level for a growing business.
The debt structure includes both borrowings and lease liabilities. Borrowings as of 30 June 2026 were RUB 85.9 bn (RUB 71.1 bn short-term and RUB 14.8 bn long-term), while lease liabilities reached RUB 372.0 bn (RUB 326.6 bn long-term and RUB 45.5 bn short-term). Leases are a significant part of the debt burden, but they are backed by right-of-use assets worth RUB 358.7 bn.
Interest expenses on leases in Q2 were RUB 15.6 bn, on borrowings RUB 4.2 bn. The decline in interest expenses on borrowings from RUB 6.1 bn a year earlier is due to refinancing and lower rates. The company has significant liquidity: cash and equivalents as of 30 June 2026 were RUB 718.7 bn, although a large portion is Fintech client funds.
Dividends for 2026 could reach about RUB 140 per share if the current profit trajectory holds
Over the last 12 months OZON paid RUB 213.55 per share, giving a dividend yield of 7.9% at the current price. Payments for 2025 were RUB 143.55 per share (3.4% yield at the ex-date), for 2026 – RUB 70.0 per share (1.7% yield). The company is not a classic dividend story: payments started recently and do not yet have a long history.
Our estimate for the 2026 dividend is about RUB 140 per share, based on the assumption that the company maintains its current profit trajectory and allocates a comparable share to payouts. This is our estimate, not company guidance. It is based on LTM profit of RUB 8.8 bn and expected profit growth in 2026. If annual profit reaches RUB 30–40 bn, the dividend could be higher.
The key risk to the dividend is negative operating cash flow. If Fintech continues to actively grow its loan portfolio, free cash may be directed towards funding growth rather than payouts. In addition, the company has negative equity, which formally limits the ability to pay. The dividend policy has not yet been disclosed in detail, adding uncertainty.
EV/EBITDA of 5.2 and 71% upside on the portal's model make the valuation attractive against growth
The EV/EBITDA multiple for the last 12 months is 5.2, P/E – 66.5. For a company growing revenue at 46.8% and EBITDA at 82.0%, this EV/EBITDA level looks low. Market capitalisation is RUB 584.1 bn, net debt RUB 239.3 bn. On the portal's model, the upside to fair value is estimated at 71%.
Comparison with its own history is difficult, as the company only recently became profitable. However, the current EV/EBITDA of 5.2 is significantly below levels typical for fast-growing technology companies. At the same time, P/E of 66.5 reflects the low profit base: even after growth, LTM net profit is only RUB 8.8 bn.
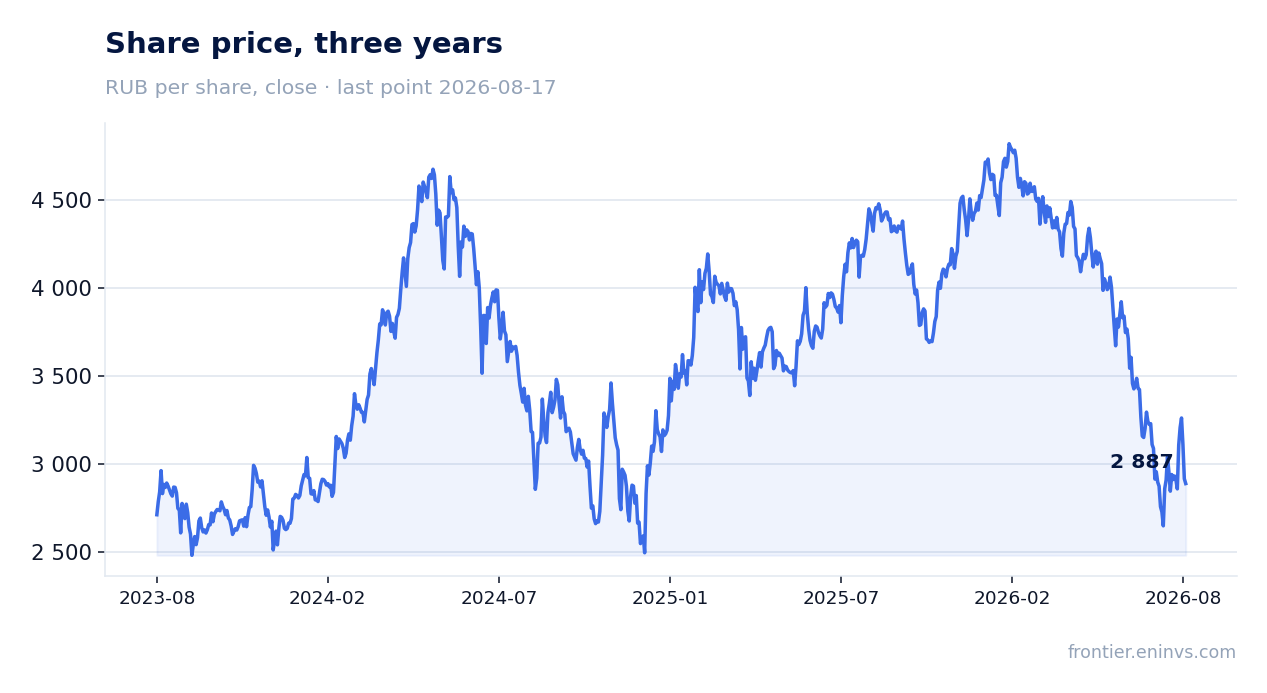
The market reaction to the report was muted: the share fell 1.8% on the publication day and 0.7% from the release to 17 August. This may indicate that the market expected stronger results or that negative cash flow is causing concern. Nevertheless, fundamentals are improving, and if the trajectory holds, valuations could be revised upwards.
Valuation on the latest reported figures
| Metric | Value |
|---|---|
| Market cap | 584 bn ₽ |
| P/E (LTM) | 66.5 |
| EV/EBITDA (LTM) | 5.2 |
| Net debt / EBITDA (LTM) | 1.60 |
| Operating cash flow (LTM) | 185 bn |
| ROE | -26.2% |
| Dividend yield (12m) | 7.9% |
Dividend per share, ₽, and yield at the ex-date
| Year paid | Dividend | Yield |
|---|---|---|
| 2025 | 143.55 | 3.4% |
| 2026 | 70.00 | 1.7% |
Bottom line
OZON delivered a strong quarter: revenue grew 46.8%, EBITDA 82.0%, net profit reached RUB 10.1 bn. The EBITDA margin rose to 16.5%, and the net margin to 3.0%. However, operating cash flow turned negative at minus RUB 106.2 bn due to Fintech client lending, and this is the main question for a holder. Leverage is moderate at 1.6x EBITDA, and the 7.9% dividend yield supports interest. With EV/EBITDA of 5.2 and 71% upside on the portal's model, the stock looks attractive, but cash flow sustainability remains the key risk.
Open the company's financial profile OZON →
See also: market overview · valuation map · stock screeners