Ozon Pharm: H1 profit up 89.7%, but trailing operating cash flow is barely half of EBITDA
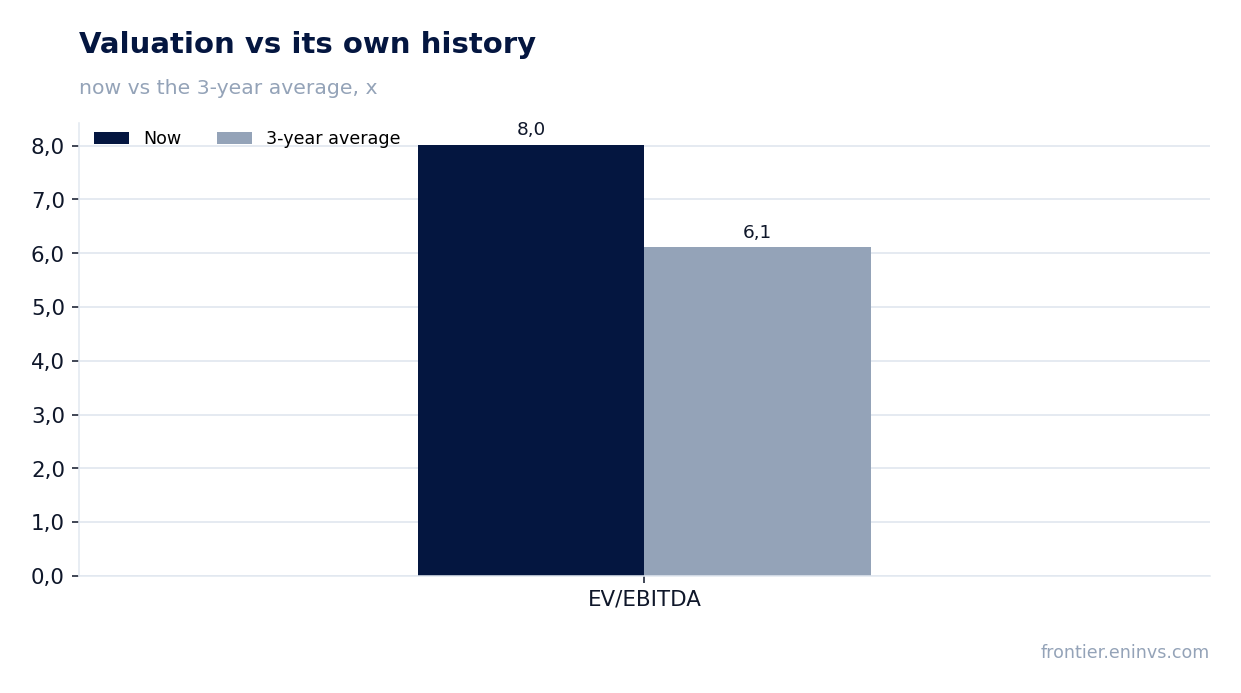
25 августа «Озон Фарм» раскрыла результаты за первое полугодие 2026 года: выручка выросла на 11,7% до 14 821 млн руб., EBITDA – на 20,8%, а чистая прибыль – на 89,7% до 3 247 млн руб. Рентабельность по EBITDA достигла 36,9% против 34,1% годом ранее, чистая маржа – 21,9% против 12,9%. При этом за последние 12 месяцев операционный денежный поток составил лишь 3 300 млн руб. против EBITDA в 7 327 млн руб., что ставит вопрос о качестве прибыли. На текущей цене акция выглядит скорее привлекательно: мультипликатор EV/EBITDA (8,3x) выше собственного трёхлетнего среднего (6,1x), но модель портала даёт потенциал роста на 16%.
Key takeaways
— Net profit for H1 rose 89.7% to RUB 3,247m, but nearly half of the gain is a low-base effect from last year's high finance costs
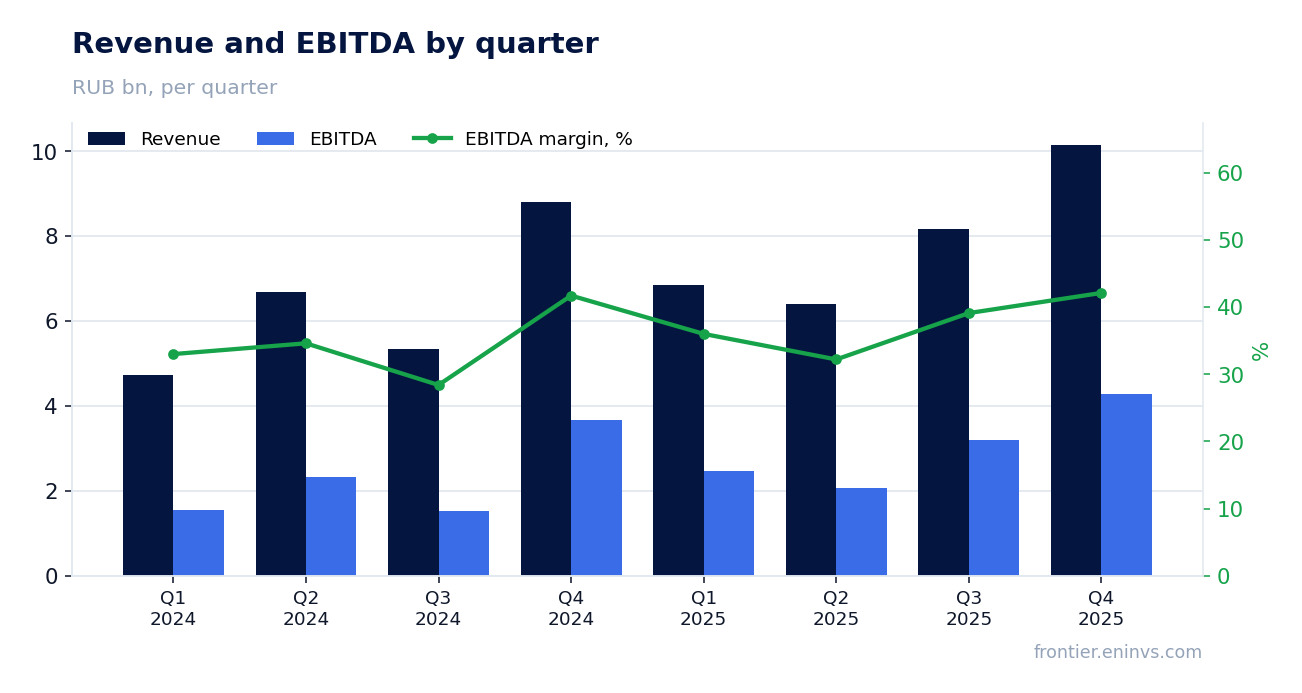
— EBITDA for H1 grew 20.8% to RUB 5,472m, with margin expanding to 36.9% from 34.1%
— Operating cash flow for the trailing twelve months is RUB 3,300m, only 45% of EBITDA over the same period
— Debt burden: net debt of RUB 9,185.8m is 1.25x EBITDA for the trailing twelve months
— Capex for H1 is RUB 2,320.9m, almost double the operating cash flow for the same period
— Dividends over the last 12 months are RUB 0.79 per share, a yield of 1.8%, well below the 7.0% we consider fair
— The portal's model implies 16% upside for the share, making it attractive at current levels
Attractiveness
Key figures, RUB bn
| Metric | H1 2025 | H1 2026 | Change |
|---|---|---|---|
| Revenue | 13.3 | 14.8 | +11.7% |
| EBITDA | 4.53 | 5.47 | +20.8% |
| Operating profit | 3.95 | 4.86 | +23.1% |
| Net profit | 1.71 | 3.25 | +89.7% |
| Operating cash flow | 2.76 | 6.82 | +146.9% |
| Capex | 1.98 | 2.32 | +17.2% |
| EBITDA margin | 34.1% | 36.9% | +2.8 pp |
| Net margin | 12.9% | 21.9% | +9.0 pp |
Net profit for H1 rose 89.7% to RUB 3,247m, but nearly half of the gain is a low-base effect from last year's high finance costs
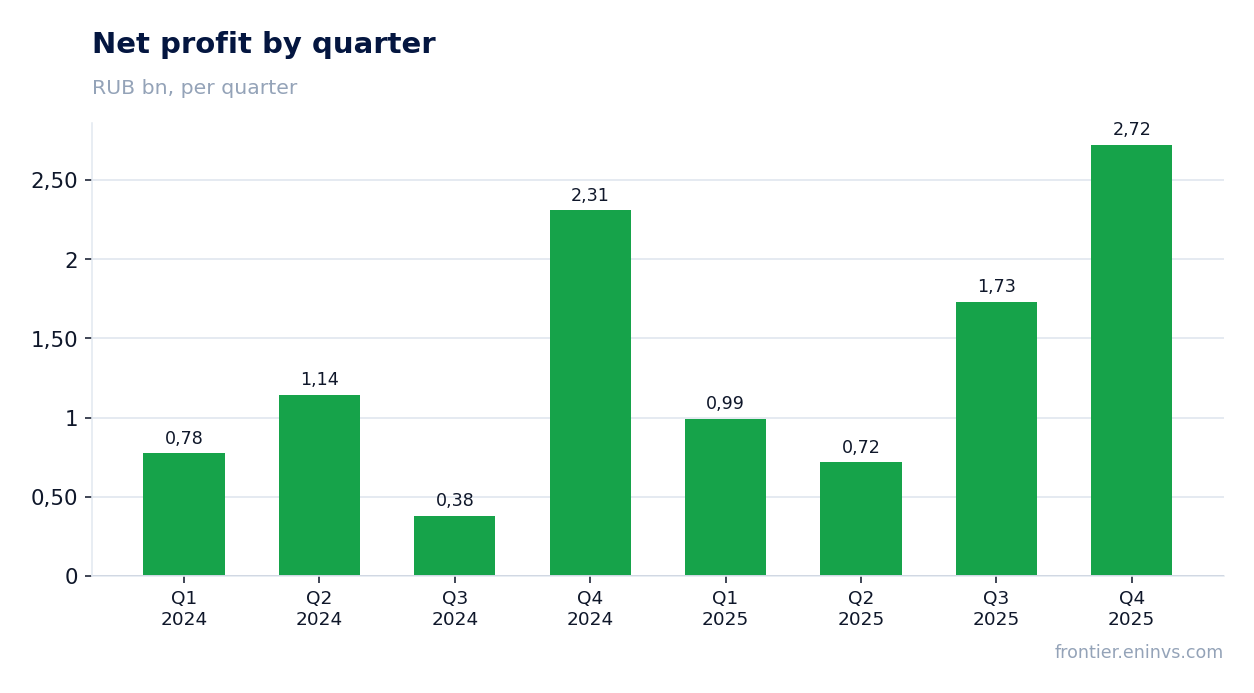
For H1 2026, Ozon Pharm's net profit reached RUB 3,247m versus RUB 1,712m a year earlier. The 89.7% growth is partly explained by abnormally high finance costs in H1 2025 – RUB 2,042.7m versus RUB 1,027.1m in the current period. The near-billion reduction in finance costs contributed a large share of the profit increase.
Operating profit rose 23.1% from RUB 3,947m to RUB 4,860m, reflecting improved operational efficiency. However, net profit was also affected by a swing in foreign exchange losses: last year there was a gain of RUB 395.5m, this year a loss of RUB 52.6m, reducing profit by RUB 448m. Excluding these factors, growth would have been less impressive.
EBITDA for H1 grew 20.8% to RUB 5,472m, with margin expanding to 36.9% from 34.1%
EBITDA for H1 2026 reached RUB 5,472m, up 20.8% year-on-year. The EBITDA margin expanded to 36.9% from 34.1%, indicating improved operational efficiency. The main driver was revenue growth (+11.7%) outpacing cost of sales, which declined 1.4% from RUB 7,508.8m to RUB 7,403.5m.
Gross profit rose 28.9% from RUB 5,755m to RUB 7,418m, providing the main contribution to EBITDA growth. Selling and administrative expenses grew slower than revenue, also supporting the margin. However, note that H1 2025 figures were restated due to a change in classification of labour costs, which may affect comparability of line items.
Operating cash flow for the trailing twelve months is RUB 3,300m, only 45% of EBITDA over the same period
For the trailing twelve months (four quarters from Q4 2025 to Q3 2026), Ozon Pharm's operating cash flow was RUB 3,300m, while EBITDA over the same period was RUB 7,327m. The gap of RUB 4,027m is explained by significant working capital changes and tax payments. In particular, Q4 2025 operating cash flow was negative at minus RUB 58.1m, and Q3 2025 was only RUB 549.1m.
The low conversion of EBITDA into cash flow is a key risk for valuation. If the company cannot improve working capital management, its ability to fund capex and dividends from operating flow will be constrained. The H1 cash flow statement shows working capital changes contributed a positive RUB 3,844.7m, but that is insufficient to offset seasonal swings.
Debt burden: net debt of RUB 9,185.8m is 1.25x EBITDA for the trailing twelve months
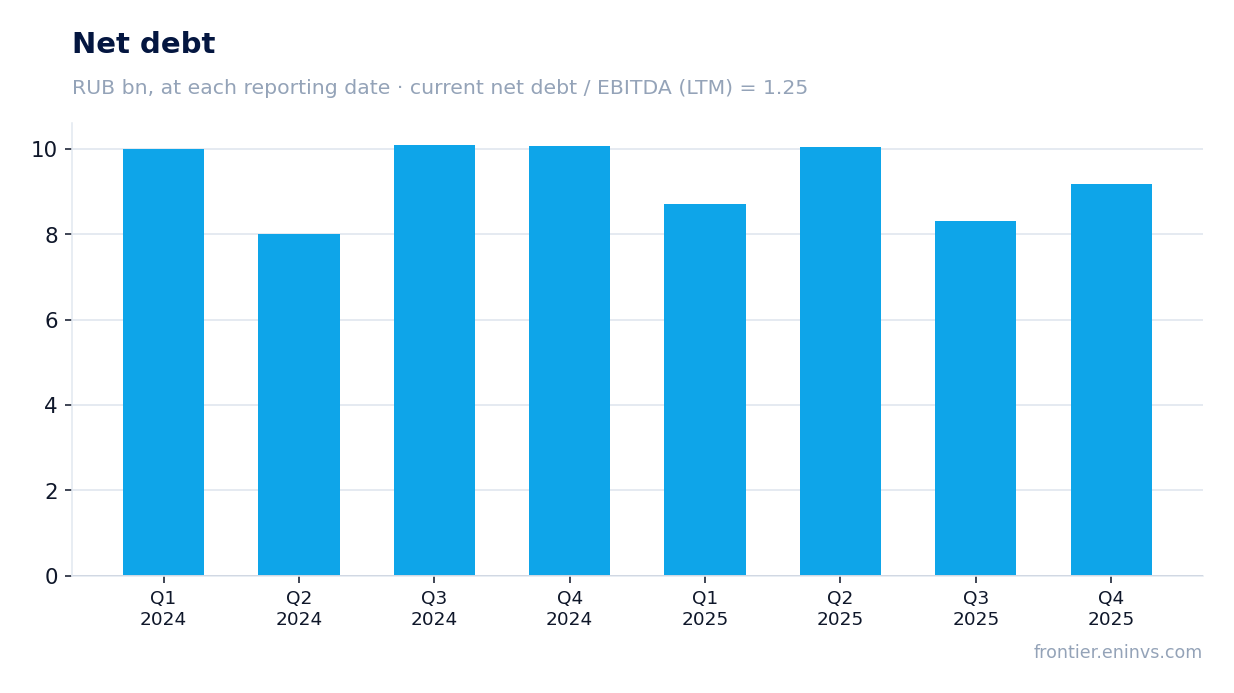
As of the end of Q2 2026, Ozon Pharm's net debt stood at RUB 9,185.8m, corresponding to 1.25x EBITDA for the trailing twelve months. Over the last 12 months, net debt decreased by RUB 4.5bn, indicating an improving debt position. However, leverage remains moderate and does not create significant constraints on financial flexibility.
The H1 cash flow statement shows active borrowing and repayment: proceeds from loans were RUB 2,995.8m, repayments RUB 6,603.6m. Factoring schemes were also used. Finance costs for H1 declined to RUB 1,027.1m from RUB 2,042.7m a year earlier, reflecting both lower debt and a reduced CBR key rate.
Capex for H1 is RUB 2,320.9m, almost double the operating cash flow for the same period
In H1 2026, Ozon Pharm's capital expenditures were RUB 2,320.9m (payments for property, plant and equipment of RUB 1,052.6m and intangible assets of RUB 1,268.3m). This is almost double the operating cash flow for the same period, which was RUB 6,819m? No, operating flow for H1 is RUB 6,819m, but capex is still significant.
Most capex is directed to the construction of a new plant and drug development. The report states that capital expenditures on fixed assets include costs for a plant under construction and equipment for production and packaging. Capitalised borrowing costs were RUB 134m at a capitalisation rate of 16.7%. These investments should support future growth, but they strain cash flow.
Dividends over the last 12 months are RUB 0.79 per share, a yield of 1.8%, well below the 7.0% we consider fair
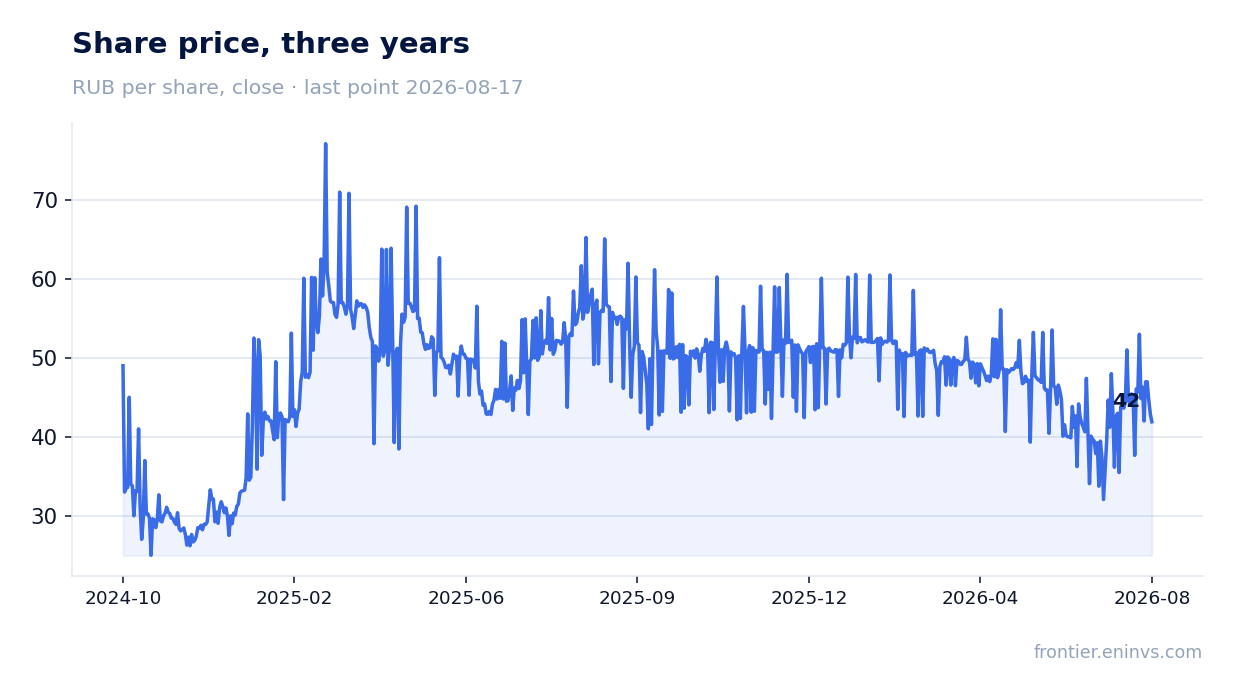
Over the last 12 months, Ozon Pharm paid dividends of RUB 0.79 per share, providing a yield of 1.8% at the current price. Our model estimates the next payment at RUB 1.07 per share, implying a forward yield of 2.4%. However, the fair yield for this issuer, in our view, is 7.0%, indicating a significant gap between current and required yield.
The payout ratio is 0.19 of profit, leaving ample room to increase dividends. However, at a current yield of 1.8%, the share looks unattractive for income-oriented investors. The company declared dividends for H1 of RUB 626.9m, equivalent to roughly RUB 0.54 per share.
The portal's model implies 16% upside for the share, making it attractive at current levels
Our fundamental value-creation model estimates the upside potential of Ozon Pharm's share at +16% from the current price. This is based on EBITDA growth and a target multiple. The share trades at P/E of 12.8x and EV/EBITDA of 8.3x for the trailing twelve months, above its own three-year average EV/EBITDA of 6.1x. Nevertheless, the portal's model indicates undervaluation.
The share is held in our live model strategies on the portal: RU GARP and acceleration. This reflects meeting fundamental selection criteria, but is not an argument for a recommendation. The key factor for attractiveness is the combination of moderate valuation, profit growth, and debt reduction, offering potential for re-rating.
Valuation on the latest reported figures
| Metric | Value |
|---|---|
| Market cap | 51.8 bn ₽ |
| P/E (LTM) | 12.8 |
| EV/EBITDA (LTM) | 8.3 |
| P/B | 1.56 |
| Net debt / EBITDA (LTM) | 1.25 |
| ROE | 18.8% |
| Dividend yield (12m) | 1.8% |
| EV/EBITDA, 3-year average | 6.1 |
Bottom line
The report's strengths are significant growth in net profit and EBITDA, margin expansion, debt reduction of RUB 4.5bn over 12 months, and moderate leverage (1.25x EBITDA). However, earnings quality raises questions: operating cash flow over the trailing twelve months was only 45% of EBITDA, and capex almost doubled operating flow for H1. The dividend yield of 1.8% is well below the 7.0% we consider fair, making the share unattractive for income investors. Nevertheless, the portal's model implies 16% upside, and at the current valuation the share looks rather attractive for long-term capital-growth investors. The key question for holders is whether the company can improve profit-to-cash conversion to fund growth without increasing debt.
Open the company's financial profile OZPH →
See also: market overview · valuation map · stock screeners