Polyus: H1 profit down 64.5% — on FX and tax, not gold

On August 31, Polyus released its interim condensed statements for H1 2026. Revenue rose 13.8% YoY to RUB 352.7 bn, but net profit fell 64.5% to RUB 61.2 bn. The review shows that operations remained strong, and the profit decline is due to FX and tax effects, not a deteriorating business.
Key takeaways
— Revenue grew 13.8% in H1 — on higher gold prices and sales volumes
— Net profit fell 64.5% — on FX and tax, not gold
— Net margin dropped from 55.7% to 17.4% — on non-cash items
— Leverage at 1.4x EBITDA LTM, while debt rose by RUB 47.7 bn in six months
— Dividend yield 18.3% — above our fair level of 10.5%, but model estimates next payout at RUB 0.0 per share
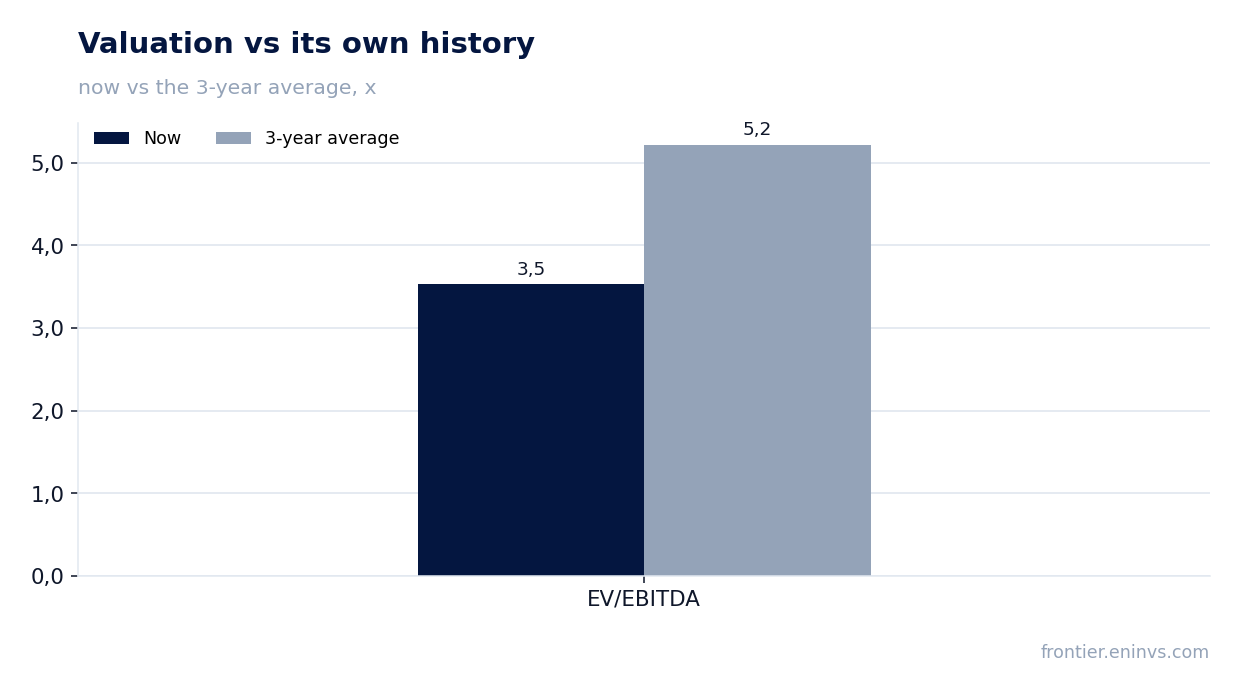
— Valuation: P/E LTM 4.8x, EV/EBITDA LTM 3.5x — below 3-year average (5.2x)
Key figures, RUB bn
| Metric | H1 2025 | H1 2026 | Change |
|---|---|---|---|
| Revenue | 310 | 353 | +13.8% |
| EBITDA | 205 | — | — |
| Operating profit | 184 | — | — |
| Net profit | 172 | 61.2 | -64.5% |
| Operating cash flow | 284 | — | — |
| Capex | 98.0 | — | — |
| EBITDA margin | 66.2% | — | — |
| Net margin | 55.7% | 17.4% | -38.3 pp |
Revenue grew 13.8% in H1 — on higher gold prices and sales volumes
In H1 2026, Polyus revenue reached RUB 352.7 bn, up 13.8% from the same period a year earlier. The main contribution came from gold sales — RUB 344.7 bn versus RUB 300.6 bn in H1 2025. Other sales brought RUB 8.0 bn versus RUB 9.2 bn a year earlier.
The revenue growth reflects a favorable environment: gold prices remained high, and sales volumes were stable. This confirms that the operating base of the business has not weakened, despite pressure on profit.
Net profit fell 64.5% — on FX and tax, not gold
Net profit for H1 2026 was RUB 61.2 bn versus RUB 172.5 bn a year earlier — a decline of 64.5%. Profit before tax fell from RUB 230.1 bn to RUB 93.3 bn, while income tax expense decreased from RUB 57.6 bn to RUB 32.1 bn.
The key factor is the line 'Operating expenses and other income/(expenses)': it rose from RUB 79.7 bn to RUB 259.3 bn. According to the notes, this line includes finance costs, FX differences, and revaluation of derivatives. It is these non-cash items, not the cost of mining, that ate into profit.
Importantly, operations remained profitable: revenue grew, and the profit decline is related to financial and FX effects, which do not reflect a deterioration in the core business.
Net margin dropped from 55.7% to 17.4% — on non-cash items
Net margin for H1 2026 was 17.4% versus 55.7% a year earlier. The decline of 38.3 p.p. is a direct consequence of the growth in 'Operating expenses and other income/(expenses)', which included FX differences and revaluation.
This is not a deterioration in operational efficiency: cost of sales and commercial expenses did not show such explosive growth. EBITDA margin LTM, judging by indirect data, remains high — EBITDA LTM was RUB 462.4 bn on revenue LTM of RUB 755.6 bn, implying a margin of about 61%.
Leverage at 1.4x EBITDA LTM, while debt rose by RUB 47.7 bn in six months
Net debt as of June 30, 2026 was RUB 649.2 bn, up RUB 47.7 bn from the previous reporting date. However, over the last 12 months, net debt decreased by RUB 74.9 bn, indicating the company's ability to generate free cash flow.
The net debt to EBITDA LTM ratio is 1.4x. This is a moderate level for a gold miner, especially given high profitability and stable operating cash flow: over the last 12 months, it amounted to RUB 517.7 bn.
The debt increase over the half-year is likely related to financing capital expenditures and dividend payments, but the decline over 12 months shows that the company is managing its balance sheet.
Dividend yield 18.3% — above our fair level of 10.5%, but model estimates next payout at RUB 0.0 per share
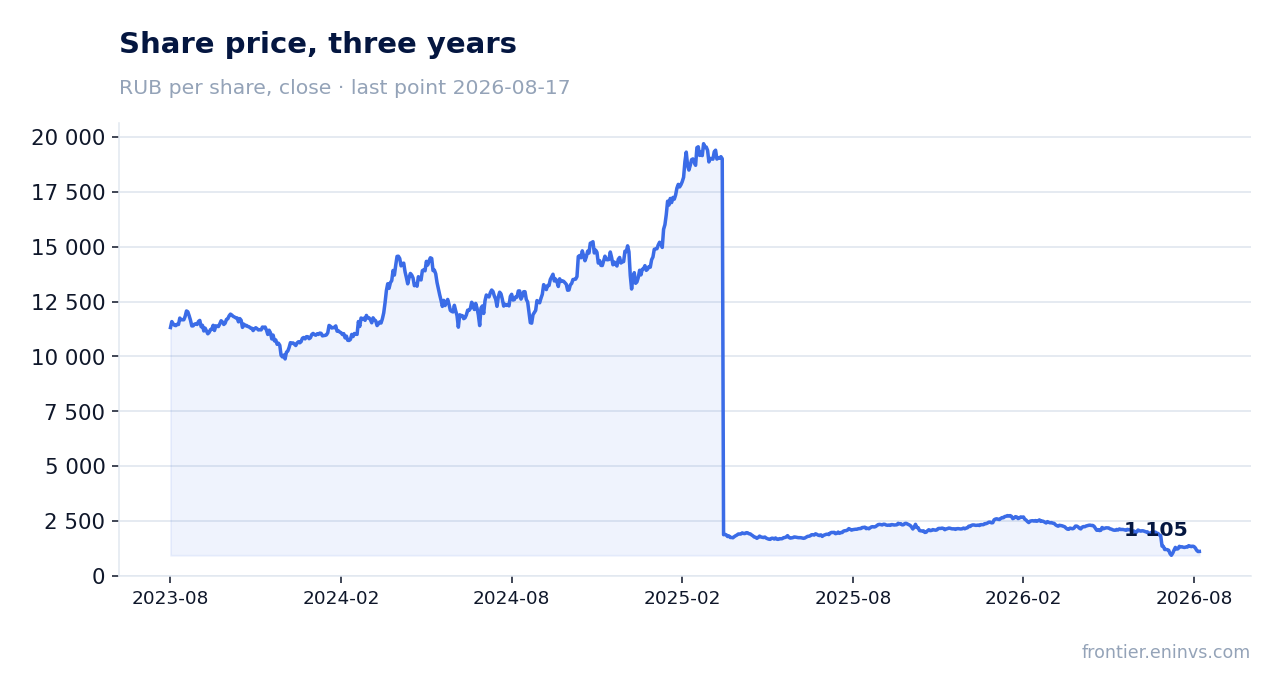
Over the last 12 months, Polyus paid RUB 192.7 per share, providing a dividend yield of 18.3%. This is significantly above our fair level of 10.5% for this issuer, making the stock attractive for income-oriented investors.
However, our model estimates the next payout at RUB 0.0 per share. This means that after generous payments, the company may take a pause in dividends, directing funds to capital expenditures or debt reduction. The implied payout ratio is 0.42 of profit, consistent with historical policy, but with a zero forecast, investors should be prepared for no dividends in the next 12 months.
The question for holders: will the company maintain payments at the previous level, or will a dividend pause become the new norm?
Valuation: P/E LTM 4.8x, EV/EBITDA LTM 3.5x — below 3-year average (5.2x)
As of the latest reporting date, P/E LTM is 4.8x, and EV/EBITDA LTM is 3.5x. This is noticeably below the three-year average EV/EBITDA of 5.2x. Thus, the stock trades at a discount to its own history.
Low multiples reflect both the decline in net profit (which inflated P/E) and moderate debt. At the same time, ROE is 46.7% — a very high figure, indicating strong profit generation on equity.
For an investor, this means the market is pricing in either lower gold prices or dividend pause risks. If operating results remain strong, the potential for multiple re-rating persists.
Valuation on the latest reported figures
| Metric | Value |
|---|---|
| Market cap | 983 bn ₽ |
| P/E (LTM) | 4.8 |
| EV/EBITDA (LTM) | 3.5 |
| P/B | 3.62 |
| Net debt / EBITDA (LTM) | 1.40 |
| ROE | 46.7% |
| Dividend yield (12m) | 18.5% |
| EV/EBITDA, 3-year average | 5.2 |
Bottom line
In H1 2026, Polyus showed strong operating dynamics: revenue grew 13.8%, and EBITDA LTM remains high. The 64.5% drop in net profit is due to FX differences and revaluation, not a deteriorating business. Debt is moderate, and multiples are below its own history, offering re-rating potential. The main question for holders is dividends: the model estimates the next payout at RUB 0.0 per share, and if the pause is confirmed, the current 18.3% yield will prove one-off. Watch gold prices and capex decisions.
Open the company's financial profile PLZL →
See also: market overview · valuation map · stock screeners