Promomed: H1 revenue up 81.9%, but operating cash flow turned negative at RUB 742.8 mn
On August 28, Promomed reported H1 2025 results: revenue up 81.9% to RUB 12,974.7 mn, EBITDA up 106.4% to RUB 4,126.5 mn, net profit of RUB 1,418.0 mn versus RUB 5.1 mn a year earlier. This review looks at what drove these numbers and why operating cash flow remains negative.
Key takeaways
— H1 revenue grew 81.9% to RUB 12,974.7 mn, but Q2 growth slowed to 32.5%
— H1 EBITDA increased 106.4% to RUB 4,126.5 mn, margin expanded from 28.1% to 31.8%
— H1 net profit reached RUB 1,418.0 mn versus RUB 5.1 mn a year earlier
— H1 operating cash flow was negative at RUB 742.8 mn due to inventory and receivables growth
— Net debt stood at RUB 16,804.5 mn, with net debt/EBITDA LTM at 2.19
— H1 capex totaled RUB 1,392.5 mn, dividends over 12 months were RUB 8.0 per share
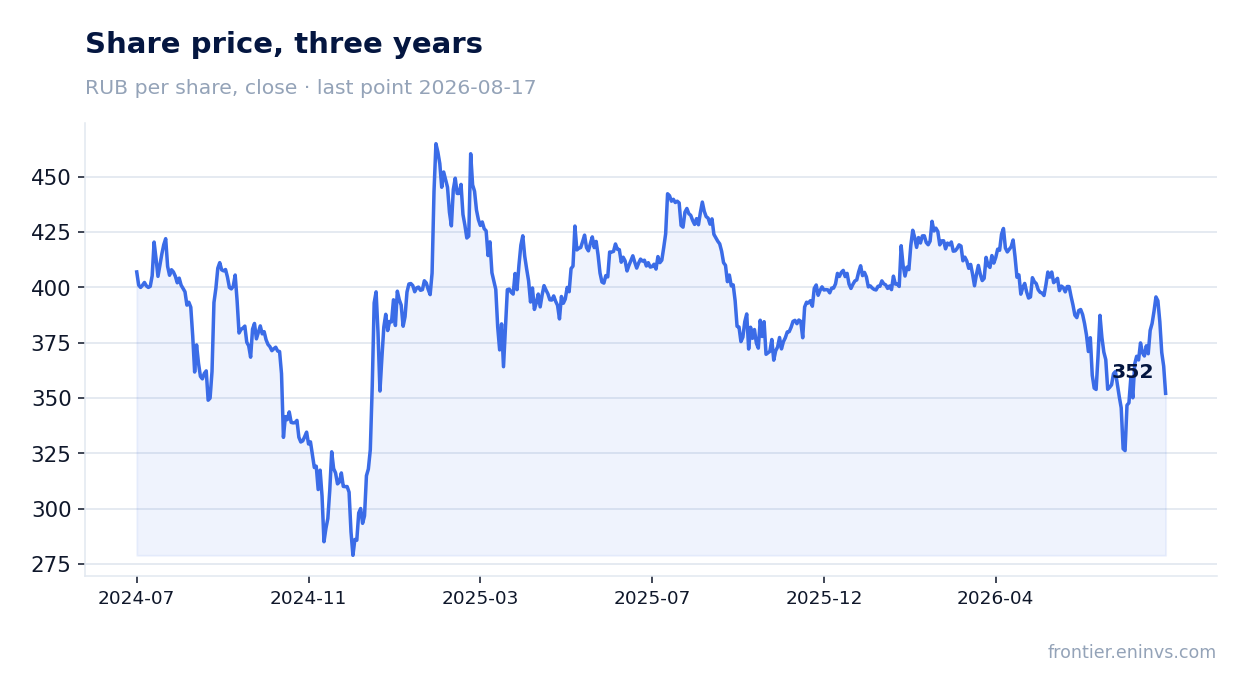
— Shares fell 18.6% after the report to RUB 352.2 (as of August 17, 2026)
Key figures, RUB bn
| Metric | H1 2024 | H1 2025 | Change |
|---|---|---|---|
| Revenue | 7.13 | 13.0 | +81.9% |
| EBITDA | 2.00 | 4.13 | +106.4% |
| Operating profit | 1.52 | 3.48 | +129.2% |
| Net profit | 0.01 | 1.42 | +27801.9% |
| Operating cash flow | -1.47 | -0.74 | — |
| Capex | 1.34 | 1.39 | +4.0% |
| EBITDA margin | 28.1% | 31.8% | +3.7 pp |
| Net margin | 0.1% | 10.9% | +10.8 pp |
H1 revenue grew 81.9% to RUB 12,974.7 mn, but Q2 growth slowed to 32.5%
In H1 2025, Promomed's revenue reached RUB 12,974.7 mn, up 81.9% year-on-year. The company attributes the growth to higher production and sales volumes, as well as an expanded product portfolio.
However, quarterly dynamics are uneven: in Q2 2025, revenue grew 32.5% year-on-year, while in Q1 it was only 5.8%. This points to persistent seasonality: most revenue traditionally comes in H2, when government tender purchases take place.
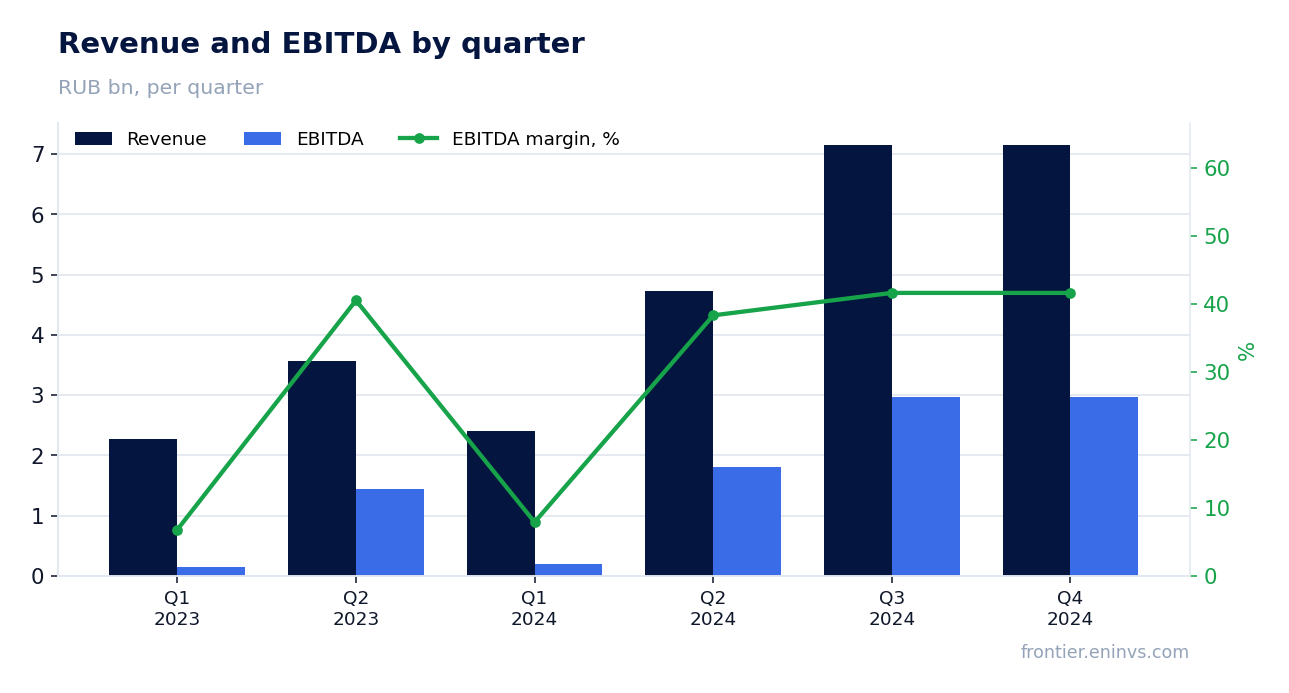
H1 EBITDA increased 106.4% to RUB 4,126.5 mn, margin expanded from 28.1% to 31.8%
H1 2025 EBITDA grew 106.4% to RUB 4,126.5 mn (calculated as 12,974.7 × 31.8%). EBITDA margin expanded from 28.1% to 31.8% – the best level in the last four quarters.
Margin expansion was driven by revenue growing faster than costs: cost of sales rose 68.3% (to RUB 5,006.8 mn), selling expenses 65.8% (to RUB 2,589.3 mn), and administrative expenses 73.0% (to RUB 1,768.9 mn). As a result, gross profit increased 91.6% to RUB 7,967.9 mn.
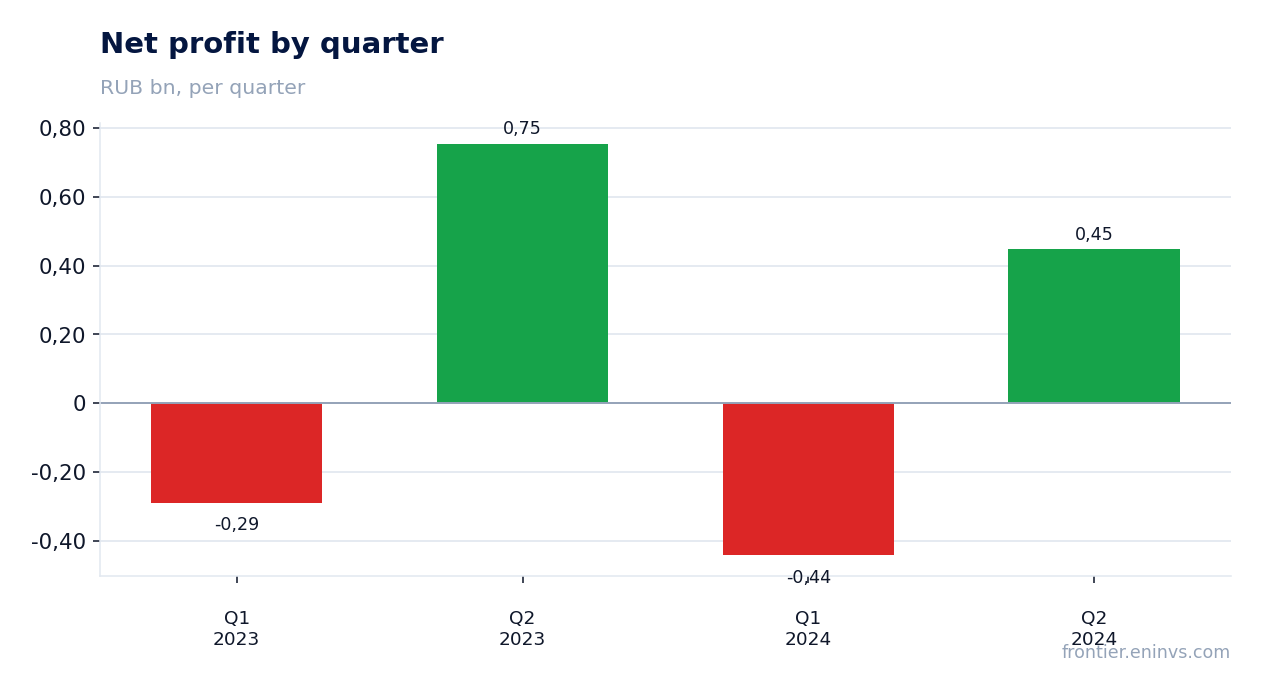
H1 net profit reached RUB 1,418.0 mn versus RUB 5.1 mn a year earlier
H1 2025 net profit reached RUB 1,418.0 mn versus RUB 5.1 mn in H1 2024. The 27,801.9% increase is explained by both the operational surge and a low base effect: a year earlier profit was nearly zero due to high finance costs.
Finance costs more than doubled in H1 to RUB 2,156.5 mn, reflecting higher debt and elevated interest rates. Still, operating profit (RUB 3,479.4 mn) comfortably covered interest payments, resulting in substantial net profit.
H1 operating cash flow was negative at RUB 742.8 mn due to inventory and receivables growth
Despite profitability, H1 2025 operating cash flow was negative at RUB 742.8 mn (versus negative RUB 1,471.8 mn a year earlier). The main reason is a significant build-up in inventories: they increased by RUB 2,454.9 mn during H1, to RUB 8,445.1 mn. The company was ramping up production in anticipation of strong H2 demand.
Trade receivables also grew by RUB 912.3 mn, to RUB 18,373.5 mn. The report discloses that one counterparty accounts for 50% of financial receivables (RUB 8,343.0 mn), creating concentration risk. Interest paid in H1 totaled RUB 2,557.9 mn – almost double the year-earlier level.
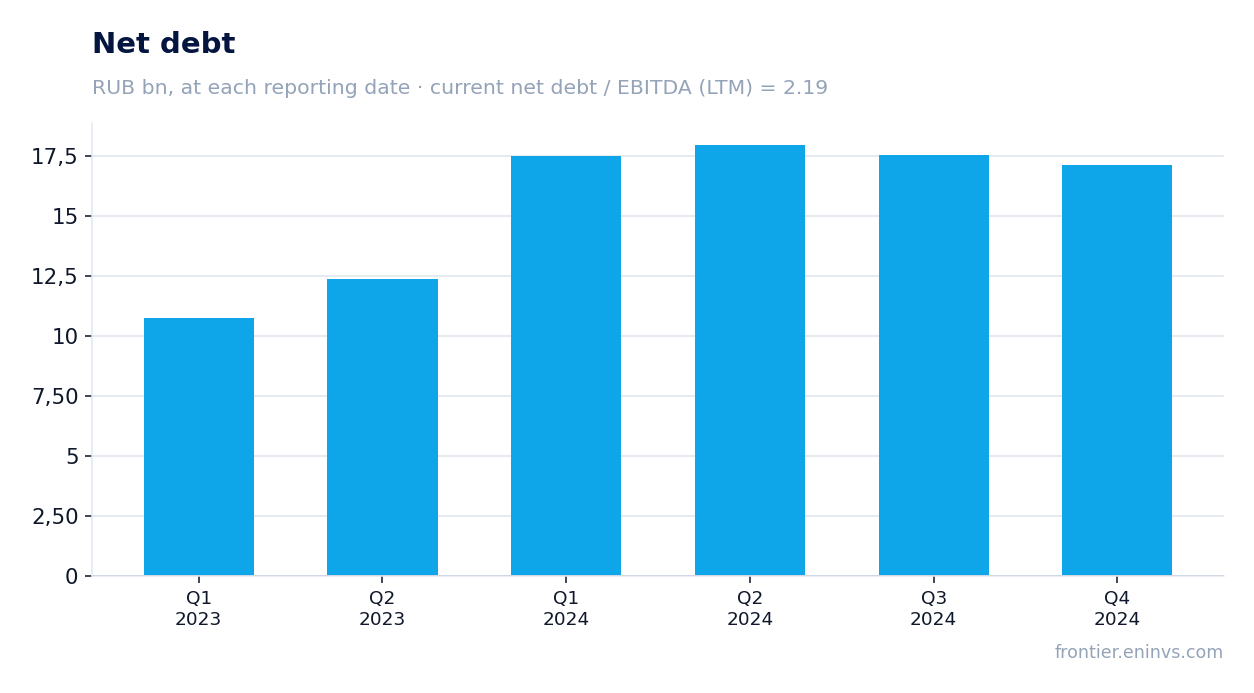
Net debt stood at RUB 16,804.5 mn, with net debt/EBITDA LTM at 2.19
As of June 30, 2025, Promomed's net debt stood at RUB 16,804.5 mn, up RUB 3.8 bn from the previous reporting date and RUB 3.0 bn over the last 12 months. The increase is related to working capital financing and capital expenditures.
Net debt to EBITDA for the last 12 months is 2.19. This is a moderate level for a pharmaceutical company, but it does not account for operating cash flow, which remains negative on a half-year basis. The company plans to refinance short-term debt with new long-term loans.
H1 capex totaled RUB 1,392.5 mn, dividends over 12 months were RUB 8.0 per share
H1 2025 capital expenditures totaled RUB 1,392.5 mn (calculated as 629.4 + 763.1), comparable to the year-earlier level (RUB 1,339.1 mn). The company continues to invest in expanding production capacity and developing new drugs.
Over the last 12 months, Promomed paid dividends of RUB 8.0 per share, corresponding to a dividend yield of 2.1%. At the current share price (RUB 352.2 as of August 17, 2026), the dividend yield is around 2.3% – modest but stable.
Shares fell 18.6% after the report to RUB 352.2 (as of August 17, 2026)
At the time of the report (August 28, 2025), the share price was RUB 432.6, and it fell 0.5% on the release day. In the following months, shares continued to decline: by August 17, 2026, they were at RUB 352.2, down 18.6% from the report date.
The decline reflects investor disappointment with operating cash flow and rising debt, despite strong reported profit figures. Current market capitalization is RUB 84,235 mn, implying P/E LTM of 29.3 and EV/EBITDA LTM of 13.2 – above the average for the Russian pharmaceutical sector.
Valuation on the latest reported figures
| Metric | Value |
|---|---|
| Market cap | 84.2 bn ₽ |
| P/E (LTM) | 29.3 |
| EV/EBITDA (LTM) | 13.2 |
| P/B | 4.29 |
| Net debt / EBITDA (LTM) | 2.19 |
| Operating cash flow (LTM) | 0.82 bn |
| ROE | 13.9% |
| Dividend yield (12m) | 2.0% |
Bottom line
Promomed delivered strong reported results for H1 2025: revenue and EBITDA more than doubled, and net profit reached RUB 1.4 bn. However, behind these figures lies a build-up in working capital: operating cash flow remains negative, and debt increased by RUB 3.8 bn in H1. Investors responded by pushing shares down 18.6% after the report. The key question for holders is whether the company can convert profit into cash in H2 and start reducing debt, or whether growth will continue to require constant debt financing.
Open the company's financial profile PRMD →
See also: market overview · valuation map · stock screeners