Russian IT reports for 1H2026: the sector is growing, and profit depends on who calculates EBITDA
Almost all of the public Russian IT sector reported over the summer: Yandex on 29 July, Positive Technologies on 27 July, VK on 13 August, HeadHunter on 14 August, Astra on 26 August and Softline on 27 August. For comparison we have also added Ozon, CIAN and Whoosh, which reported on 30 July, 19 and 27 August. Below they are all brought into one coordinate system. Along the way we look at how to read such reports yourself: where a company is entitled to show a nice figure and the investor should recalculate.
The main conclusion: the sector is growing faster than the economy, but the gap between the "adjusted EBITDA" in the press release and IFRS operating profit has become so large that comparing companies on multiples without recalculation is no longer possible.
Demand is alive, but customers are saving. HeadHunter's half-year revenue did not grow at all, at Positive renewals fell 2% and expansions 26%, and Softline's industrial customers are postponing projects and asking for longer payment terms.
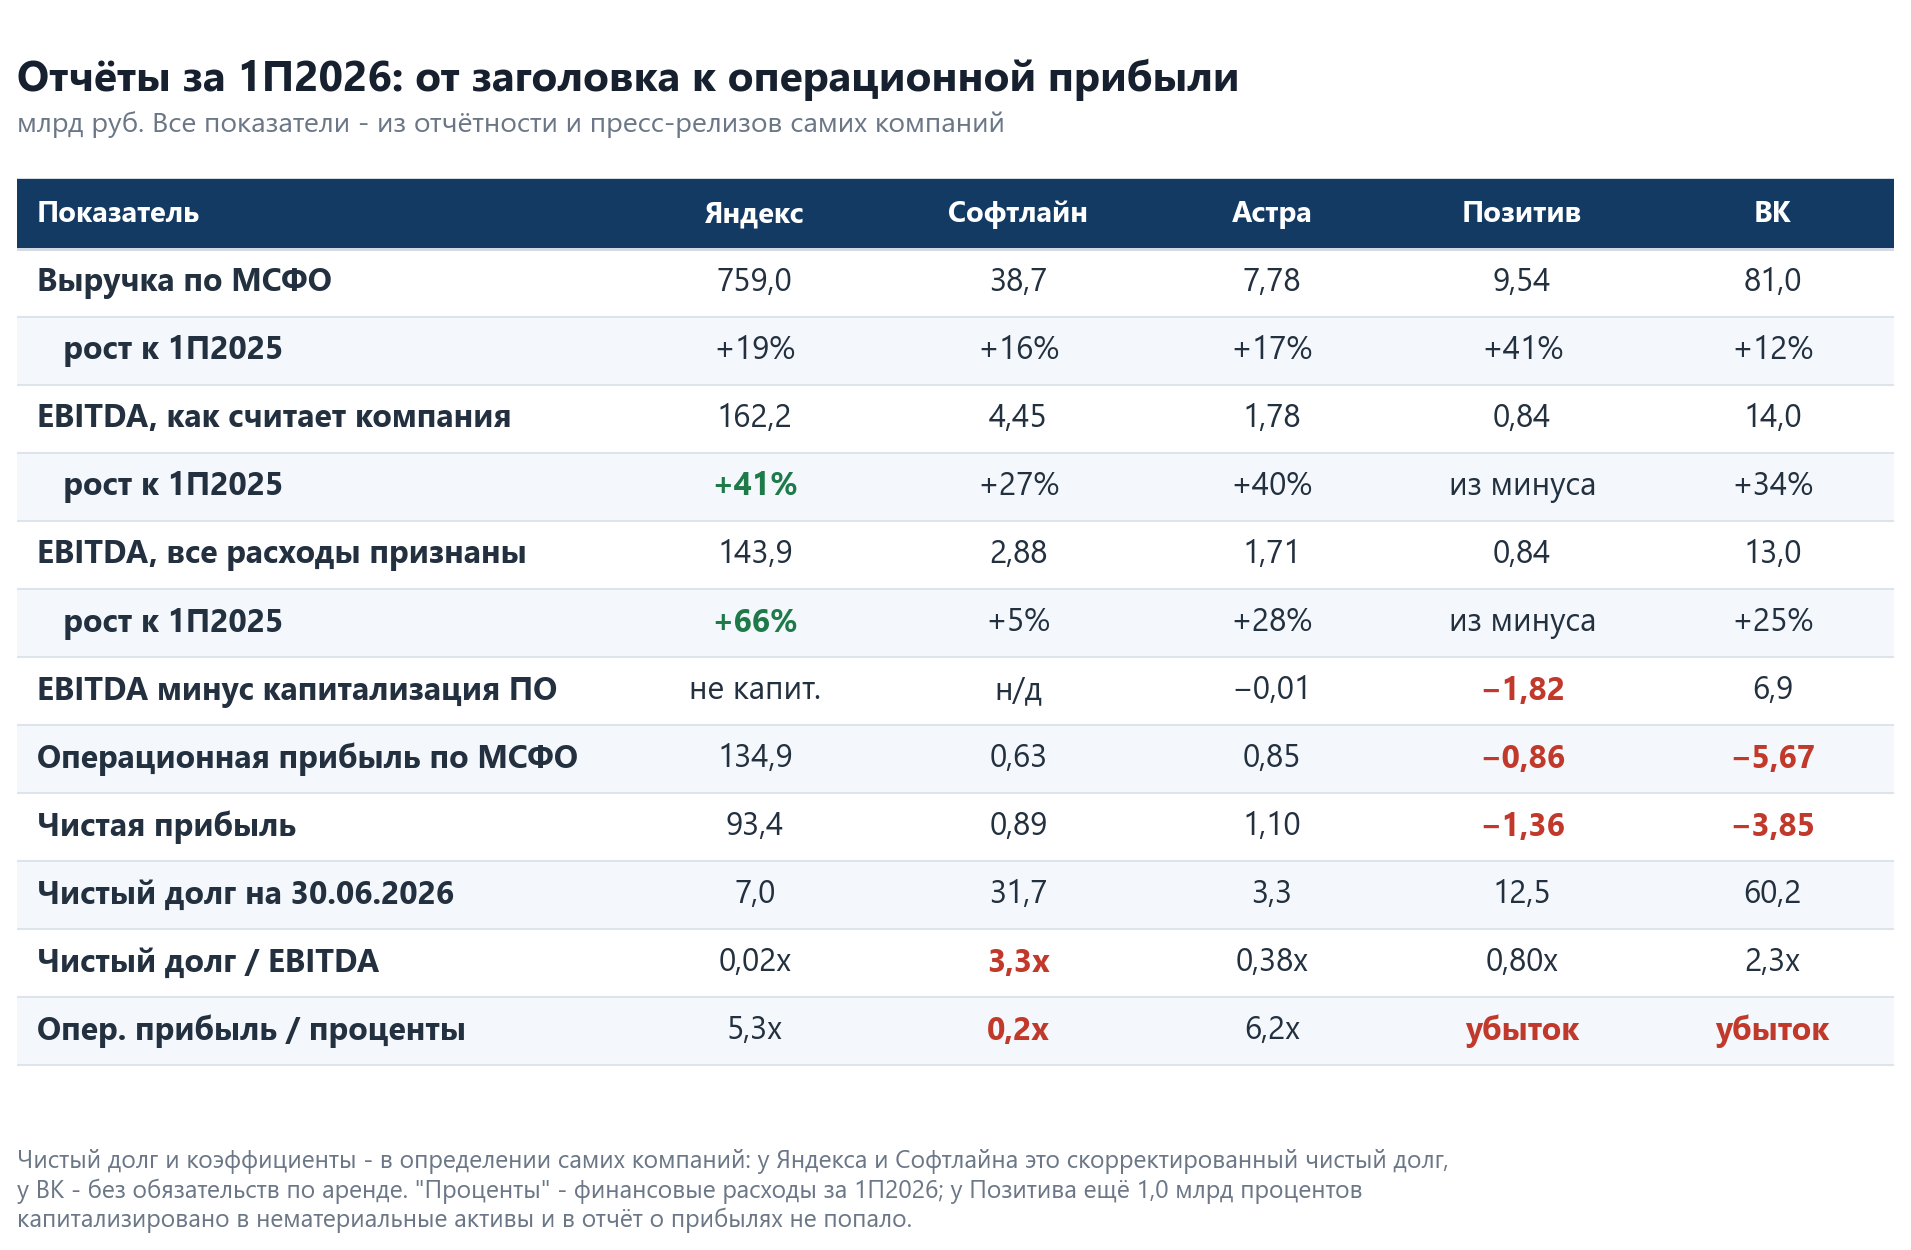
For five of the six companies, headline EBITDA is higher than IFRS EBITDA. For Softline the difference is RUB 1.6 bn for the half-year, for Yandex RUB 18.3 bn, for Ozon RUB 6.5 bn, for VK RUB 1.0 bn, for Astra RUB 74 mn.
Share-based compensation at Positive and Softline is larger than the income statement shows. Positive gave employees 5.18 mn shares, 7.9% of capital, valued at RUB 10.0 bn, while only RUB 96 mn went through the income statement under this programme.
Capitalisation of development is the largest hole in the EBITDA of Russian software. Positive moved RUB 3.0 bn of expenses into intangible assets over the half-year, including RUB 1.0 bn of loan interest. Astra - RUB 1.7 bn, of which 77% is developers' salaries.
After these expenses are recognised, valuation changes severalfold. Astra's EV/EBITDA rises from 5.3x to 10.9x, Positive's from 5.0x to 7.2x, Softline's from 5.8x to 6.4x. At Yandex the gap is minimal, from 4.2x to 4.7x.
Equity dilution adds another multiplier to valuation. At VK, 251 shares now stand in place of every 100, at Softline 143 since the start of 2023.
At Yandex the EBITDA guidance and the revenue guidance have diverged. For EBITDA it is enough to add 13% in the second half. For revenue growth of 21% is needed, while the pace has been falling for the fifth quarter in a row and has dropped from 34% to 16%.
Reaffirmed guidance means little in this sector. Softline reaffirmed its 2025 guidance in November 2025 and closed the year with turnover of RUB 131.9 bn against a promised RUB 150 bn. Positive reaffirmed its shipment plan of RUB 40-50 bn in August 2024 and delivered RUB 24.1 bn. On the median of its guidance, Yandex has a delivery index of 1.02, Softline 0.94, Positive 0.95.
Ozon is growing fastest, but its main risk cannot be counted from the reports. Revenue +48%, EV/EBITDA of 3.7x - the cheapest in the sample. At the same time, from 22 to 24 August drones struck warehouses in six regions, and the shares lost 23.7% in a single session.
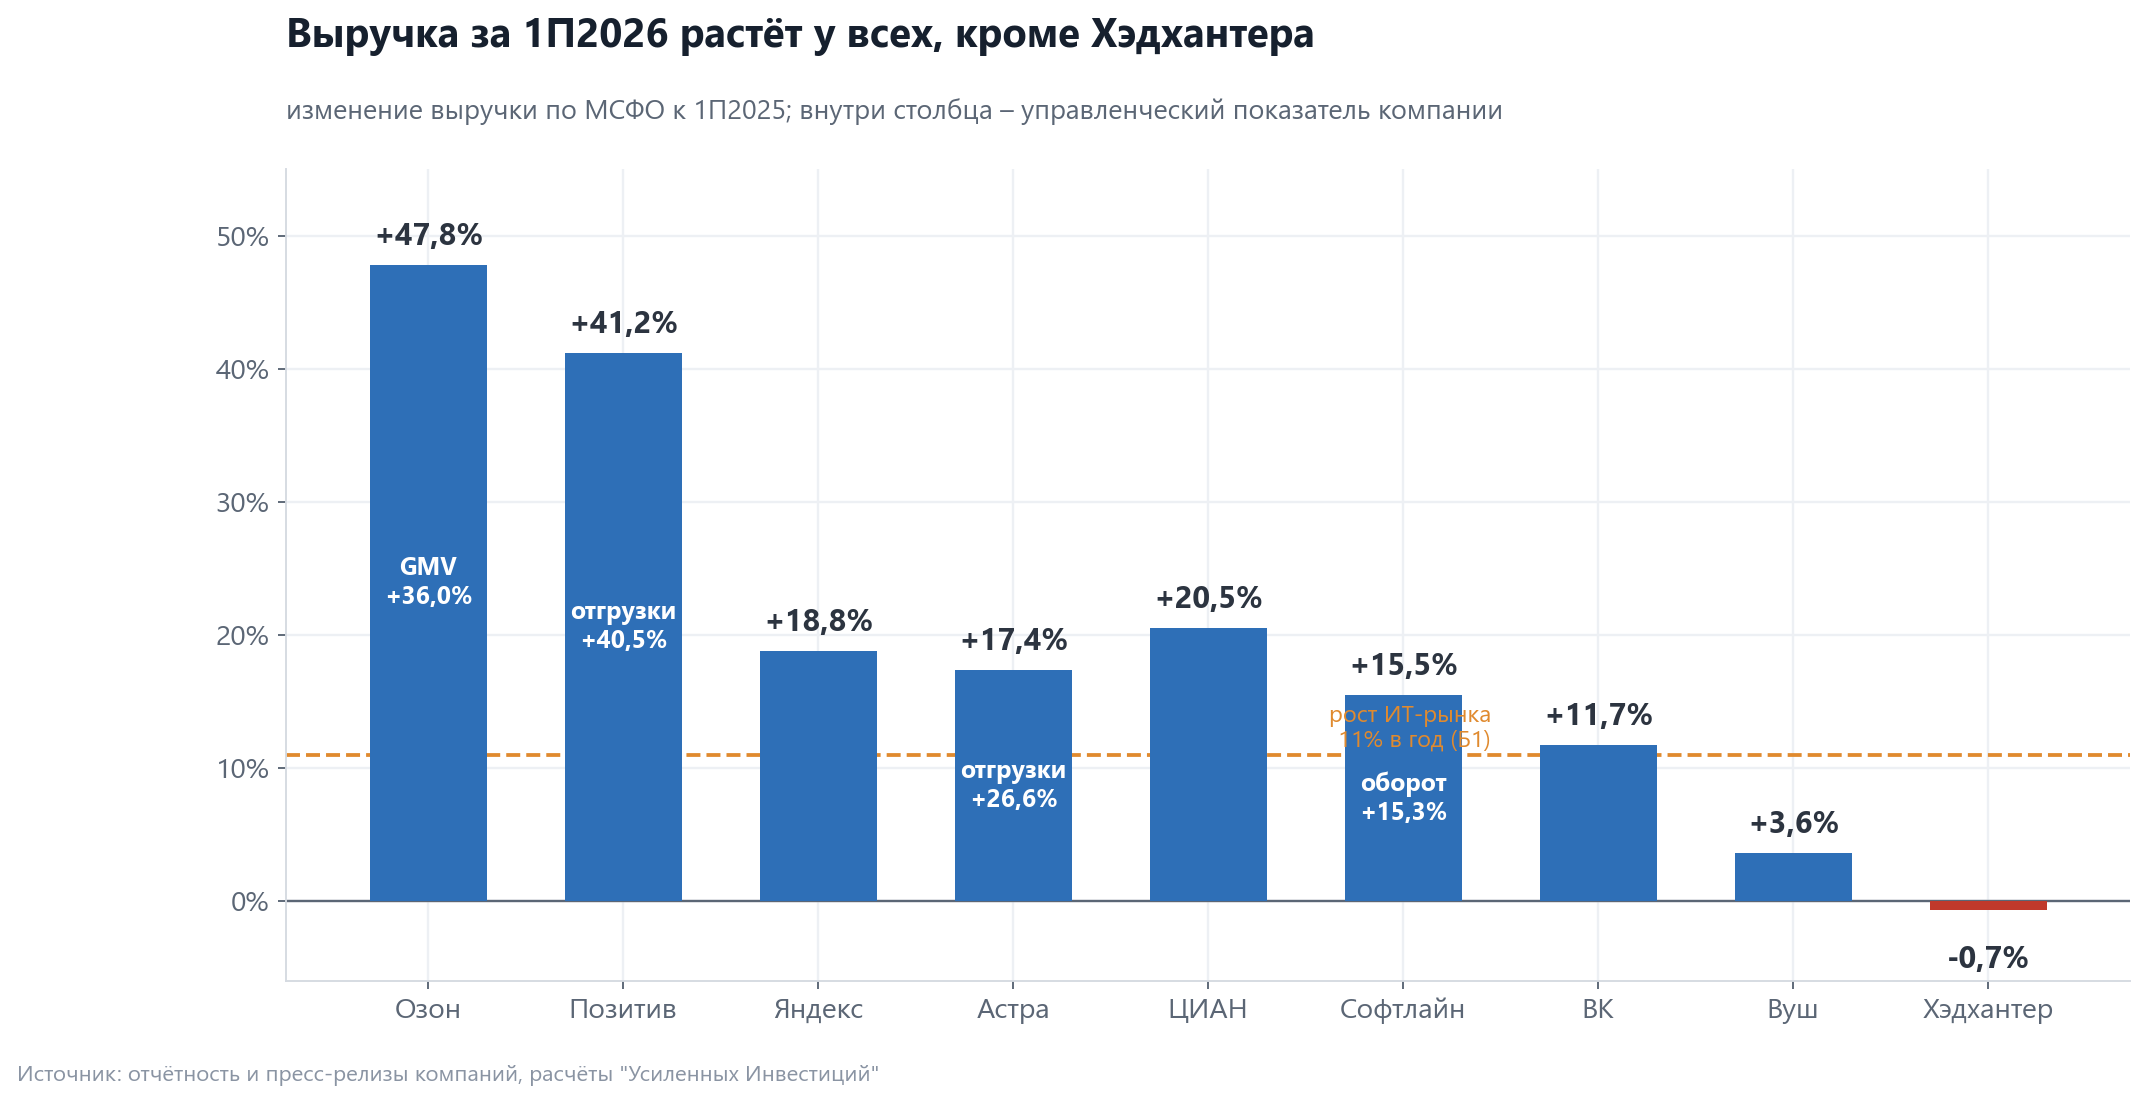
The economy is barely growing while the IT market grows 11% a year - hence all the demand
Russia's GDP grew 0.6% y/y in the first half of 2026, the full-year forecast is 0.4% (Ministry of Economic Development estimate, given in Softline's presentation). The Bank of Russia key rate as of 27 August is 14% per annum.
The commercial IT market is growing at its own pace. According to B1, its volume will grow from RUB 2.4 trn in 2025 to RUB 3.4 trn in 2028, roughly 11% a year. Fastest growth is in clouds (22% a year), software (15%) and information security (13%).
This gap explains double-digit IT revenue growth in a stagnating economy. It also explains the unevenness of growth - where import substitution has taken place, the head start is ending.
Customers' savings show up in the deal structure earlier than in revenue
Revenue is a lagging indicator: last year's contract is recognised this year. The structure of new deals, payment terms and hiring react earlier than revenue.
HeadHunter is the cleanest indicator. The company earns on vacancy postings, so its revenue reflects employers' willingness to hire. In 2Q2026 revenue was RUB 10,149 mn, exactly the same as a year earlier; for the half-year RUB 19.6 bn vs RUB 19.8 bn. The 2026 guidance was lowered from growth of 8% to the 2025 level. Profitability is still above 50%, and the dividend for the half-year is RUB 200 per share.
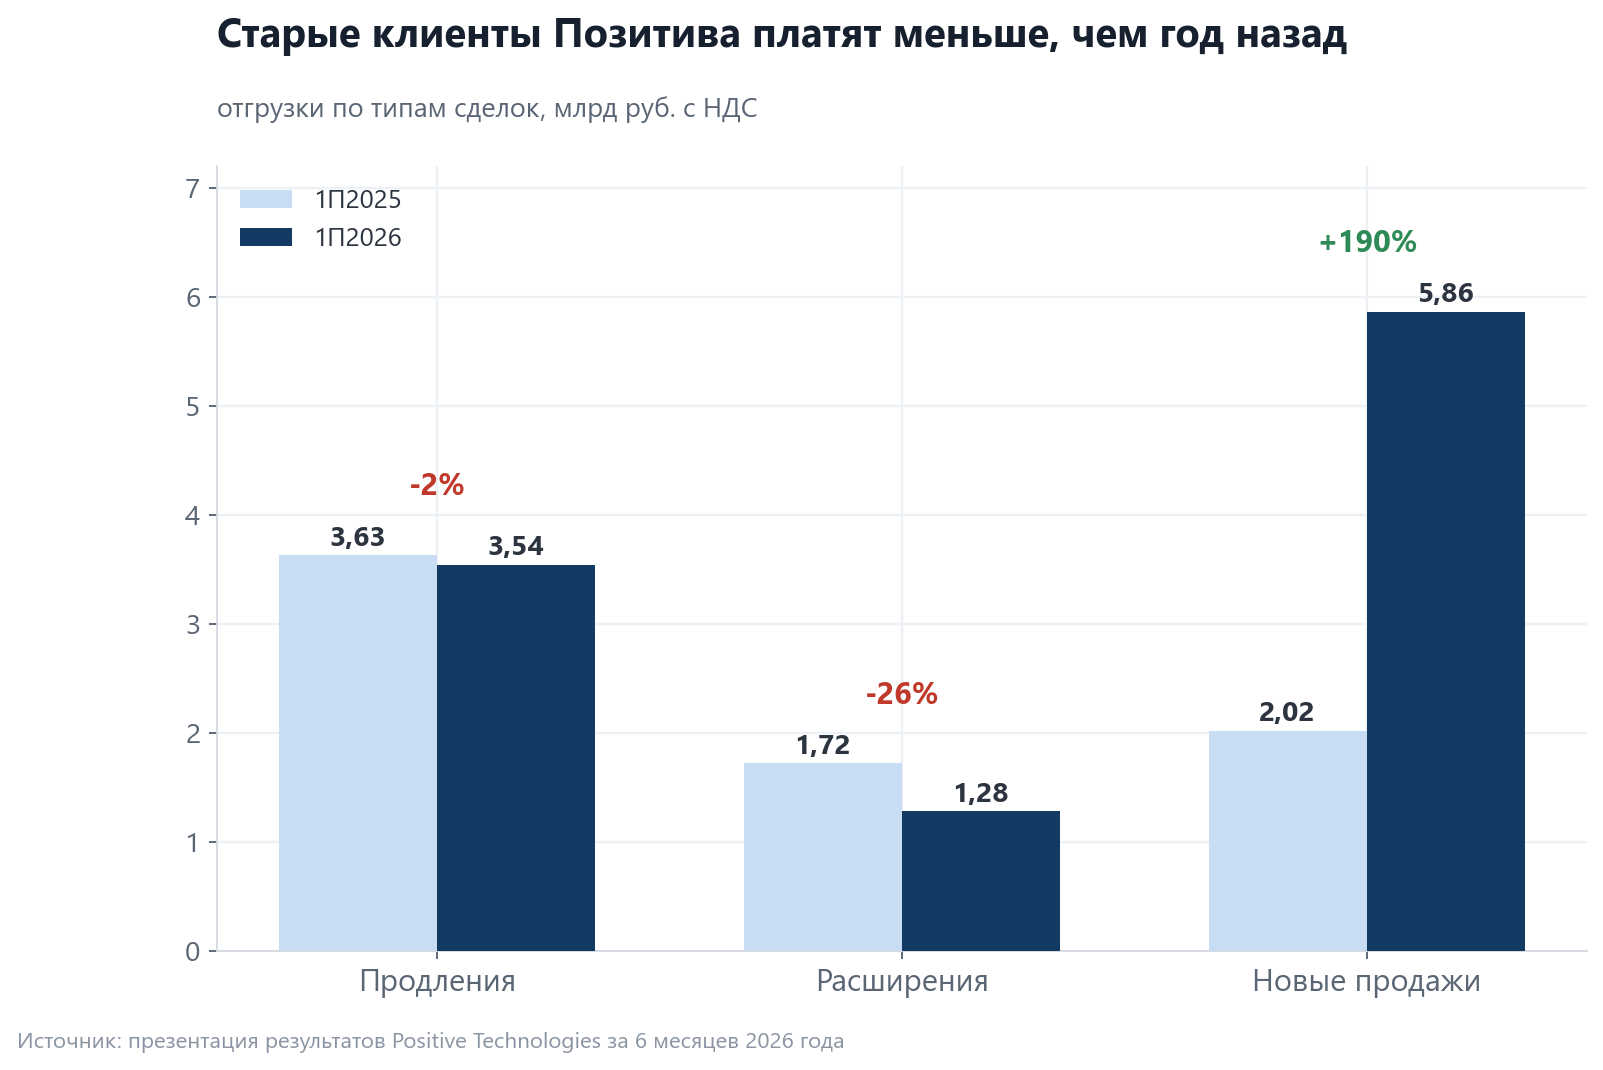
At Positive all the growth came from new customers, while old ones began paying less. Shipments grew 45%, to RUB 10.7 bn including VAT, but renewals fell from 3.63 to 3.54 bn and expansions from 1.72 to 1.28 bn, by 26%. The entire gain came from new sales, RUB 5.86 bn vs RUB 2.02 bn, mainly thanks to the PT NGFW firewall. Renewal and expansion are the money of the existing base; when they do not grow, the company lives on a new product rather than on growth in customers' budgets.
At Softline customers' savings are named directly. The "SF Tech" cluster cut turnover from RUB 4.9 bn to RUB 3.2 bn because of "persistently more restrained budgets of industrial customers" and postponed projects. Separately it is noted that net debt rose in part because of "a request from a number of customers to extend payment terms". A payment deferral is a loan the supplier gives the customer, and at a 14% key rate it is expensive.
CIAN and Whoosh are two reactions to weak demand. CIAN's revenue grew 20.5%, to RUB 8.3 bn, in a non-growing property market - thanks to price and the auction model in lead generation. Operating expenses in the second quarter rose only 7.2%, so adjusted EBITDA grew 68.2%, to RUB 2.72 bn, margin from 23.4% to 32.7%, and half-year profit doubled to RUB 2.05 bn.
Whoosh is the opposite case. Half-year revenue was RUB 5.56 bn, growth of 4%, and in Russia and the CIS it did not grow at all, with all the gain coming from Latin America (RUB 1.13 bn, plus 22%). Company-defined EBITDA grew 43%, to RUB 1.44 bn, but this is a result of cost cuts, not of demand: under IFRS EBITDA is RUB 0.97 bn, and the net loss for the half-year is RUB 1.77 bn. Debt remains heavy - RUB 13.1 bn at the end of 2025 against EBITDA of RUB 3.56 bn, that is 3.7x.
Almost everyone is cutting headcount. Softline has 10,046 employees vs 11,130 a year earlier, Positive 2.6 thousand vs 3.2 thousand at the end of 2024. Astra's headcount rose from 2,741 to 2,844.
Each company builds "adjusted EBITDA" by its own rules, and the rules do not match
EBITDA is profit before interest, taxes and amortisation: the operating result separate from the financing structure and past investment. The word "adjusted" means the company has added its own adjustments. They can be justified, but they have to be checked every time.
In the 1H2026 reports there are three typical divergences. None of them is a violation of standards. All three change the result by tens of percent.
One-off expenses stop being one-off when they repeat every year
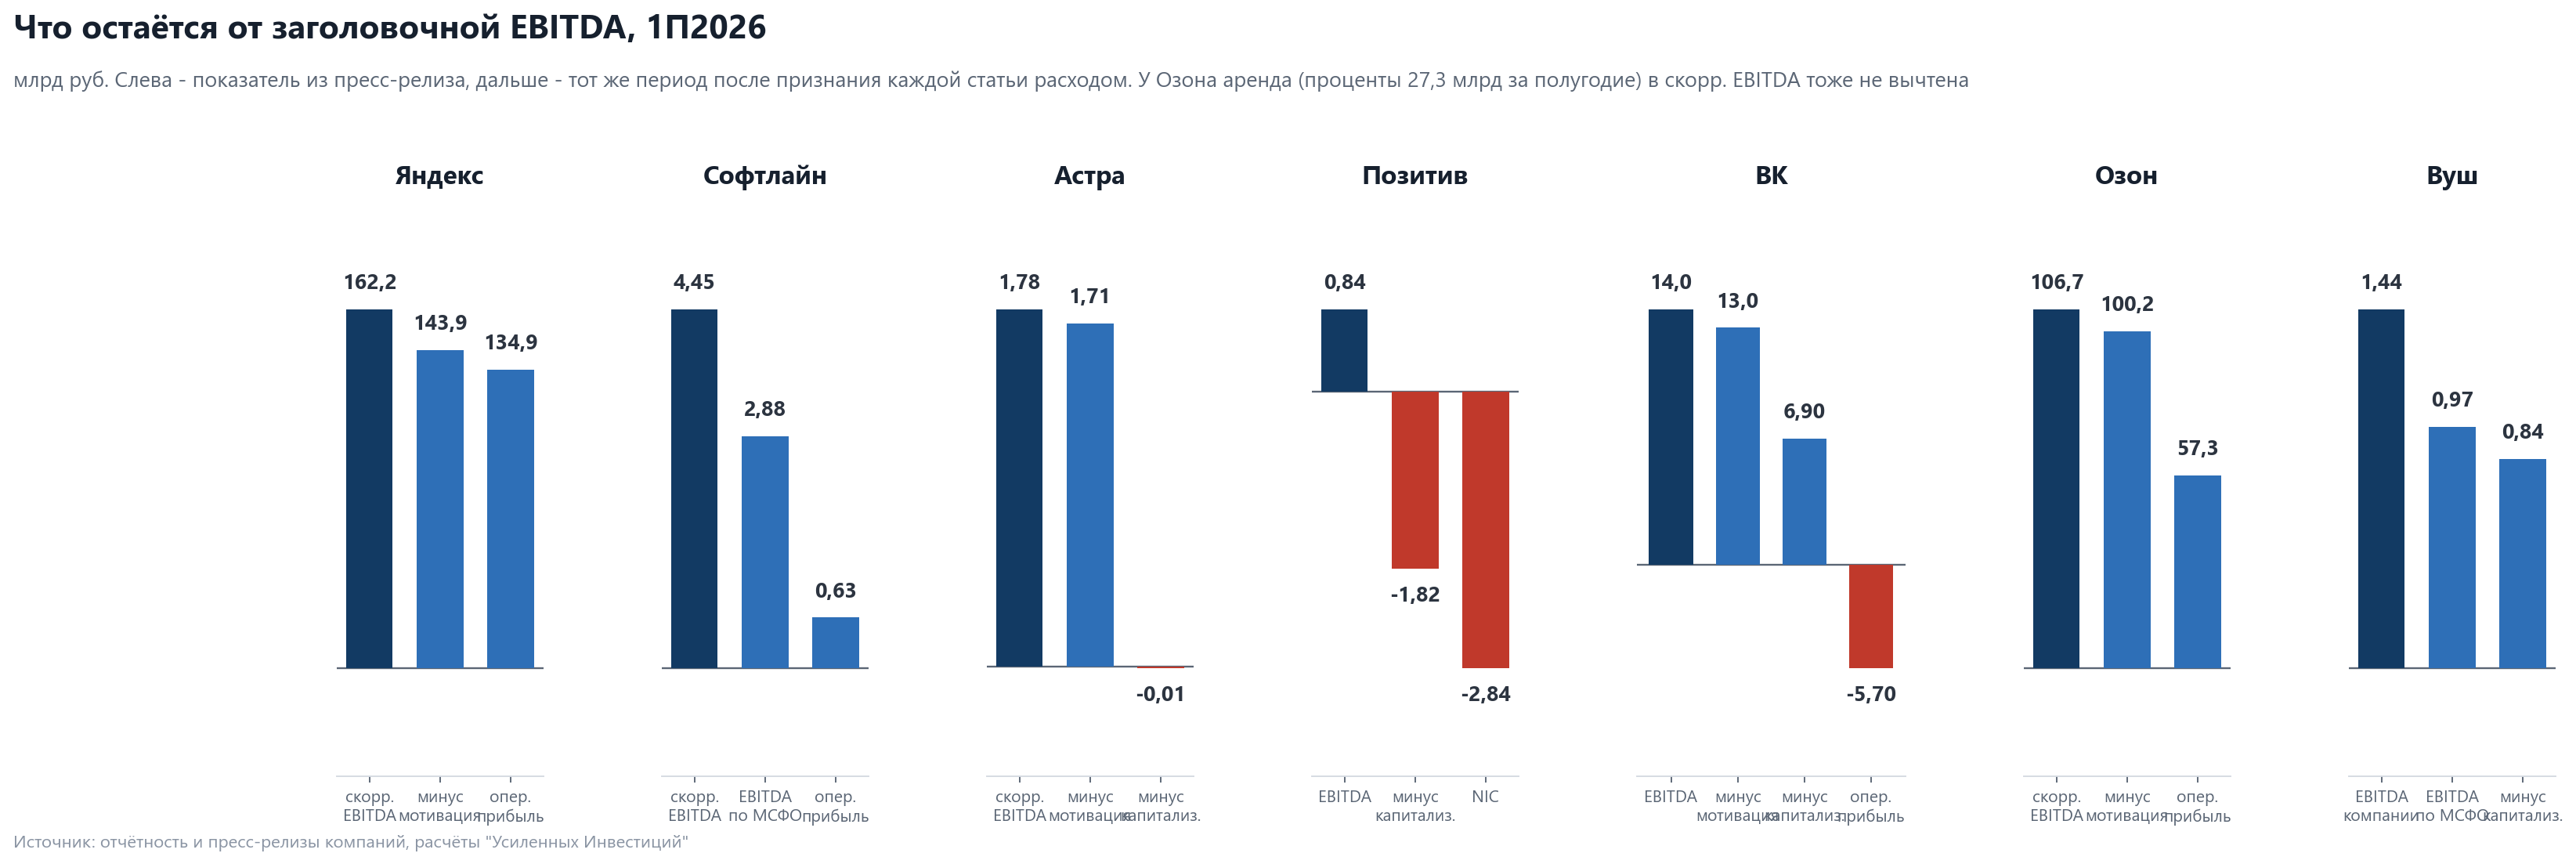
Softline reported growth in adjusted EBITDA of 27%, to RUB 4.449 bn. In the bridge from net profit to this indicator published by the company there is a line "one-off expenses": severance payments, bond issue costs, penalties, subsidiary acquisition costs. For 1H2026 it was RUB 1,500 mn vs RUB 414 mn a year earlier, next to it is a line "other income and expenses" for another RUB 218 mn.
If we look at the same period under IFRS, the picture is different. Operating profit plus amortisation gives RUB 2,883 mn vs RUB 2,743 mn a year earlier - growth of 5%, not 27%. IFRS operating profit itself fell from RUB 719 mn to RUB 632 mn, which is minus 12%. The difference between "plus 27%" and "minus 12%" lies entirely in which items are treated as the norm and which as the exception.
Severance payments at a company that is cutting staff for the third year in a row do not look like an exception. The test is simple. If a "one-off" line has been in the bridge four years running, it is an ordinary expense.
Share-based compensation is a real expense, even when it costs no cash
Incentive programmes give employees shares. The company does not pay in cash, the expense is non-cash, and it is convenient to exclude from adjusted profit. But the shareholder pays for it with their stake.
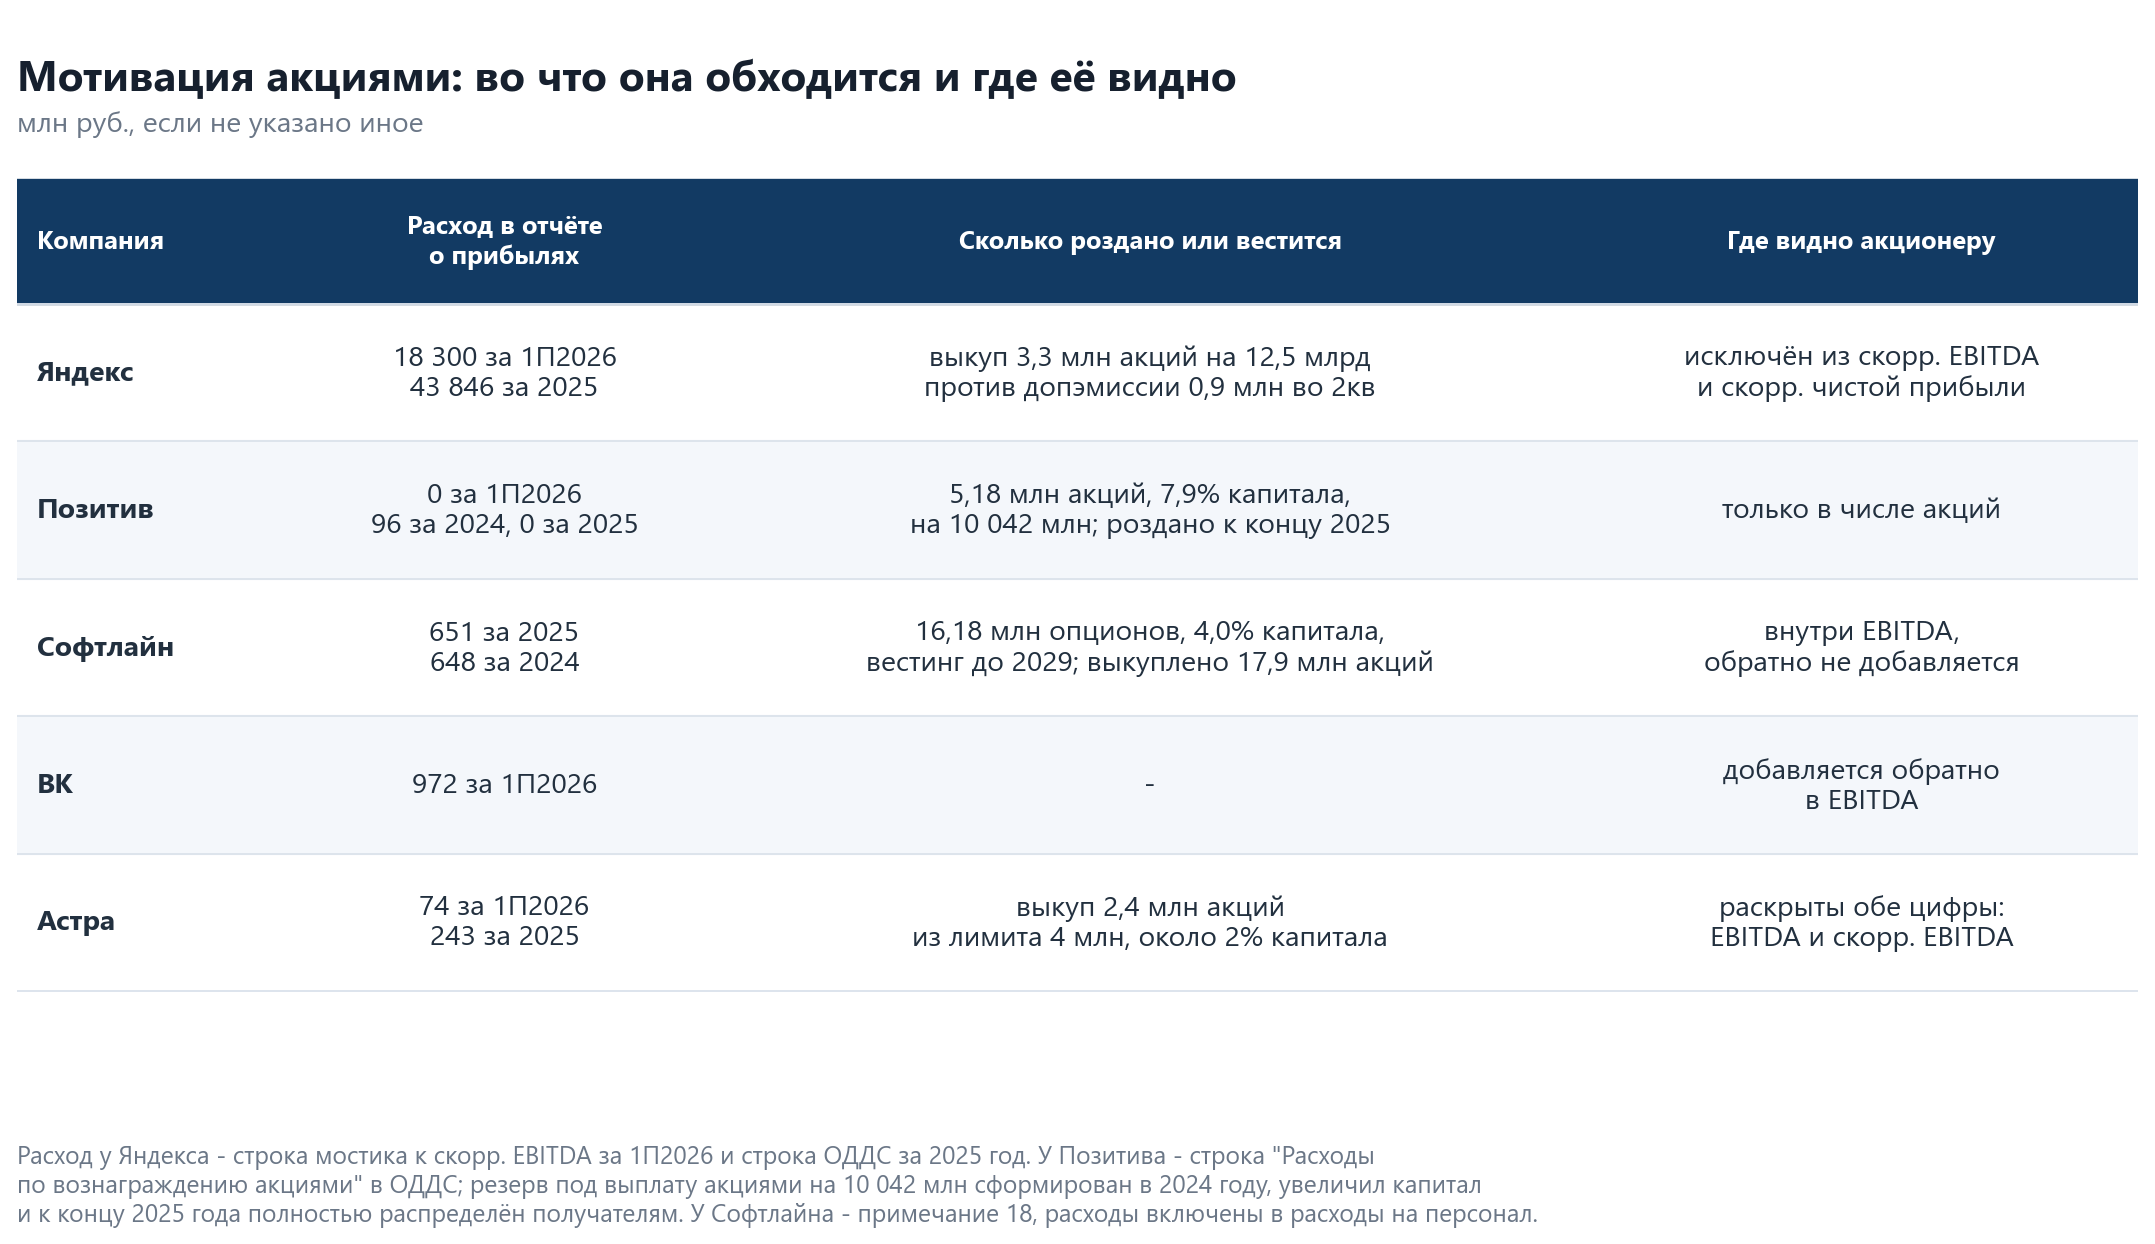
Yandex excludes share-based compensation from adjusted EBITDA. For 1H2026 this is RUB 18.3 bn vs RUB 28.0 bn a year earlier, and RUB 162.2 bn turns into RUB 143.9 bn. The gap is noticeable, but it is disclosed as a line in the bridge, and development is expensed. In addition, Yandex deducts from EBITDA the amortisation and interest on operating leases - a rare case where the adjustment makes the indicator worse.
The largest programme in the sector relative to the size of the business is at Positive, and it is not in the income statement. Under the Growth Incentive Programme the company distributed 5,180,000 shares, 7.9% of capital, valued at RUB 10,041,948 thousand at a price of RUB 1,938.6 on the approval date. The reserve was created in 2024, increased the Group's equity and was fully distributed to recipients by the end of 2025.
Incomparably less went through the income statement. The cash flow statement line "Share-based compensation expense" is RUB 96,250 thousand for 2024, and for 2025 and for the first half of 2026 there is no such line at all. Positive's 2025 EBITDA is RUB 12.3 bn. Compensation of almost a year's EBITDA did not touch EBITDA, EBITDAC or profit. It was paid by the shareholder with their stake.
At Softline the compensation is recognised as an expense, but its size is visible in the options note, not in the income statement. Under two programmes, RUB 651 mn was included in personnel expenses for 2025 (RUB 648 mn for 2024). This is inside EBITDA and is not added back in the bridge - here the company acts correctly. But at 31 December 2025, 16,178,374 options were unexercised, about 4% of capital, vesting through 2029 with an exercise price of RUB 0.0015. It is offset by buybacks: over 2024-2025, 17.9 mn shares were repurchased for RUB 1.84 bn.
VK excludes share-based payments of RUB 0.97 bn from EBITDA. Revenue of RUB 81.0 bn minus operating expenses of RUB 68.0 bn gives RUB 13.0 bn, while RUB 14.0 bn is stated.
Astra does the opposite and shows both figures. IFRS EBITDA for 1H2026 is RUB 1,711 mn, adjusted for share-based compensation RUB 1,785 mn. In last year's base the compensation line was reversed by RUB 59 mn, because of which adjusted EBITDA grew 40% while ordinary EBITDA grew 28%. The difference in growth rates was created not by the business but by a sign in the comparison base. Astra's compensation is effectively cash. RUB 243 mn was accrued for 2025, and shares for a comparable amount were bought back from the market.
Capitalisation of development is the largest hole, and it is legal
Under IAS 38, product development costs can be recognised as an asset if the product is technically feasible and will bring benefit. The programmer's salary then does not go into the period's expenses but lands on the balance sheet as an intangible asset and is amortised over several years.
The money, however, leaves the account immediately. EBITDA does not see it: there is no expense in the income statement, and by definition EBITDA does not count amortisation. The expense drops out twice, and for a software company this makes EBITDA almost meaningless.
The cure is the EBITDAC indicator - EBITDA minus capitalised development. It puts the expense back and shows how much cash is left after the business has paid its own developers.
Positive calculates EBITDAC itself and publishes it in its presentation. For 1H2026 the company's EBITDA turned positive and came to RUB 0.84 bn vs a loss of RUB 2.48 bn a year earlier. Capitalised expenses for the same period are RUB 3.03 bn, so EBITDAC remains negative at minus RUB 1.82 bn vs minus RUB 5.78 bn a year earlier. The company is heading to break-even but has not reached it yet.
The composition of what is capitalised matters more than its size. The note to Positive's statements says that over the half-year personnel expenses of RUB 2,528.6 mn, professional services of RUB 61.5 mn, certification of RUB 11.0 mn and interest expenses of RUB 1,003.6 mn were transferred to intangible assets. That is, more than half of the interest accrued on loans did not reach the income statement - it shows RUB 940.7 mn, while another RUB 1,003.6 mn went onto the balance sheet. Neither EBITDA nor net profit saw this billion.
At Astra capitalisation eats all of EBITDA. Capitalised costs for 1H2026 are RUB 1,721 mn against IFRS EBITDA of RUB 1,711 mn. EBITDAC comes out at about zero, minus RUB 10 mn vs minus RUB 393 mn a year earlier. The company itself discloses that 77% of what is capitalised is the salaries of IT specialists engaged in new product development.
At the same time Astra's IFRS operating profit is positive, RUB 845 mn, and there is no contradiction here. It deducts amortisation of previously capitalised items (RUB 893 mn), while EBITDAC deducts current capitalisation (RUB 1,721 mn). The difference is investment in growth that has not yet begun to be amortised. EBITDAC shows the cash picture, operating profit the accounting one.
At VK amortisation has already caught up and overtaken. For 1H2026, depreciation and amortisation were RUB 18.7 bn against EBITDA of RUB 14.0 bn. The IFRS operating result is a loss of RUB 5.7 bn, the net loss is RUB 3.85 bn (RUB 12.67 bn a year earlier). The difference between EBITDA and the loss at VK is hidden by nothing. It is entirely in the amortisation of past investment.
Ozon has the same logic, only with leases instead of development. Adjusted EBITDA for the half-year is RUB 106.7 bn, plus 49% y/y. Neither share-based compensation (RUB 6.5 bn for the half-year vs zero a year earlier) nor the cost of warehouse leases has been deducted from it: lease liabilities at 30 June are RUB 372 bn, and RUB 27.3 bn of interest on them was paid over the half-year. After recognising the compensation, RUB 100.2 bn remains, and IFRS operating profit, which already includes warehouse amortisation, is RUB 57.3 bn. Net profit is RUB 14.6 bn vs a loss of RUB 7.5 bn a year earlier.
A separate feature of Ozon is that a third of EBITDA is made by Fintech: RUB 36.7 bn of RUB 106.7 bn for the half-year, and its interest revenue is not excluded from the calculation. The EBITDA multiple includes a bank that is better valued on equity. Group equity is negative, minus RUB 154 bn.
Not everyone meets guidance, and seasonality does not explain everything
For Russian software, the bulk of revenue falls in the fourth quarter: customers' budgets close in December, and annual licences are renewed then. At Astra the second half historically accounts for 67-81% of annual revenue, at Positive about half of shipments fall in the fourth quarter. So the share of the plan completed over the half-year says nothing by itself. What matters is the growth required in the second half relative to the same period last year.
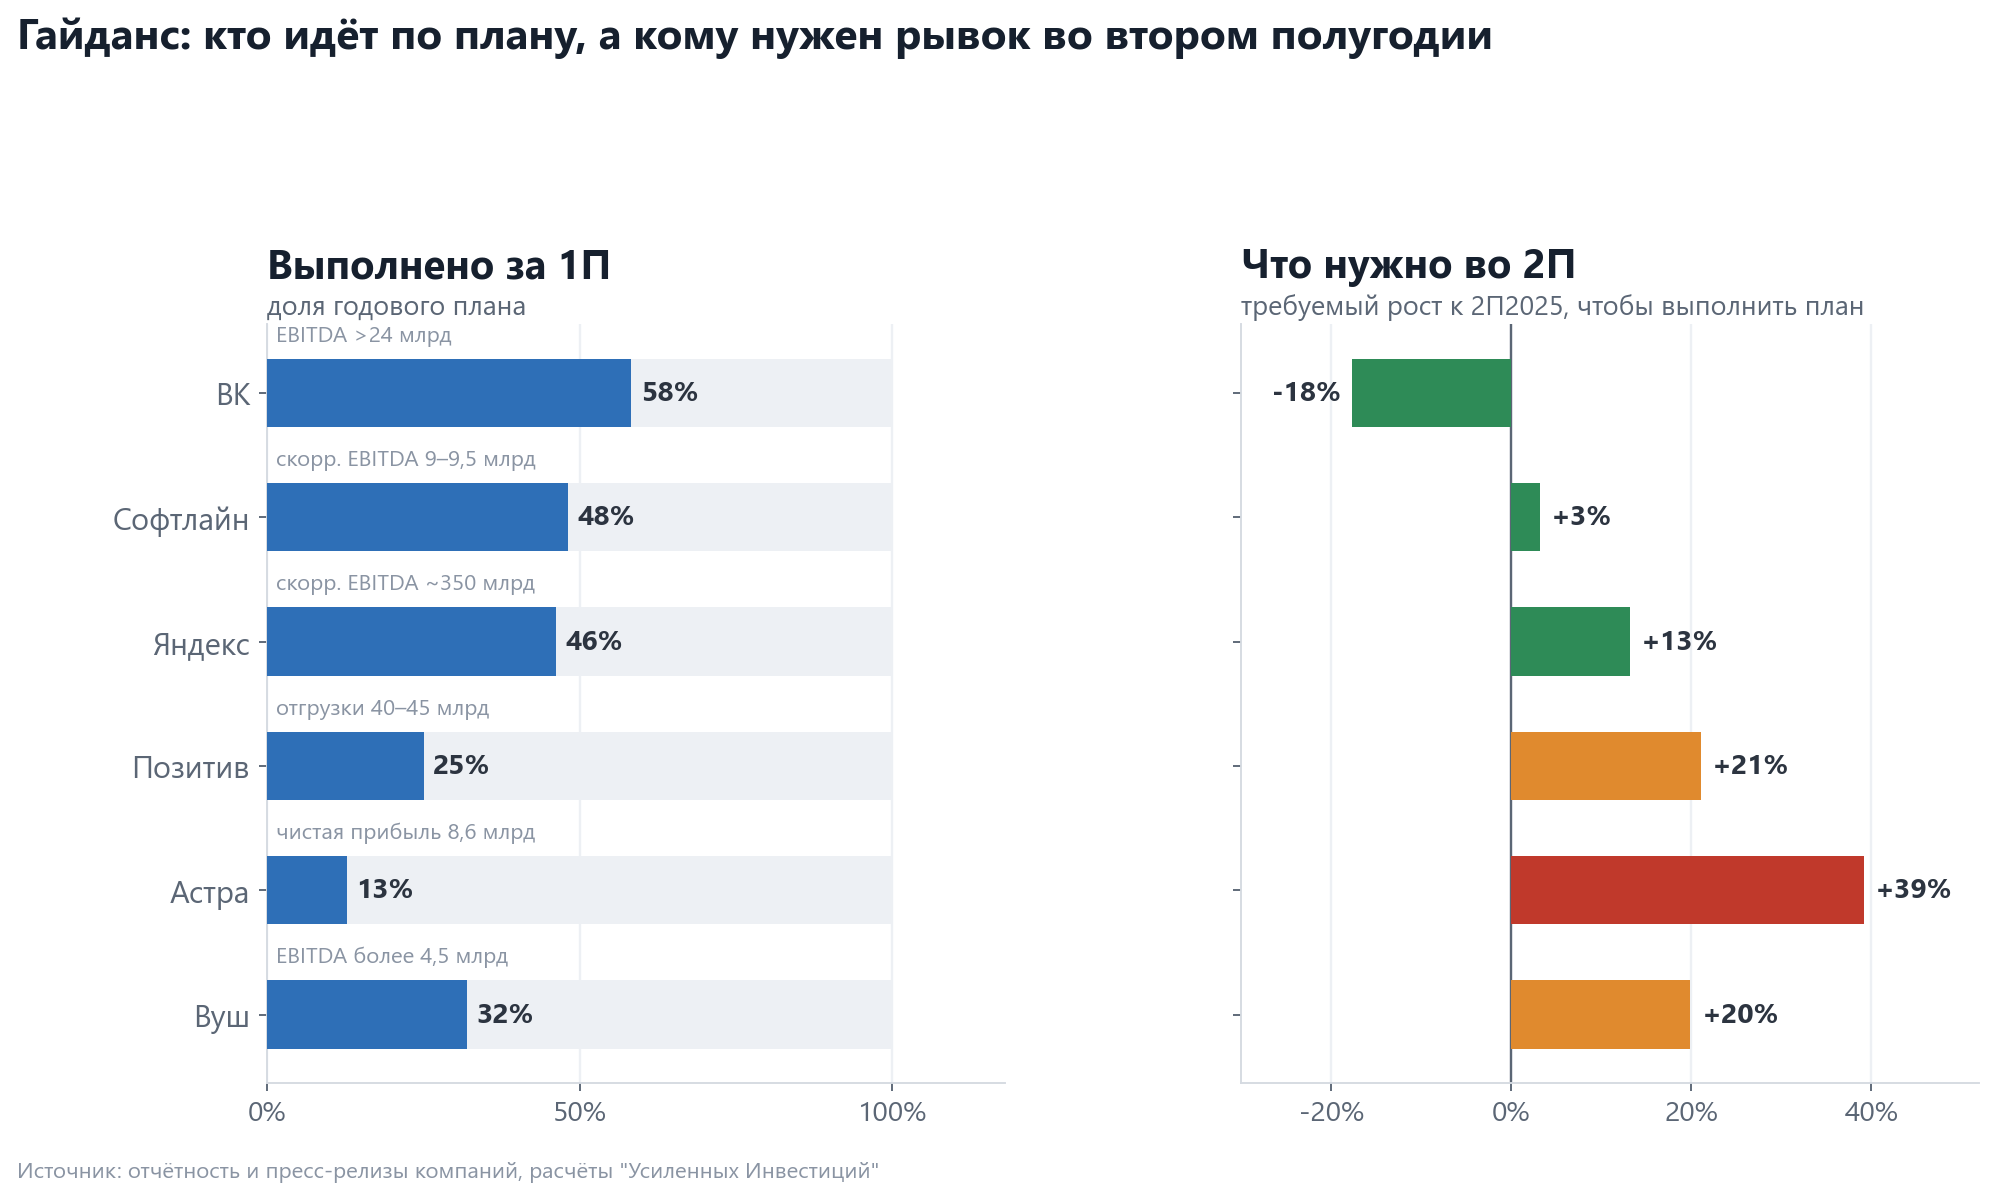
At Yandex the two halves of guidance go in different directions. The 2026 guidance is confirmed: revenue growth of about 20% and adjusted EBITDA of about RUB 350 bn. On EBITDA there is a margin - the second half needs RUB 187.8 bn vs RUB 165.9 bn a year earlier, plus 13%.
On revenue the situation is the opposite, and this is the main question for Yandex's guidance. Growth has been slowing for the fifth quarter in a row: 34% in the first quarter of 2025, 33% in the second, 32% in the third, 28% in the fourth, 22% in the first quarter of 2026 and 16% in the second. For the half-year it came to 19%. For the year to close with 20% growth, second-half revenue must grow 21% - that is, the pace must not just stop falling but turn up and add five percentage points to the last quarter.
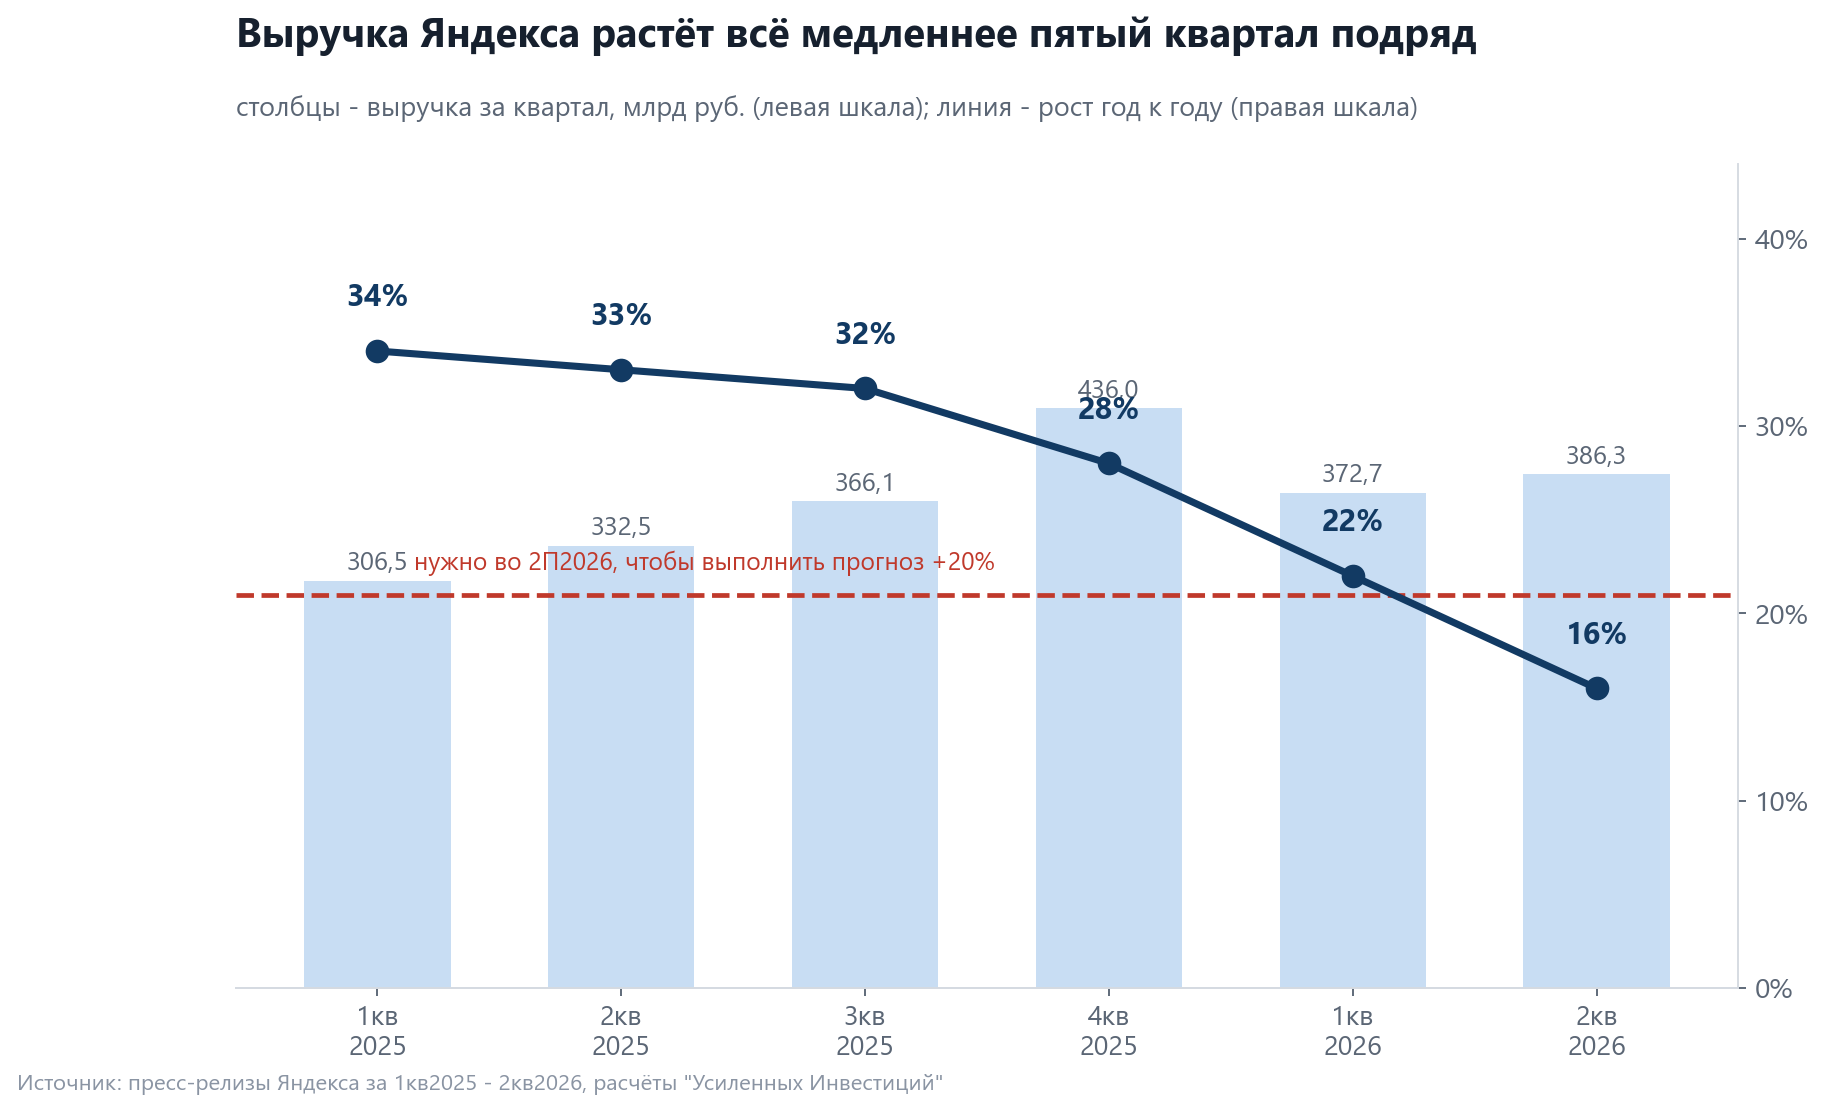
Three factors work against a turn. Advertising and promotion grow 10.3% in the second quarter, slower than the group. From 2 June 2026 the Auto.ru figures were excluded from the group without restating past periods. And the comparison base is not low: in the second half of 2025 revenue grew 30%.
The slowdown comes from the core of the business, not the periphery. The "Search and AI" segment, which makes the group its main profit, added 4% in the first half of 2026: RUB 260.0 bn vs RUB 249.8 bn. In the second quarter growth is 9%, which means that in the first quarter the segment's revenue was 0.7% below last year's. Growth for the group comes from urban and personal services, plus 18% and 31%, but their profitability is different: 13.1% and 2.6% vs 44.8% for search. Every percent of revenue that moved from search to urban services brings the group three times less EBITDA.
VK set itself a low bar. The guidance is EBITDA above RUB 24 bn for 2026, RUB 14.0 bn already for the half-year, and the second half needs only RUB 10.0 bn vs RUB 12.2 bn a year earlier.
Softline reaffirmed guidance, but the promise on debt looks hard. Guidance for 2026: turnover of RUB 145-155 bn, gross profit RUB 30-35 bn, adjusted EBITDA RUB 9-9.5 bn. On EBITDA RUB 4.449 bn is done for the half-year, the second needs about RUB 4.8 bn vs RUB 4.65 bn a year earlier. This is achievable. Debt is harder. The company promises a ratio of net debt to adjusted EBITDA of no more than 2.0x at year-end, and at 30 June it is 3.3x. To keep within it, net debt must fall from RUB 29.7 bn to roughly RUB 18-19 bn, while in the second half of 2025 it fell by only RUB 3.3 bn. The company also changed its gross profit methodology from the first quarter of 2026 and lowered its guidance for it from RUB 50-55 bn to RUB 30-35 bn, so this indicator is no longer comparable with past publications.
Positive needs a strong fourth quarter, but it always has one. The shipment guidance is RUB 40-45 bn, RUB 10.7 bn for the half-year; the second needs about RUB 31.8 bn vs RUB 26.3 bn a year earlier. For the third quarter RUB 6.75 bn is stated.
Astra needs the strongest push. Management's guide for 2026 net profit is about RUB 8.6 bn, RUB 1.10 bn received for the half-year. The second needs about RUB 7.5 bn vs RUB 5.4 bn a year earlier, plus 39%, and there is no margin: the first quarter had a loss of RUB 752 mn.
HeadHunter has already lowered its guidance - and this is the only explicit downward revision in the sector over the reporting season.
The word "reaffirm" guarantees nothing: half of the guidance of past years was not met
Guidance in a press release is management's expectation, not an obligation. Over the last two years expectations diverged from fact in both directions, by tens of percent.
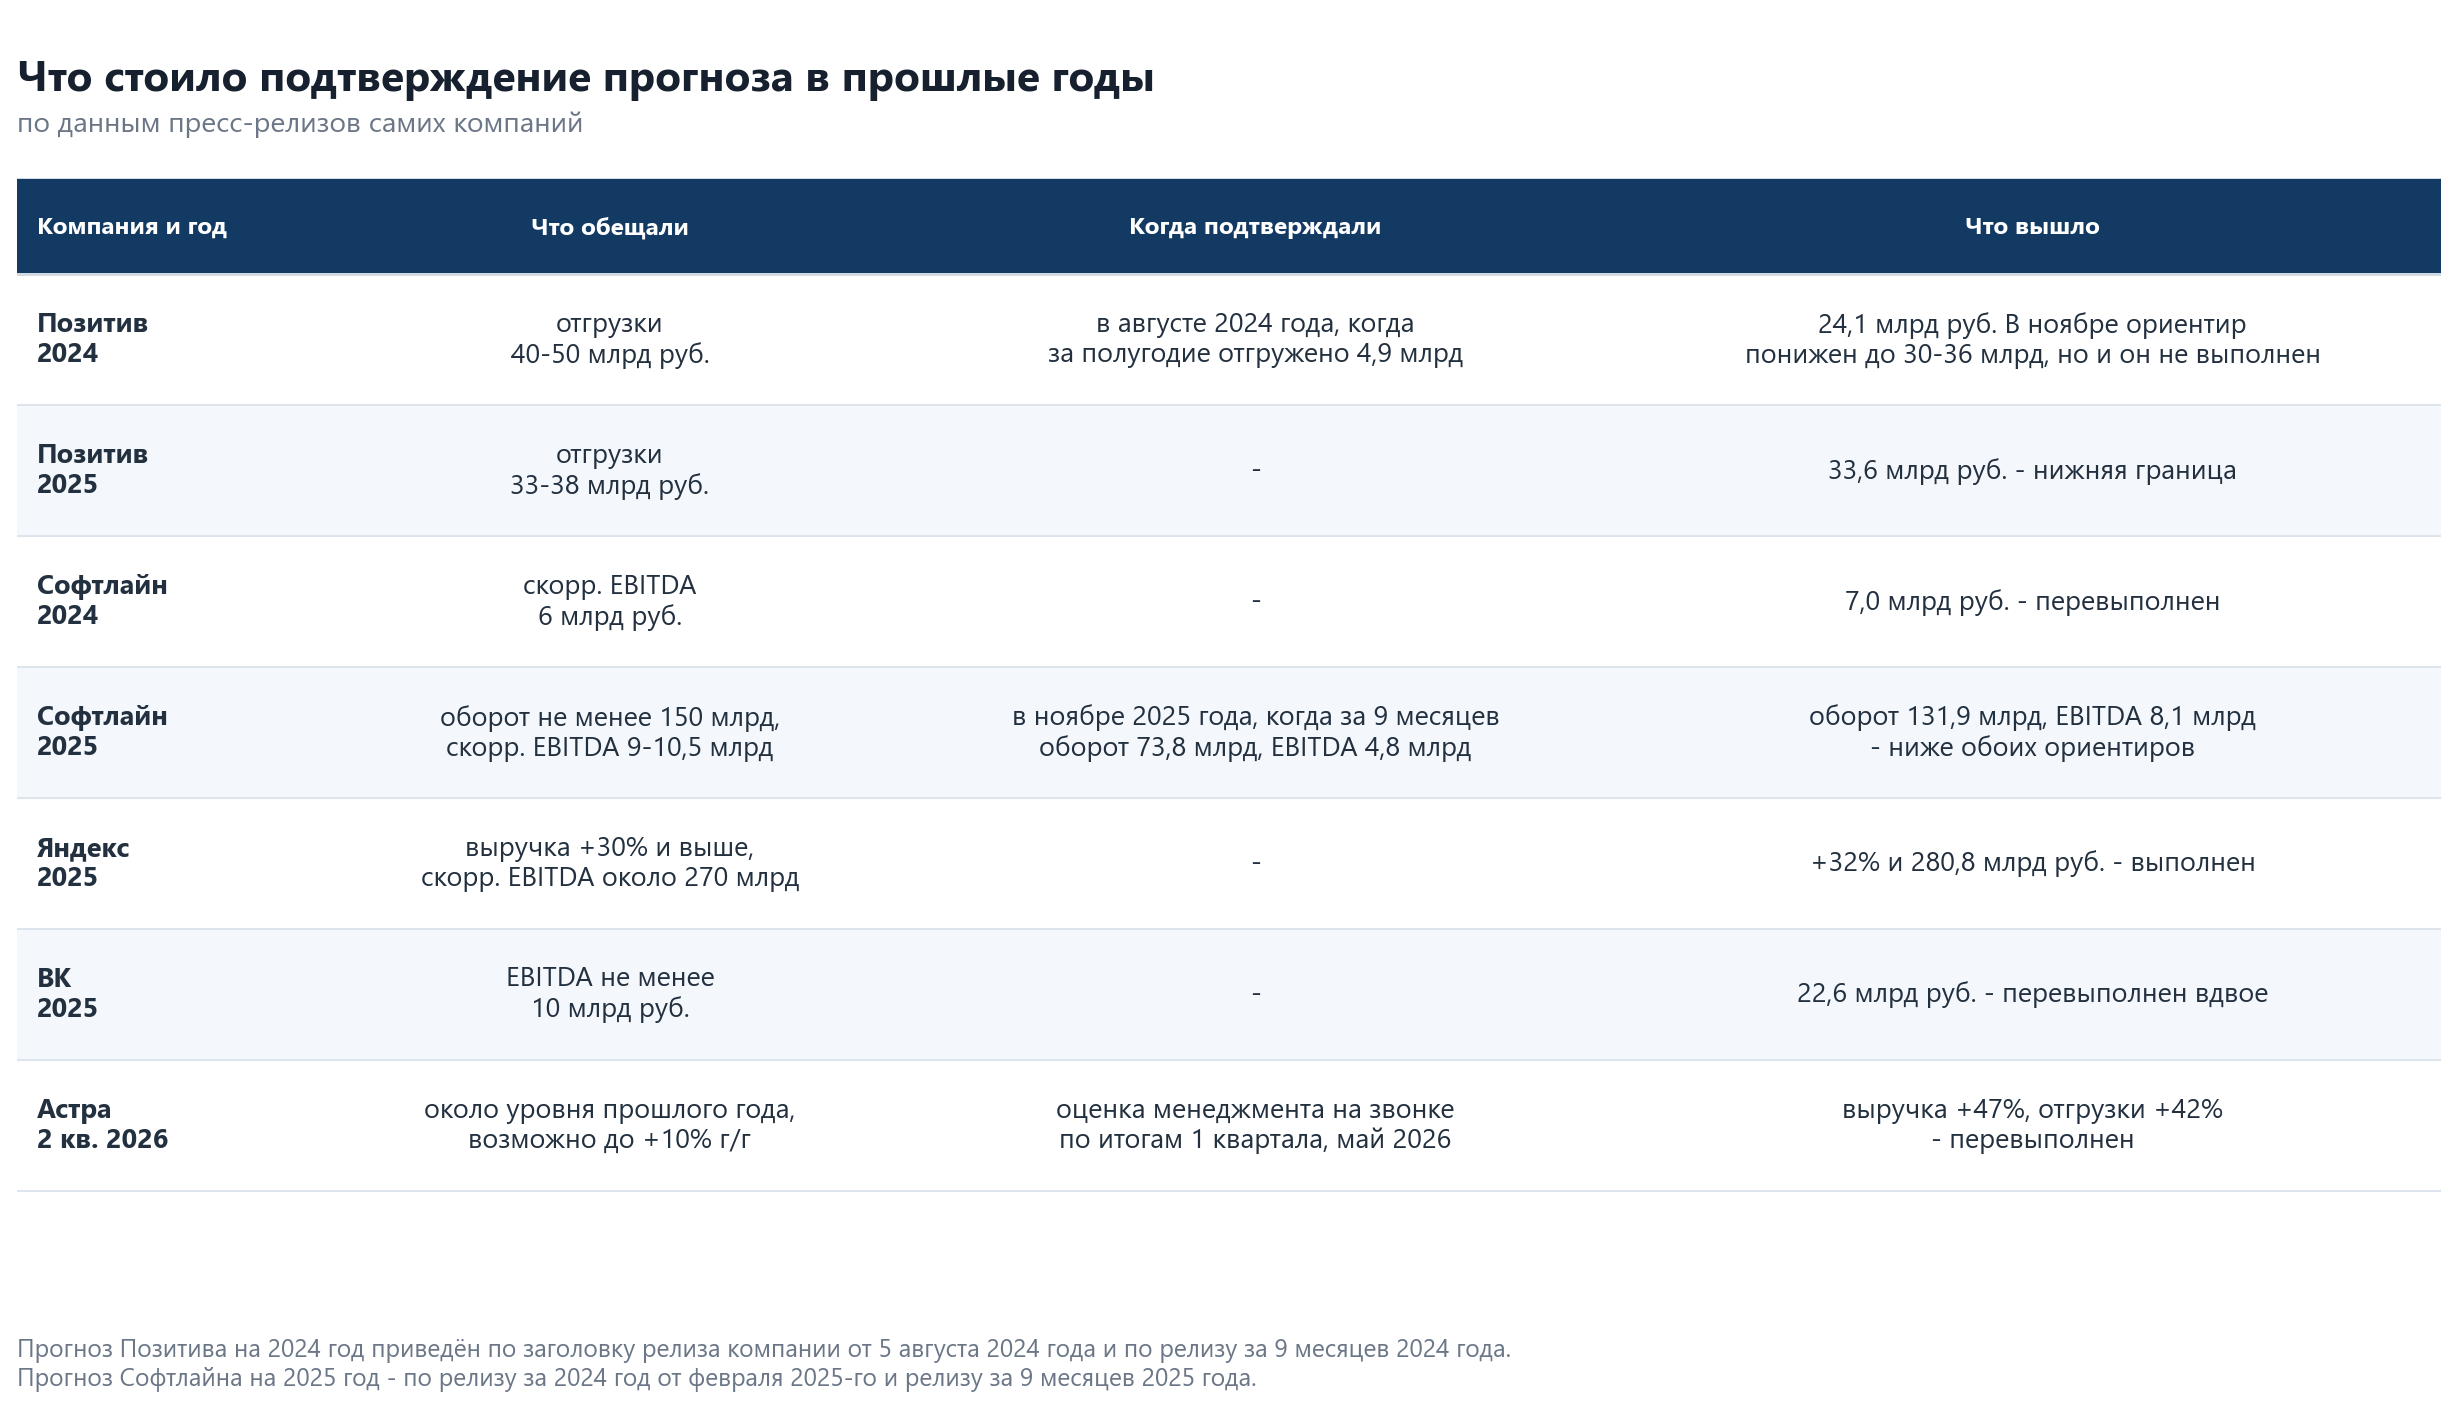
Softline missed its 2025 guidance on two of four indicators. It promised turnover of at least RUB 150 bn and adjusted EBITDA of RUB 9-10.5 bn, and delivered RUB 131.9 bn and RUB 8.1 bn. The guidance was reaffirmed in November 2025, when nine months had delivered RUB 73.8 bn of turnover and RUB 4.8 bn of EBITDA - less than half on both. Gross profit and leverage were met. A year earlier it was the other way round - an EBITDA plan of RUB 6 bn against an actual RUB 7.0 bn.
At Positive the case is worse. The headline of its release of 5 August 2024: "The company confirms its shipment plans for 2024 in the range of RUB 40 to 50 bn" - with RUB 4.9 bn shipped for the half-year. In November the guide was lowered to RUB 30-36 bn, and the year closed at RUB 24.1 bn, meeting neither the first guidance nor the revised one.
There are counter-examples too, and just as many. VK promised EBITDA of at least RUB 10 bn for 2025 and got RUB 22.6 bn, Ozon promised RUB 70-90 bn and made RUB 156.4 bn. In May 2026 Astra estimated the second quarter at "around last year's level, possibly with a small increase - up to 10% y/y", while revenue grew 47%.
This is reduced to one indicator - the guidance delivery index, that is, the actual divided by the midpoint of the initially announced plan. One is a hit on plan, below one is a shortfall, noticeably above one is an initially understated bar.
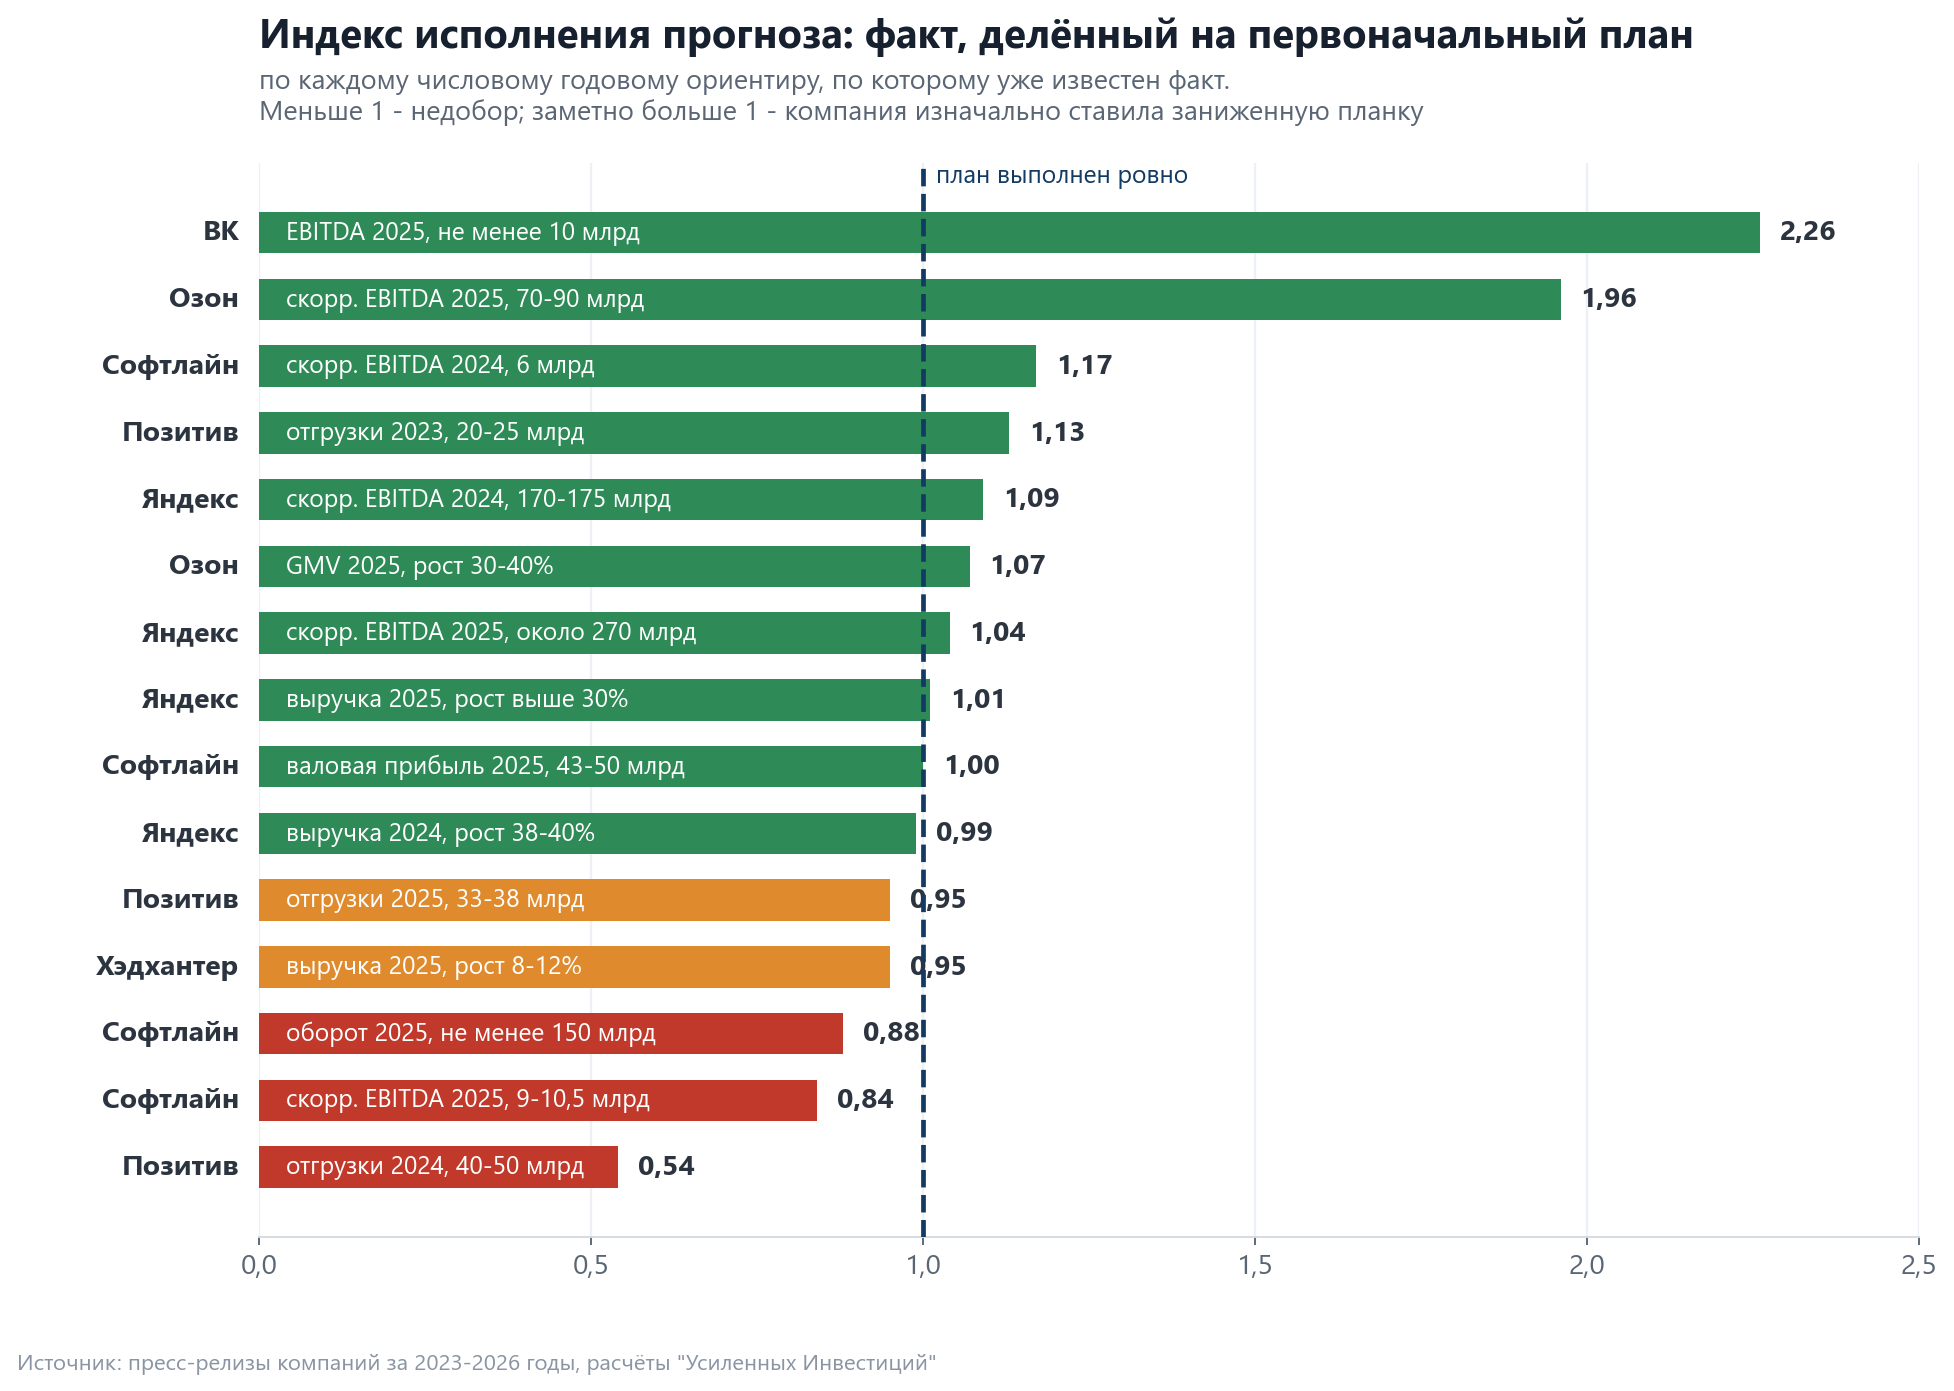
On the median of all its guidance, Yandex has a ratio of 1.02 and met four promises out of four. Softline - 0.94 with two met out of four, Positive - 0.95 with two out of three, HeadHunter - 0.95 with zero out of one. At the other edge are VK with a ratio of 2.26 and Ozon with 1.52: their guidance was exceeded with a large margin, which means not accuracy but a deliberately low bar. Astra does not publish numerical annual guidance in its reporting at all, so no index is calculated for it.
The conclusion is simple: the word "reaffirm" carries no information, the arithmetic of the remainder does. By this criterion Astra (plus 39% needed) and Yandex on revenue (plus 21% against an actual 16% in the last quarter) have the hardest task now.
Equity dilution is the fourth adjustment, absent from both EBITDA and multiples
The EV/EBITDA multiple is calculated for the whole company. If the number of shares grows, an individual shareholder's stake shrinks while the multiple stays the same. So the indicator should be recalculated per share.
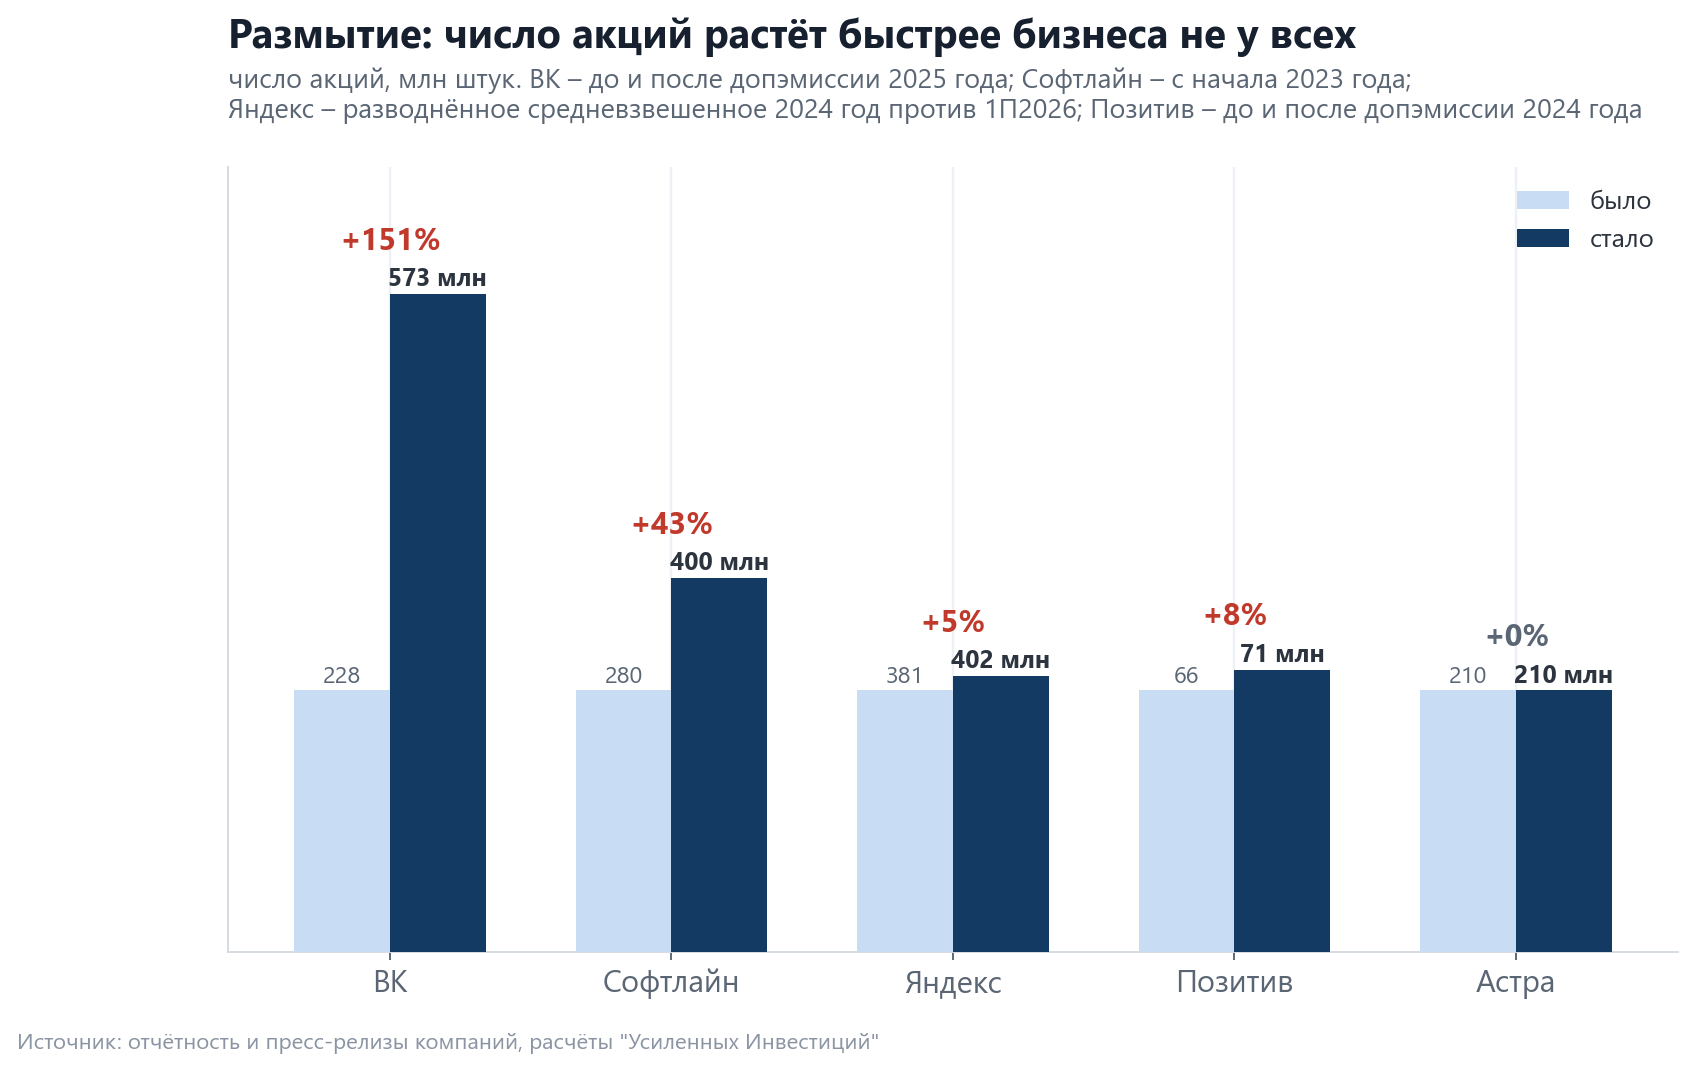
VK is the extreme case. In 2025 the company placed 345.0 mn additional shares at RUB 324.9 and raised RUB 112 bn, directing it to debt repayment. The number of shares rose from 227.9 mn to 572.9 mn. Net debt over this period fell from RUB 187 bn at the end of 2024 to RUB 60.2 bn at 30 June 2026, and finance costs fell from RUB 18.0 bn to RUB 6.7 bn for the half-year. The deal was sensible, but its price was paid by the previous shareholders.
Arithmetic per share: VK's EBITDA after deducting compensation and capitalisation of intangible assets rose from RUB 5.8 bn to RUB 6.9 bn, plus 19%. Per share it fell from RUB 24.9 to RUB 12.0, minus 52%.
At Softline the dilution happened earlier and was milder. The number of shares rose from 280 mn at the start of 2023 to 400 mn in the third quarter of 2024 and has not changed since; since October 2024 the company has repurchased more than 19.9 mn shares.
Positive issued 5.18 mn shares in late 2024 for the Growth Incentive Programme. There are now 71.214 mn shares outstanding, and their number has not changed over the last twelve months. The cost of the programme, RUB 10.0 bn, bypassed the income statement and remained only in the share count.
Yandex has been buying back more than it issues since May 2026. By 27 July, 3.3 mn shares had been repurchased for almost RUB 12.5 bn against an additional issue of 894.1 thousand shares for the quarter; the diluted weighted average number of shares rose 1.6% over the half-year. Astra did not change its share count and repurchased more than 2.4 mn out of a limit of 4 mn, about 2% of capital. CIAN has been buying back shares since 15 July for up to RUB 4 bn over 12 months.
On multiples the sector looks cheap exactly until the company calculates EBITDA
If we take the indicators from press releases, the whole sector trades in a narrow range of 4.2-5.8x EV/EBITDA. The spread is small, and at first glance the difference between names lies in growth rates. After recalculation the range doubles.
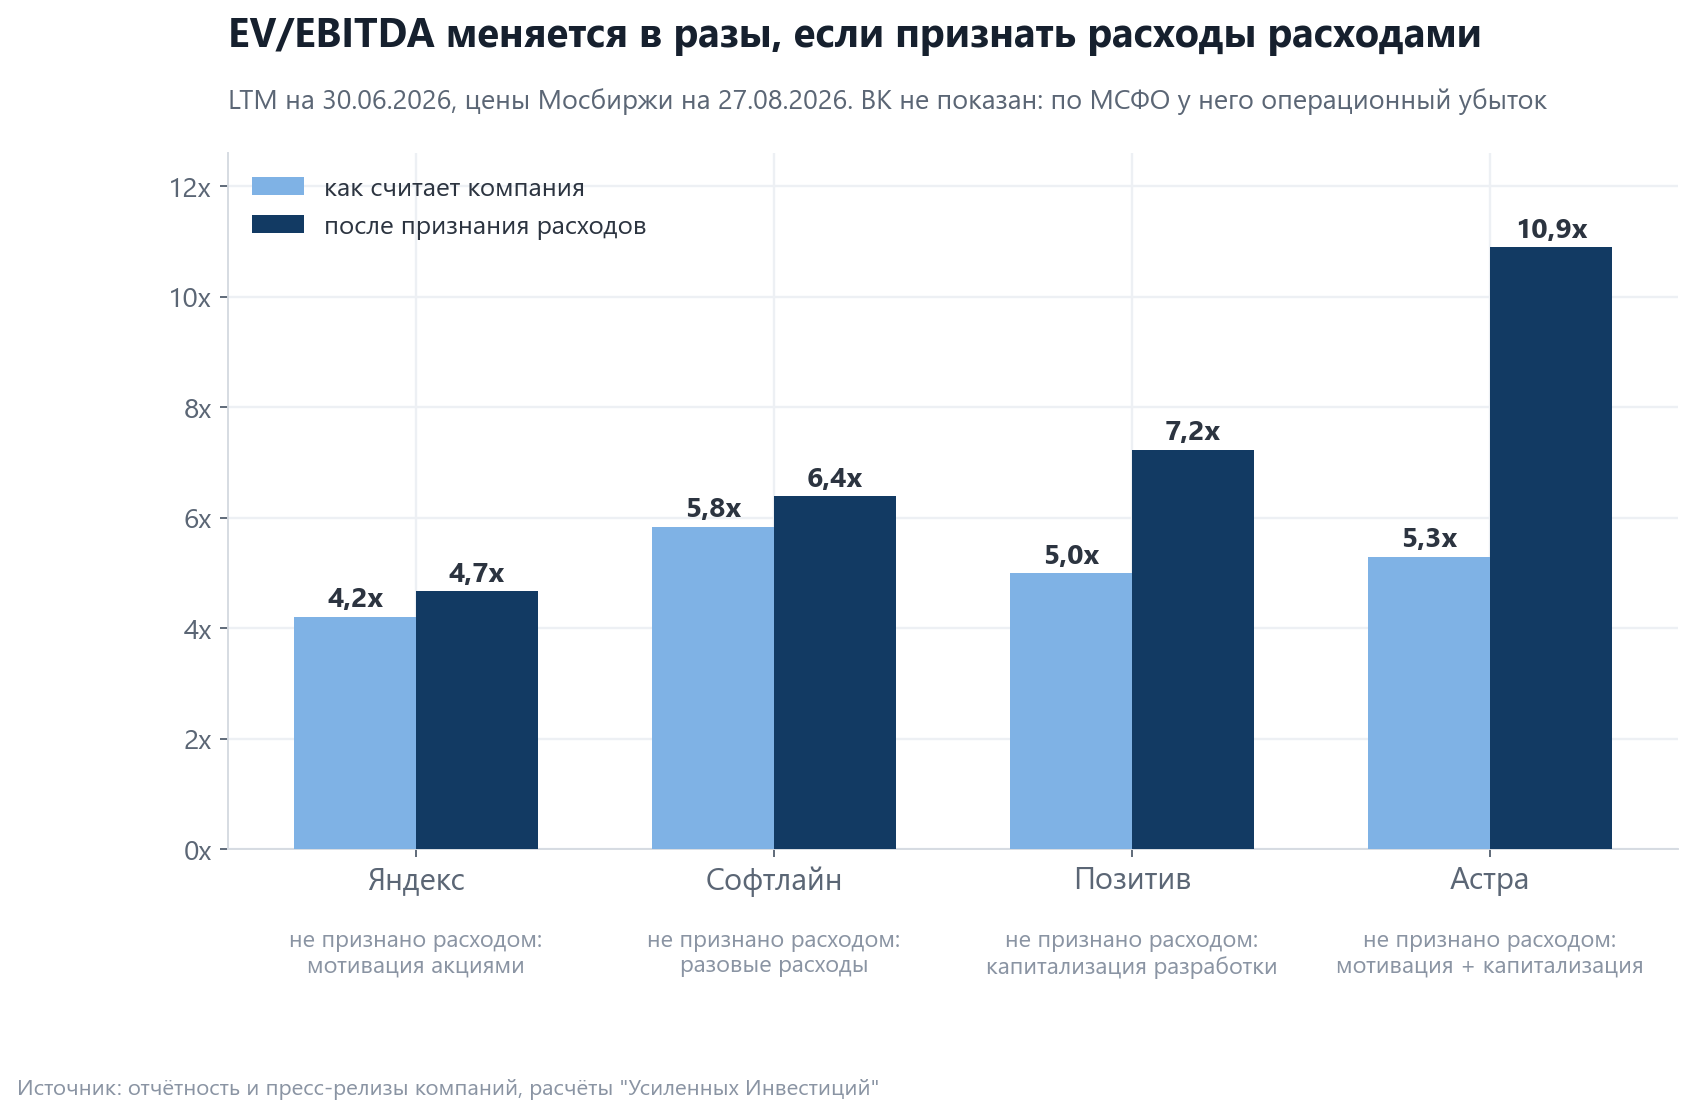
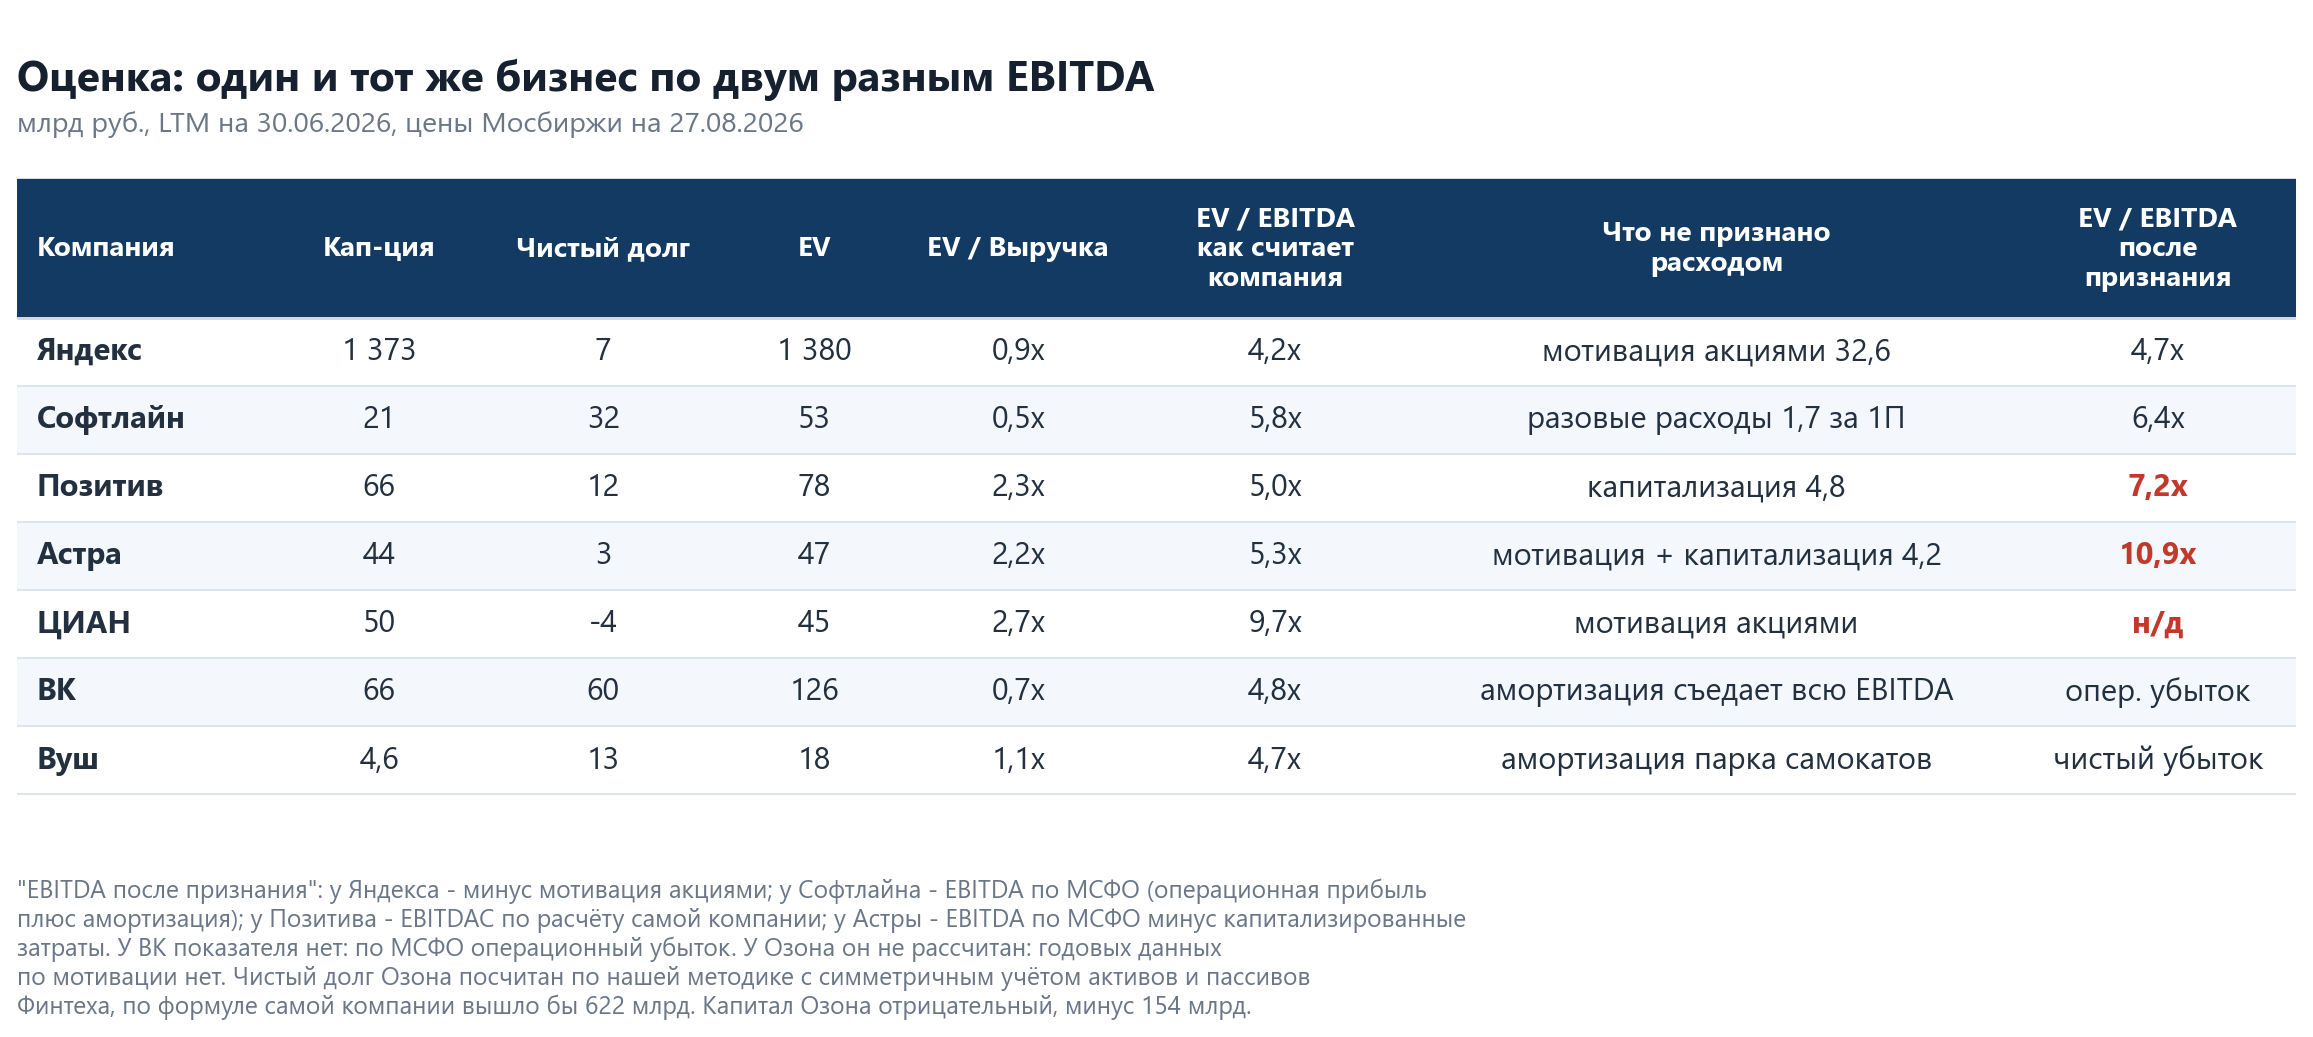
Astra turns from the cheapest on the headline multiple into the most expensive, from 5.3x to 10.9x. Positive - from 5.0x to 7.2x. Softline - from 5.8x to 6.4x. Yandex barely changes, from 4.2x to 4.7x, and as a result moves from the middle of the list to its start.
For VK there is no indicator after recalculation, because under IFRS the company has an operating loss. On revenue VK is valued at 0.7x, Softline 0.5x, Yandex 0.9x, Astra 2.2x and Positive 2.3x. The difference between 0.5x and 2.3x on revenue is the difference between reselling someone else's software and selling your own, and it is reflected correctly in valuation.
Separately on Softline: the company's headline indicator is turnover, not revenue. Turnover for 1H2026 is RUB 53.1 bn, IFRS revenue is RUB 38.7 bn. The difference arises from agency contracts, under which only the commission, not the whole deal amount, is recognised in revenue. Both indicators are correct, but the multiples to them come out different, and Softline on turnover cannot be compared with Astra on revenue.
Value creation is tested by three questions, and none of them is about EBITDA
EBITDA shows how much the business earned before settlements with the bank, the budget and past investment. The shareholder cares more about three other things.
Question one: what is left per share
EBITDA after recognising all expenses per share, 1H2026 vs 1H2025: Yandex RUB 358.2 vs 219.8 (plus 63%), Softline 7.21 vs 6.86 (plus 5%), VK 12.04 vs 24.86 (minus 52%), Astra minus 0.05 vs minus 1.87, Positive minus 25.6 vs minus 81.2. Only Yandex is growing fast; at Astra and Positive the indicator is moving toward zero from below, which is also an improvement.
Question two: what happened to net debt
Profit can be drawn, the movement of debt cannot. If EBITDA grows and net debt grows faster, the money did not reach the shareholder.
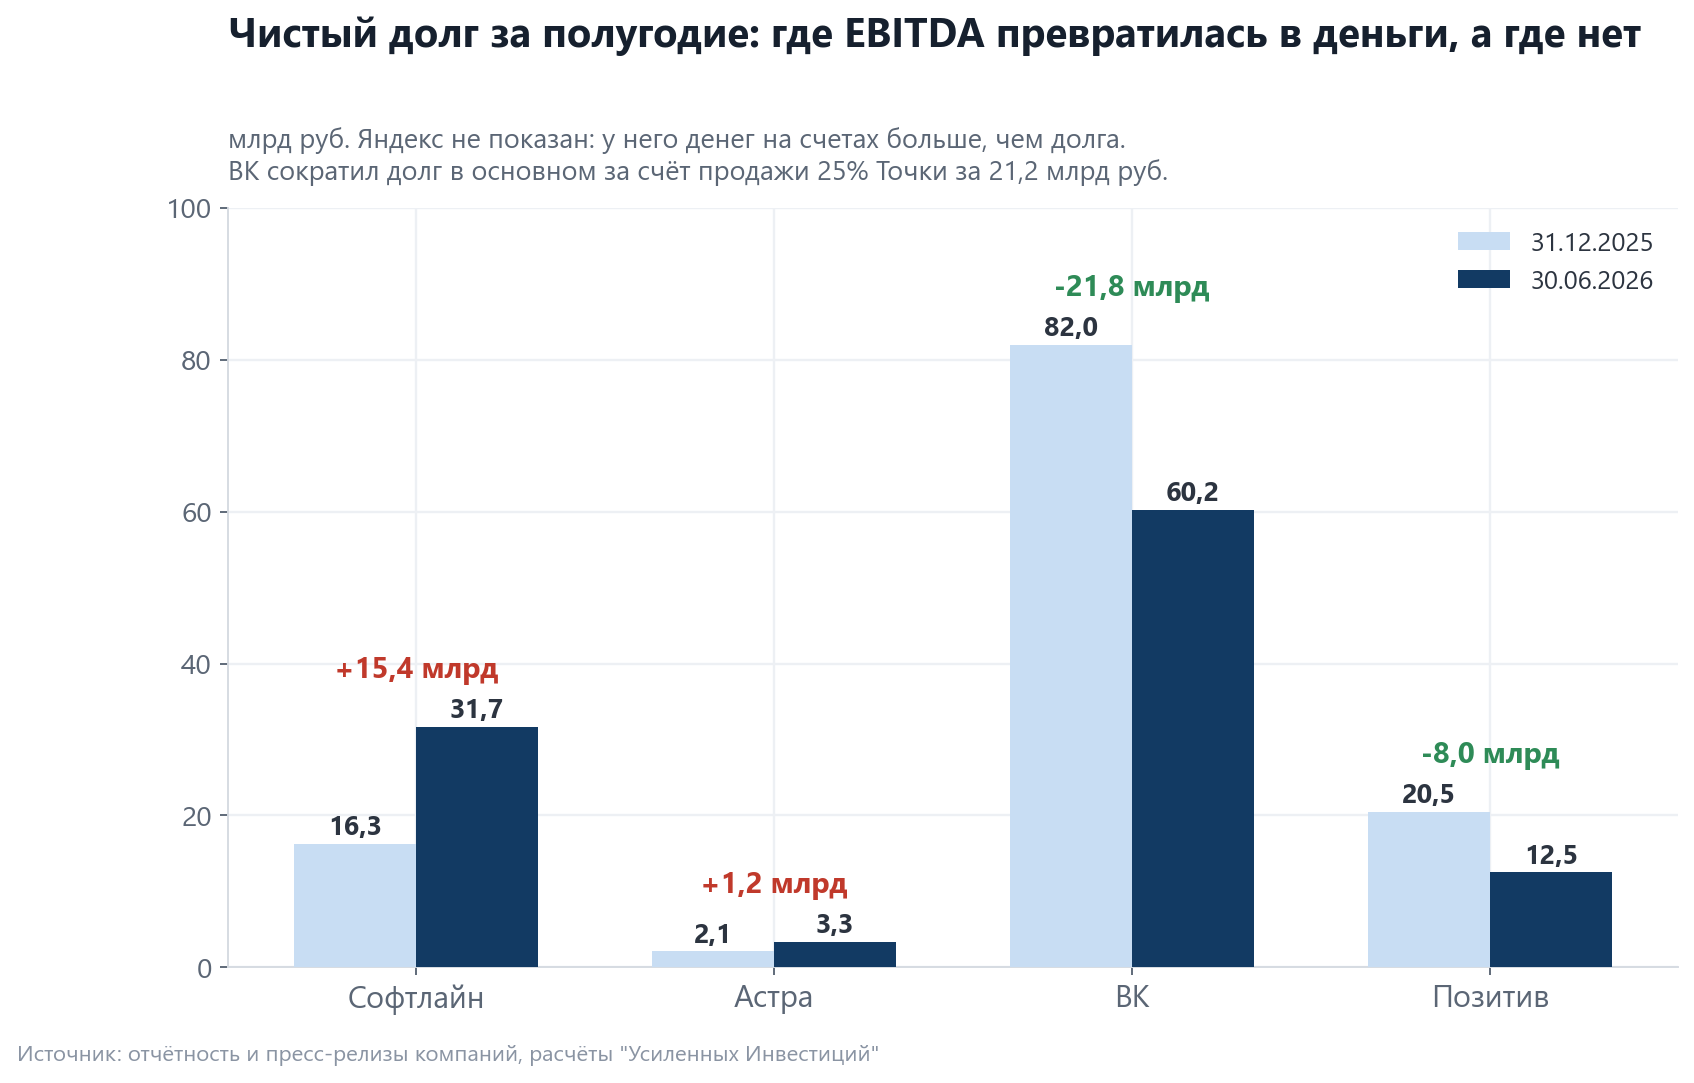
Softline increased net debt over the half-year by RUB 15.4 bn, from RUB 16.3 bn to RUB 31.7 bn, with adjusted EBITDA of RUB 4.4 bn. The company cites seasonality and working capital, and seasonality does exist. But Softline's operating cash flow was negative two years in a row - minus RUB 3.3 bn in 2024 and minus RUB 1.5 bn in 2025, with receivables growing by RUB 14.2 bn in 2025.
Astra increased net debt from RUB 2.1 bn to RUB 3.3 bn, free cash flow for the half-year was minus RUB 79 mn vs plus RUB 798 mn a year earlier. Positive reduced debt from RUB 20.5 bn to RUB 12.5 bn thanks to receipts for fourth-quarter shipments. VK reduced it from RUB 82 bn to RUB 60.2 bn, but RUB 21.2 bn of that came from the sale of the stake in Tochka, not from operations.
Question three: does operating profit cover interest
With the key rate at 14%, borrowing is expensive: Softline placed bonds in February 2026 with a 19.5% coupon, Positive has outstanding issues at the key rate plus 4% and at 18% fixed. In such an environment, interest coverage matters more than the multiple.
For 1H2026, IFRS operating profit covered finance costs as follows: Astra 6.2x (RUB 845 mn vs RUB 136 mn), Yandex 5.3x, Softline 0.2x (RUB 632 mn vs RUB 2,933 mn). At Positive and VK the operating result is negative, coverage is not calculated; at Positive another RUB 1.0 bn of interest is capitalised and was not included in the calculation.
Checklist: how to read an IT company's report in fifteen minutes
A sequence of actions that covers the main questions about any such report.
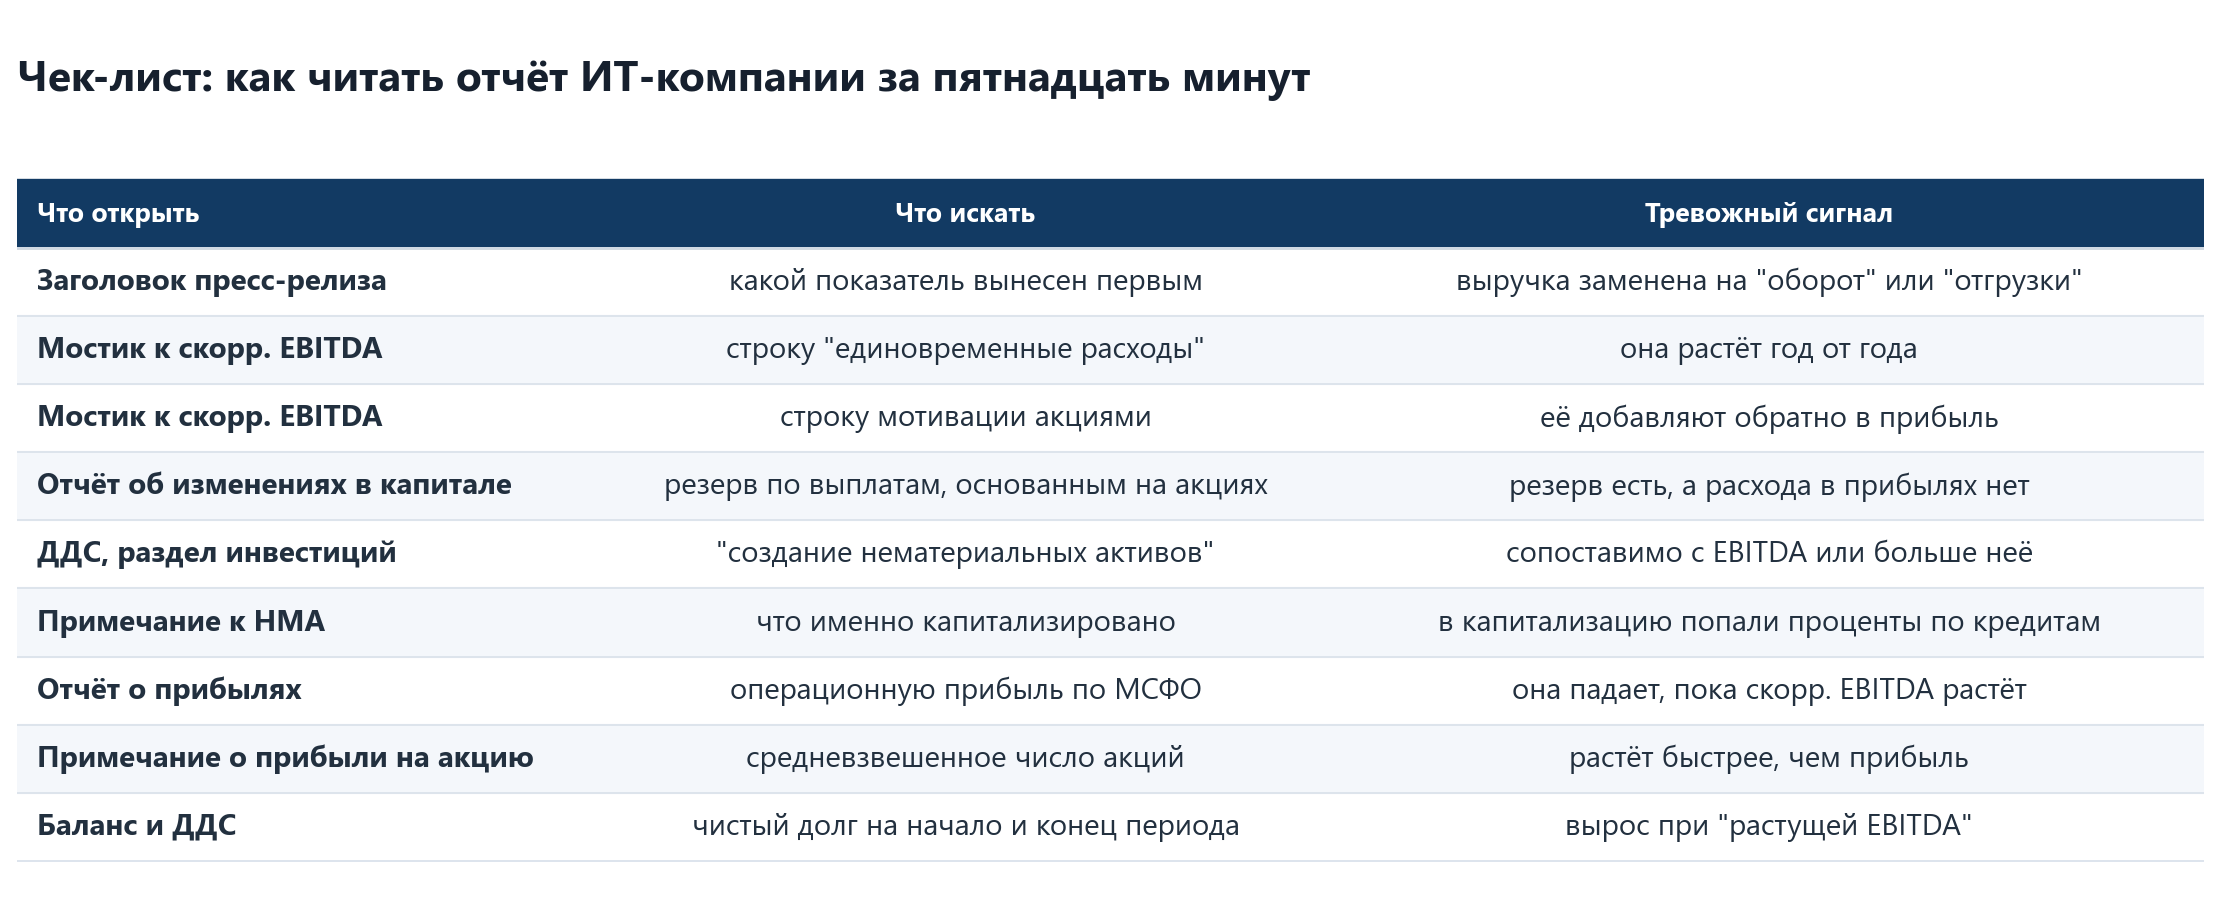
And two rules on top. Annual conclusions are not built here on a single quarter: at Astra the first quarter of 2026 is loss-making and the second a record with the same business. And the "adjusted EBITDA" of two different issuers is not comparable with each other; only IFRS operating profit is comparable.
A summary value-creation metric puts Yandex and Positive first, Softline last
All three tests above can be combined into one indicator. In the Enhanced Investments model it is calculated as follows: the increase in the last quarter's EBITDA vs the same quarter a year ago is multiplied by the target multiple, trailing twelve-month free cash flow is added to the result, the market value of dilution over the year is subtracted from the sum, and everything is divided by market capitalisation. The result is an annual fundamental return.
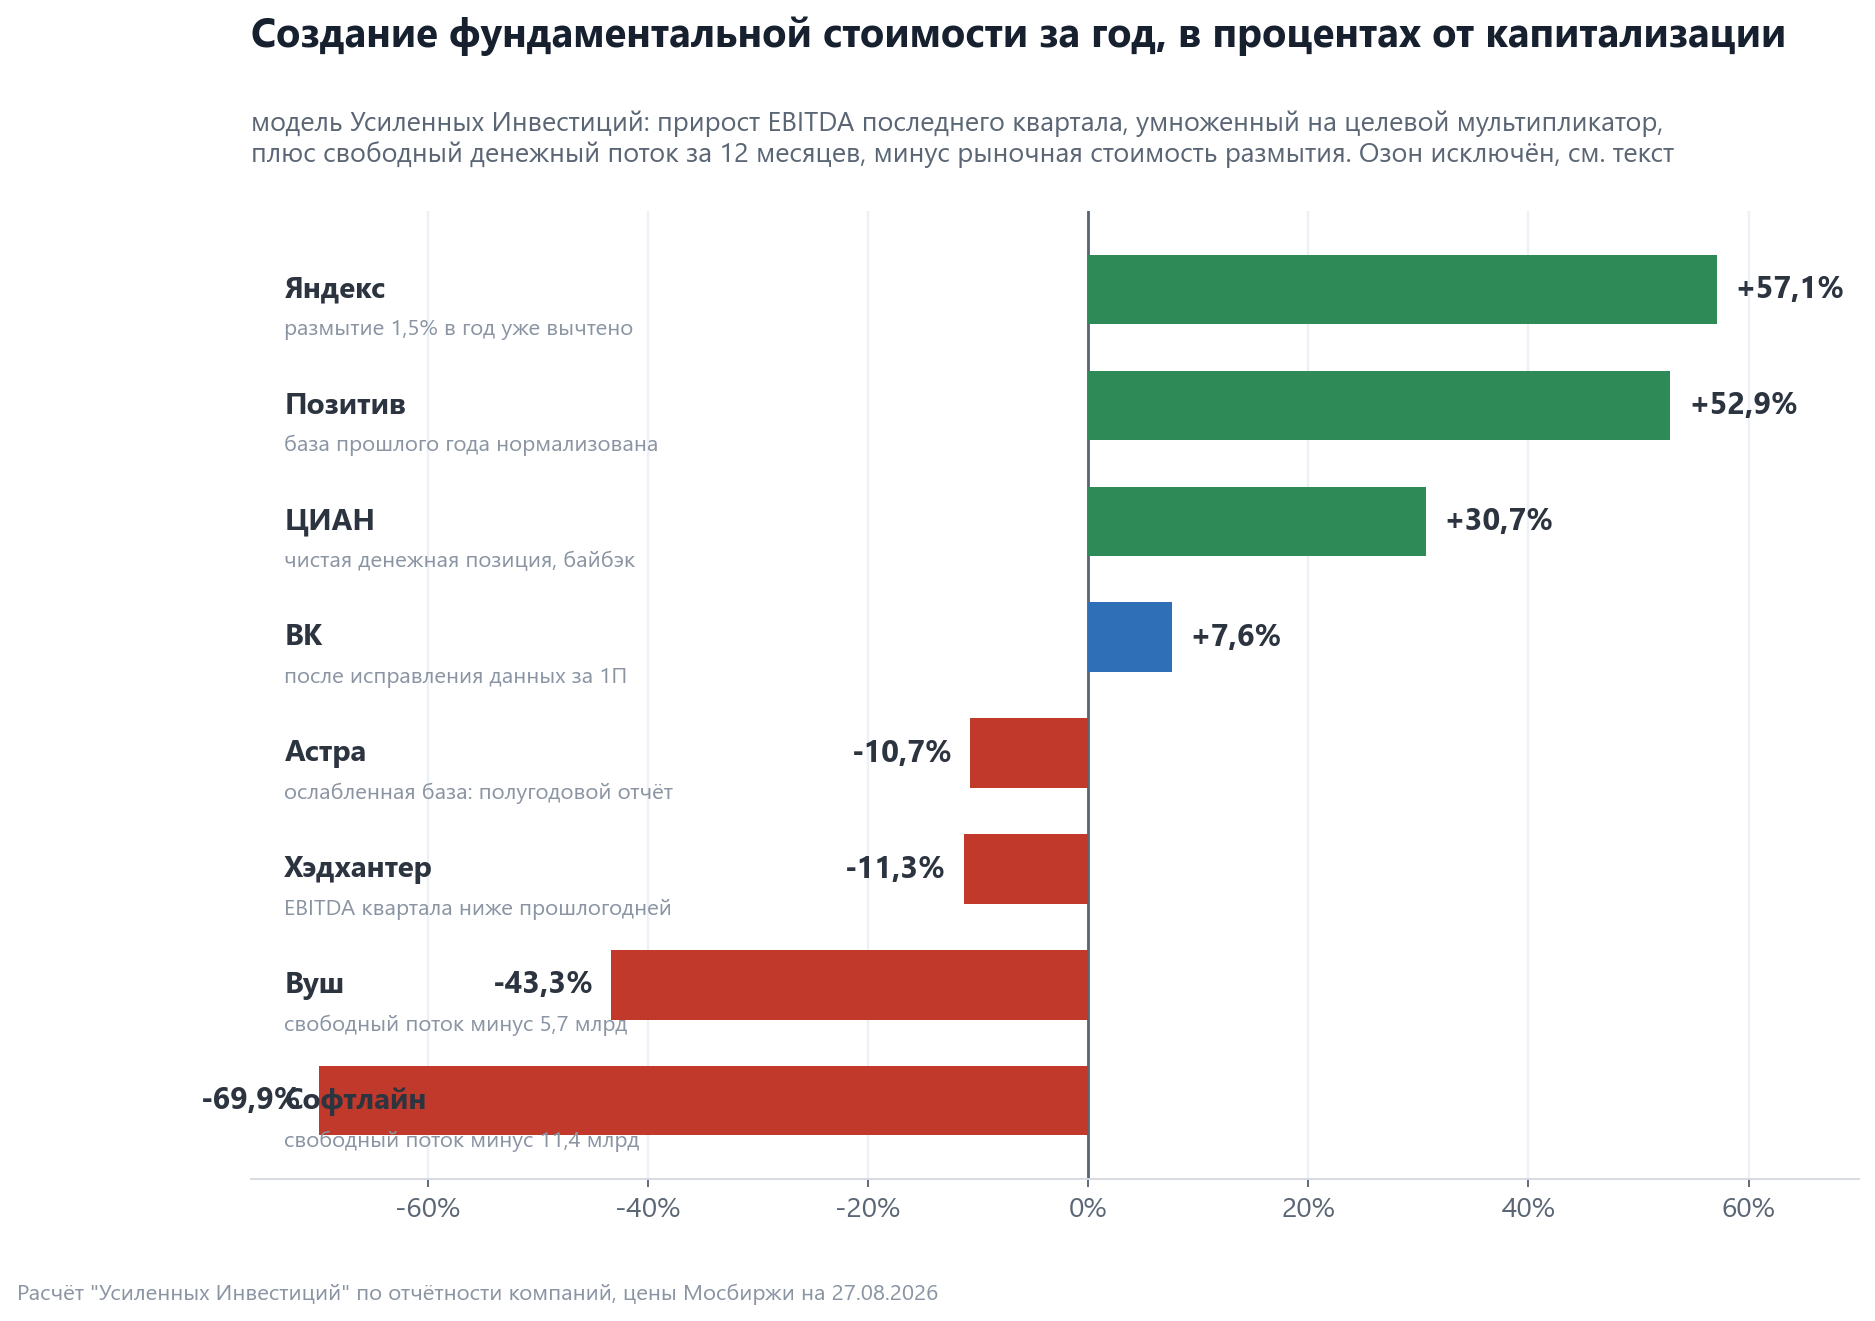
The order matches the conclusions from the individual tests. Yandex leads with 57% (dilution of 1.5% a year already subtracted) and Positive with 53%, then CIAN with 31%, VK is left with 8% after the data correction. In negative territory are Astra and HeadHunter, whose quarter's EBITDA is below last year's, and especially Whoosh with minus 43% and Softline with minus 70% - both have negative free cash flow, RUB 5.7 bn and RUB 11.4 bn respectively.
Two caveats on the figures. For Astra, Softline and VK the calculation runs on a weakened base, because they report on a cumulative basis and EBITDA growth is taken against the full year rather than the comparable quarter. For Positive last year's base was loss-making and was normalised by the model. Ozon is not included in this calculation: its trailing twelve-month operating cash flow contains an inflow of Fintech client funds, and free cash flow by the formula comes out overstated severalfold.
Conclusions by name: the premium is now paid for transparency and interest coverage, not for growth pace
Below is the authors' assessment on the same criteria. It is a way to order the names, not a recommendation to buy or sell.
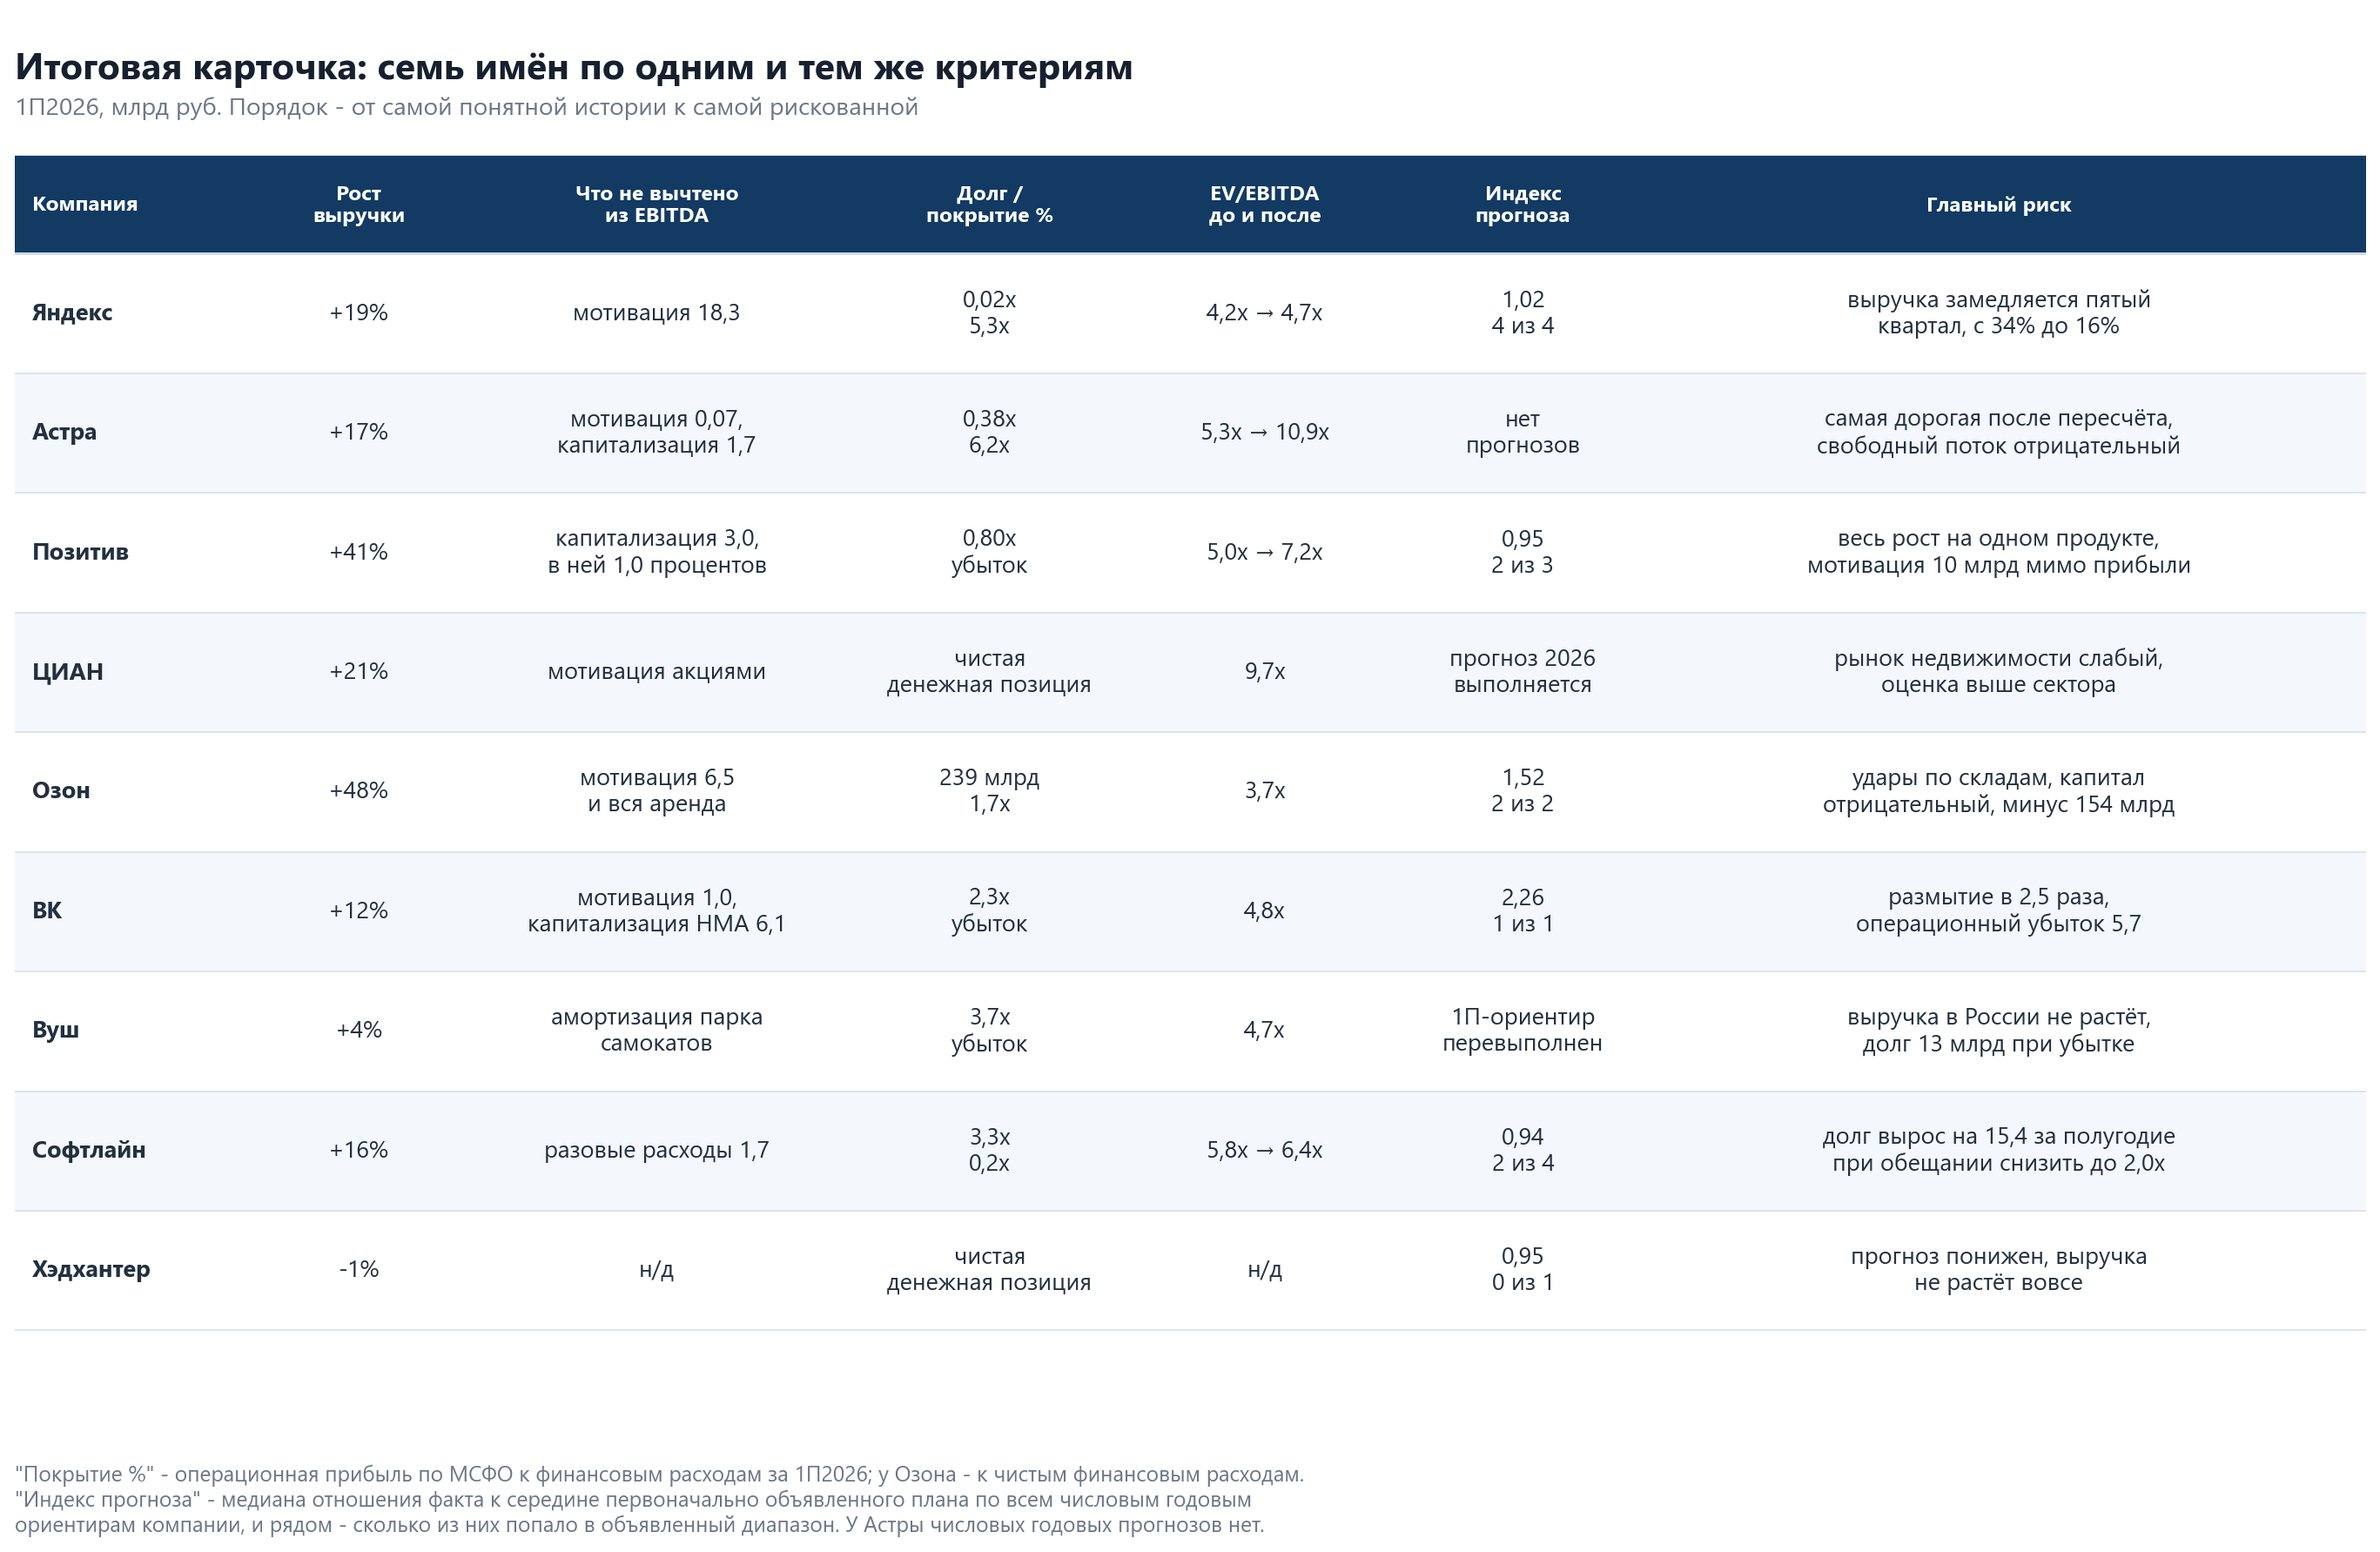
Yandex is the clearest story in the sample. The gap between headline EBITDA and IFRS is minimal, development is expensed, compensation is disclosed on a separate line, there is practically no net debt, operating profit covers interest 5.3 times, and of four past numerical guides the company met four. The price to pay is 4.7x EV/EBITDA after deducting compensation - more expensive than Ozon and VK but cheaper than Astra and Positive. There is one weak spot and it is important: revenue is growing ever slower, the core did not grow in the first quarter, and the result is now made by margin, not growth.
Astra has the best disclosure in the sector at the highest price. The company itself shows both EBITDA and adjusted EBITDA, capitalised costs and the dividend base. Debt is almost zero, interest coverage is 6.2x, and in the second quarter growth accelerated to 47%. But after deducting capitalisation EBITDA goes to zero, EV/EBITDAC comes out at 10.9x, and free cash flow for the half-year is negative.
Positive is the strongest turnaround and the highest dependence on one product. Shipments plus 45%, expenses minus 13%, net debt minus 30% y/y, EBITDA turned positive. But EBITDAC is still minus RUB 1.8 bn, more than half of accrued interest goes to the balance sheet, compensation of RUB 10 bn bypassed the income statement, and the entire gain came from one product. The check point is close - RUB 6.75 bn of shipments is stated for the third quarter.
Ozon is growing fastest and is the cheapest on multiple, and there is a reason for that. Revenue plus 48%, orders plus 78%, the company turned to profit, EV/EBITDA 3.7x. But EBITDA deducts neither compensation nor leases, half of it is made by the bank, equity is negative, and from 22 to 24 August drones struck the company's warehouses in six regions. The shares responded with a fall from RUB 2,979 at the close on 21 August to RUB 2,273.5 on 24 August - minus 23.7% in one session, and by 27 August minus 26.3% from the 21 August level. This is a risk that cannot be counted from the reports: it is not in the multiple but in how many warehouses are working tomorrow.
VK improved its operating indicators but has not yet created shareholder value. Revenue plus 12%, EBITDA plus 34%, debt cut from RUB 82 bn to RUB 60.2 bn, but RUB 21.2 bn of the RUB 21.8 bn reduction came from the sale of the stake in Tochka. Under IFRS an operating loss of RUB 5.7 bn remains, and EBITDA per share after dilution of 2.5x fell by half.
Softline is the riskiest profile in the sample. The only company whose IFRS operating profit falls 12% while headline EBITDA grows 27%. Interest coverage is 0.2, net debt over the half-year rose by RUB 15.4 bn against a promise to reduce leverage to 2.0x, operating cash flow was negative two years in a row, and the company reaffirmed its 2025 guidance in November and did not meet it.
HeadHunter and CIAN are different halves of one picture. HeadHunter's revenue is not growing and guidance has been lowered, but profitability above 50% and a dividend of RUB 200 per share remain; a turn in its revenue will be the first signal of expanding employer budgets. On the same weak market CIAN raised profitability from 23.4% to 32.7% and doubled profit, but trades at 9.7x EBITDA - more expensive than all but Astra.
Whoosh stands apart in this company. Formally it is cheap, 4.7x EBITDA, but its EBITDA does not deduct amortisation of the scooter fleet, and the fleet is the business: under IFRS the half-year loss is RUB 1.77 bn with debt of 3.7x EBITDA. If we reduce everything to one phrase - for a transparent report and no debt the market takes a moderate premium, for capitalisation of development a high one, and the lowest multiples sit where the main risk cannot be counted from the reports at all.
Conclusion: three questions worth asking of any report in this sector
The first - which indicator the company put in the headline and what in it has not been recognised as an expense. The second - what happened to net debt and whether operating profit covers interest. The third - how the number of shares changed. The answers to these three questions change the picture of the sector more than the difference in revenue growth rates.
The sector went through the first half better than the economy, but demand has become more selective: HeadHunter has zero, at Positive renewals and expansions fell, at Softline industrial customers are postponing projects. In such a phase it makes sense to pay a premium for report transparency and debt safety margin, not for the fastest growth.
Tickers
Issuer cards with full financial history and multiples: Yandex (YDEX), Ozon (OZON), Softline (SOFL), Astra (ASTR), Positive Technologies (POSI), VK (VKCO), HeadHunter (HEAD), CIAN (CNRU), Whoosh (WUSH). Extended cards and the other names in the sector are on our portal.
See also: market overview · valuation map · stock screeners