How we rebuilt our Russian oil and gas models: real Urals, the refining leg and what we have not proved
We go through what was broken in our Russian oil and gas models, what we fixed and what remains unproved. In short: the oil model now explains twice as much, and Gazprom has stopped being a coin toss. But the out-of-sample test showed the limit of applicability: the model works on EBITDA and does not work on net income, so it does not close the chain down to the dividend. We write about that too.
The trigger was simple. LUKOIL reported strongly for the first half, the stock has gained about 13% since the end of August, and it was not in our recommendations. We set out to find out why. We pulled out a chain of problems that turned out to be far longer than one name.
Our database had no Urals series at all, so we had been modeling oil on Brent
The first finding devalued everything built on top of it. The database has series 15. It is called "Brent oil", and it really is Brent. The model labeled it as Urals. Next to it sit series 77 "Urals oil" and 178 "Russian oil", which look like genuine quotes but on inspection turned out to be the same Brent minus a fixed USD 12.64 and USD 24.50 on every date. Series 260 has been frozen at 65.49 since time immemorial. So we had no live price of Russian oil at all, and the discount was a constant.
The real discount is not a constant. According to official Ministry of Economic Development data (monitoring under Article 3.1 of the Law "On the Customs Tariff", Argus quotes), over 2024-2026 it ranged from USD 7.24 in April 2026 to USD 25.17 in July, with a jump from roughly 10 to 19-25 in November 2025. That is a spread of USD 18 where the model held 12.64.
The official monthly average price is now pulled by a separate loader, the daily Urals is built as Brent minus the month's discount, and this is updated daily.
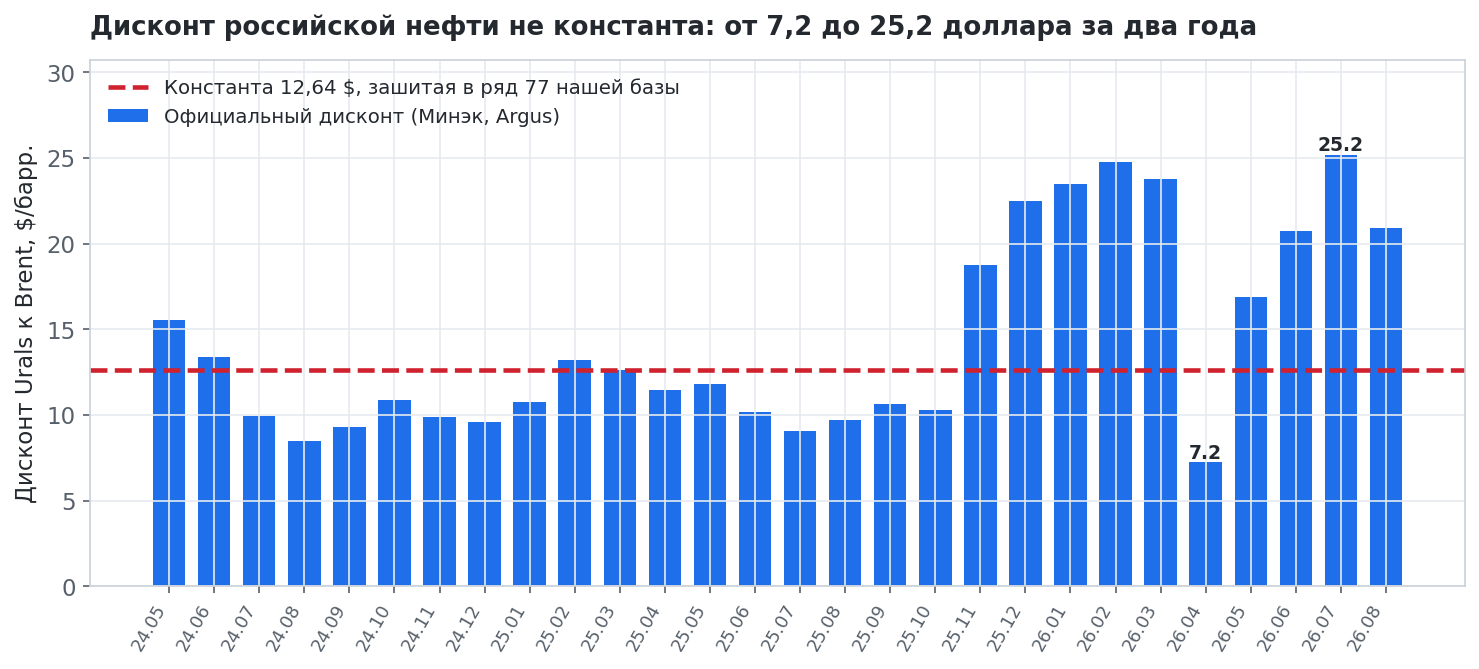
The real oil price did not rise at all over the half-year, yet LUKOIL's EBITDA doubled
Here is the number that made all of this worth doing. LUKOIL's EBITDA for the first half of 2026 against the same half of 2025 (continuing operations, one perimeter): RUB 421.9 bn against RUB 815.3 bn. The increase is RUB 393.5 bn. Decomposition by leg. The oil leg at the real Urals in rubles gave minus RUB 5.9 bn, that is, zero. The export crack-margin leg gave plus RUB 435.4 bn.
The old Brent-based model saw a ruble price increase of RUB 528 per barrel where Urals gave nothing. It was catching not the oil price but its own discount constant. Multiplied by 0.25 and by production, this illusion explained 11% of the move in EBITDA.
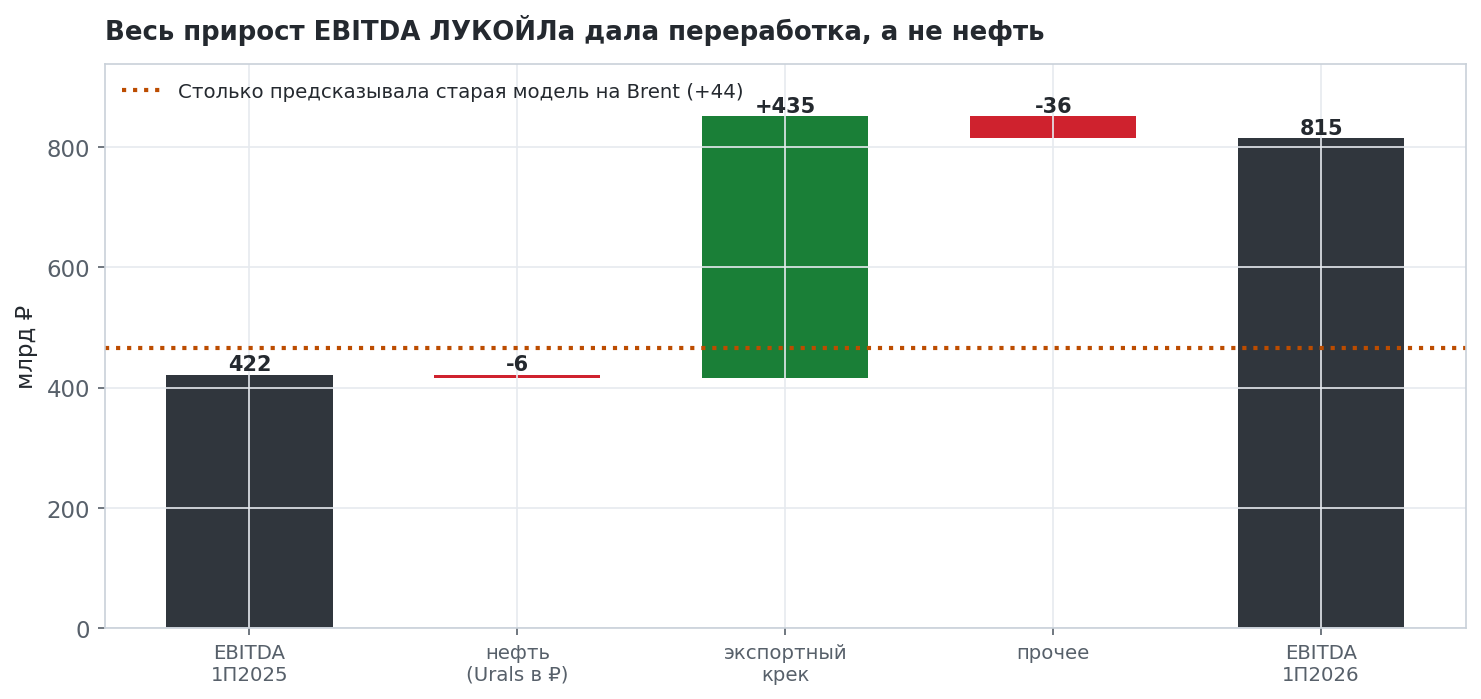
Refining explains the move, and the model had no such leg at all
At LUKOIL, refining is comparable to production, and in the model it played no part. We added a second leg: refining multiplied by the change in the export crack margin in rubles.
The key point is that we estimated the coefficients rather than setting them. The old model had X_net = 0.25, derived from the reasoning "Russian oil at the margin is taxed at roughly 75%". It sounds convincing, and on testing it explains one ninth of the move. The new coefficients, 0.21 for oil and 0.72 for the crack, come from a regression on a panel of six companies.
The international crack works, not Russian domestic quotes, and that is a consequence of the damper
We tested both legs honestly. Russian domestic quotes (diesel, SPIMEX fuel oil, the ECIP index) do not pass into the model. They break the coefficients, and the sign starts to dance. Export parity works.
The reason is substantive, not technical. The damper ties refinery economics to export parity even on domestic sales, so it is the damper that is the driver, while domestic prices turn out to be a consequence. We kept the domestic series in the engine, as they will be needed for work on the damper cut-off, but they do not enter the potential calculation.
The model explains EBITDA across names and explains net income not at all
This is the most important section, and it is not flattering.
The leave-one-name-out test works like this. We train on five companies and predict the sixth, which is exactly what a screener needs.
- old model, 0.25 on Brent: R2 = 0.377, mean error 25.2%, direction right in 87% of cases;
- new model, Urals plus export crack: R2 = 0.706, error 21.4%, direction 87%.
The coefficients are stable across folds: oil 0.17-0.24, crack 0.63-0.83. For LUKOIL, which the model had not seen in training, the miss was minus 36% against minus 92% for the old one.
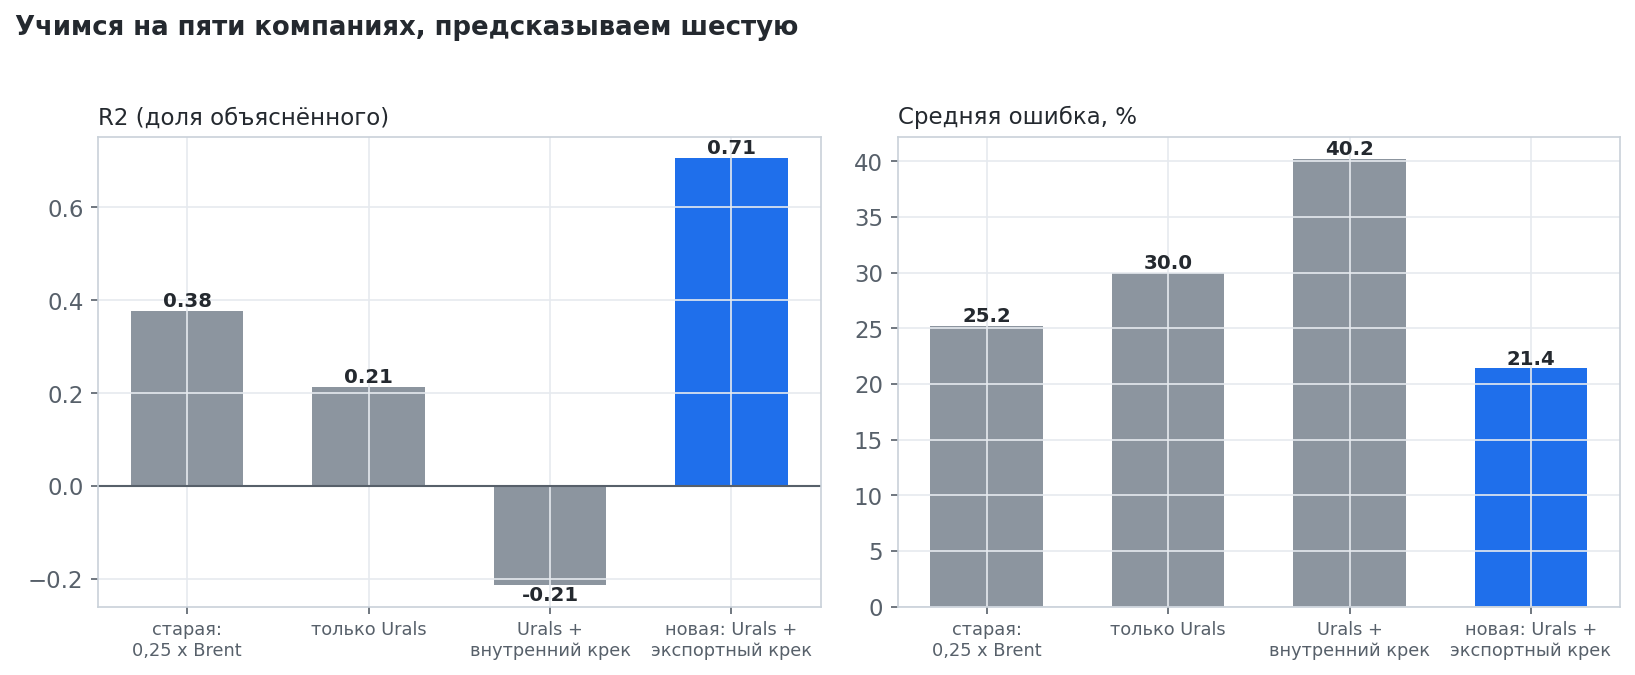
Now for what matters more than praise. We ran the same specifications on two targets at once and with two methods of testing.
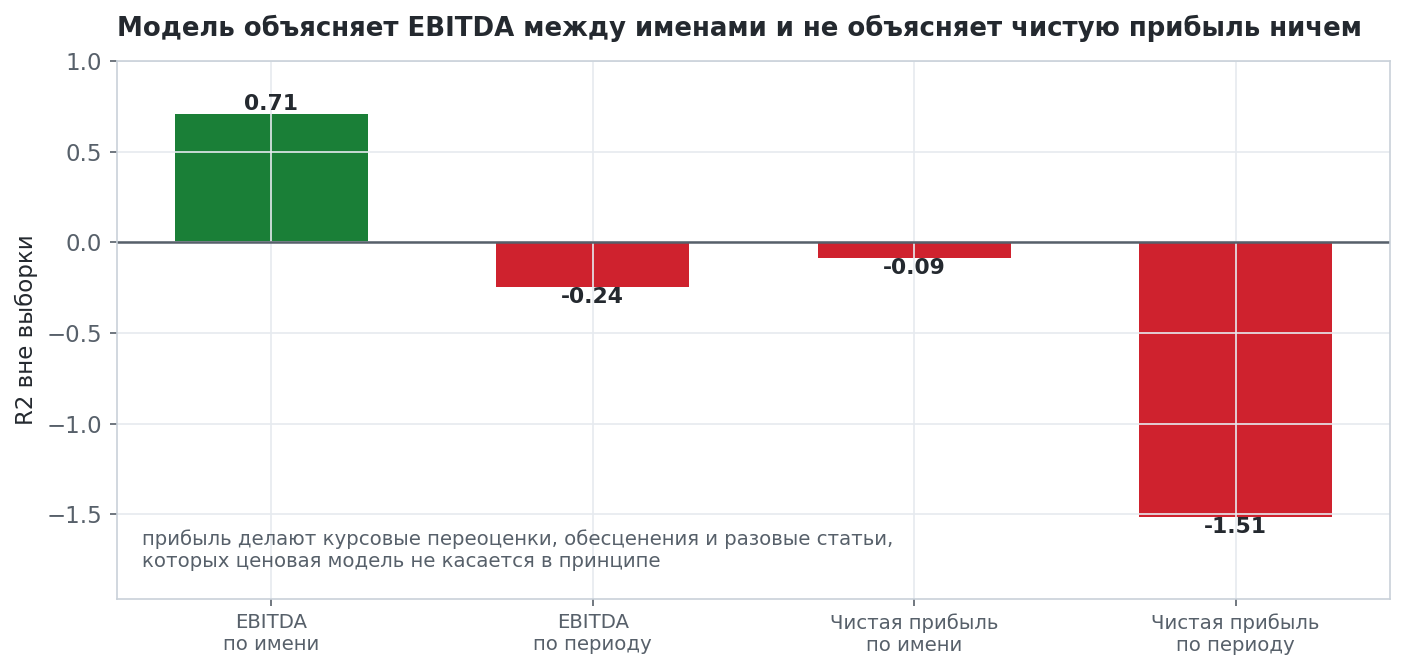
Across periods, that is, when you drop a whole period and try to predict it, R2 is near zero for every specification without exception. On the long sample from 2019 the figures look better (0.52 for the old model, 0.46 for the new), but they cannot be trusted: before May 2024 "Urals" there is our own reconstruction with a constant discount, that is, almost the same Brent, and the test compares the model with itself. The real long history of Urals still has to be assembled, and that is a task, not a verdict.
The result on net income, however, is a verdict. R2 is negative in all four specifications, under both methods of testing, and the direction is guessed about as well as by tossing a coin.
The reason is clear and cannot be cured by tuning coefficients. The net income of Russian oil companies is made by exchange-rate revaluations, impairments, one-off items and financial expenses, and a price model has nothing to do with them. Between EBITDA and profit there is a layer that the model does not have.
The practical conclusion. The model is fit for ranking names by operating sensitivity to prices, and not fit for forecasting profit or dividends. The dividend chain is calculated by a separate model, and we have not yet measured its predictive power.
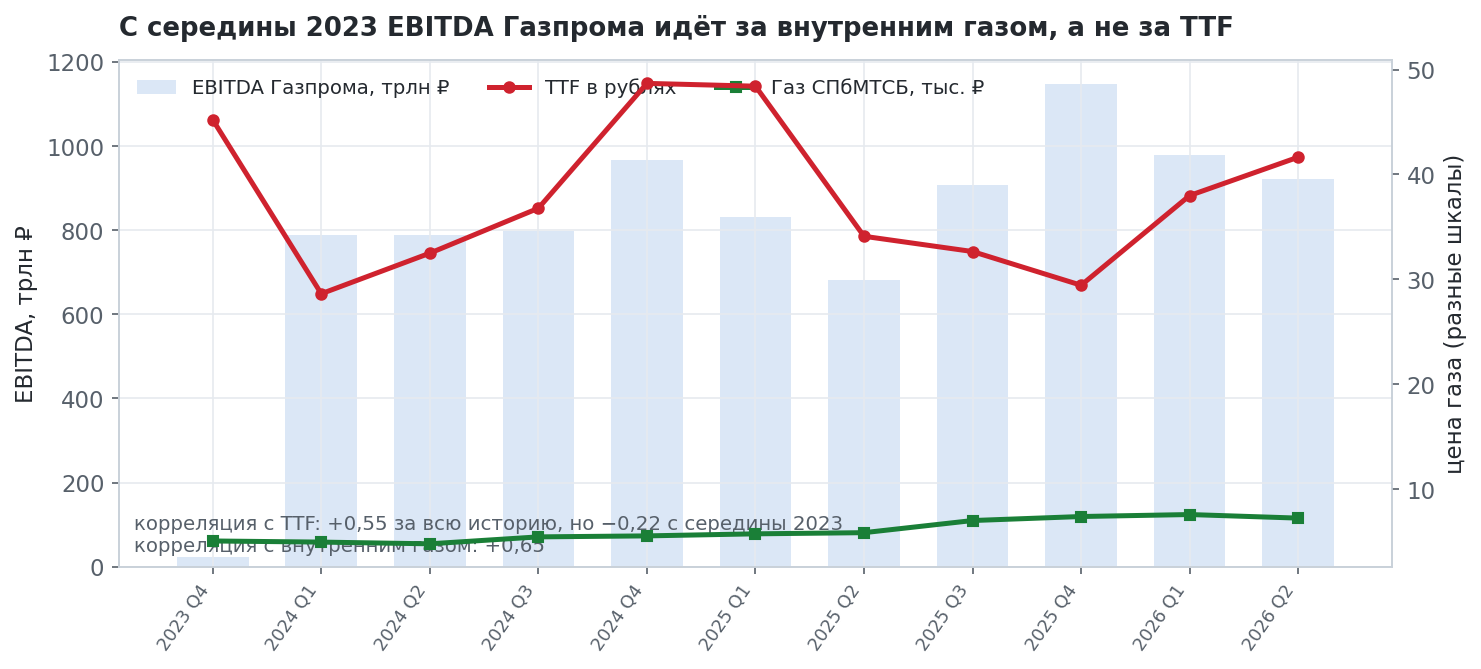
At Gazprom the link with TTF changed sign, and 28.5% of group EBITDA is actually oil
The Gazprom map had TTF with a weight of 0.50 and LNG with 0.10. That is the revenue structure from before 2022.
We calculated the correlation of quarterly EBITDA levels with prices.
- with TTF in rubles: plus 0.55 over the whole history since 2019, but minus 0.22 since mid-2023;
- with domestic gas on the national SPIMEX index: plus 0.65;
- with Urals in rubles: minus 0.59.
The link with the European hub did not just weaken, it flipped. It also turned out that 28.5% of group EBITDA is Gazprom Neft (RUB 1,056 bn out of RUB 3,702 bn on our own LTM figures, at an ownership stake of 95.68%), that is, oil and refining, which the gas map did not contain in any form.
The new branch is assembled from three parts. Gazprom Neft's oil model multiplied by the ownership stake, plus domestic gas, plus a small export leg. Out-of-sample test on six quarters with a base of 2024 and later: before, R2 = minus 2.26, error 20.9% of EBITDA, direction right in 50% of cases, literally a coin. After, R2 = plus 0.37, error 8.8%, direction 83%.
Gazprom's potential, as a result, fell from plus 400% (it was hitting the cap) to plus 27%.
The target multiple equaled the current one, so the model had no re-rating at all
A separate defect that affected the whole Russian universe, not just oil. The target multiple in the model was equal to the company's current EV/EBITDA. This means the model asserted that fair price equals today's price plus the change in EBITDA. There is never a re-rating, and the cheapest stock in the group gets the smallest multiplier on earnings growth.
We switched to the three-year median, the very one that our own multiple-history builder had long ago declared the exit multiple. It works in both directions, and that matters. Tatneft rose from plus 21% to plus 75%, Surgutneftegas from 50 to 102%, NLMK from 10 to 47%, but Rosneft fell from 67 to 44%, Gazprom Neft from 62 to 41%, Severstal from plus 22 to zero.
The reversion to the median has to be damped if the multiple fell because earnings grew
A trap that is easy to fall into and worth remembering. EV/EBITDA falls for two completely different reasons.
If the stock got cheaper, reversion to the median is legitimate, and that is the upside. If EBITDA grew, the multiple fell mechanically, through the denominator, and demanding a return to the old median means paying the old multiple for the new, larger earnings. That is, counting earnings growth twice: once in the EBITDA forecast and a second time in the multiple.
Without protection this was caught at Yuzhuralzoloto (earnings up 2.28 times), Seligdar (1.97), Gazprom (1.54), Cherkizovo (1.49), RUSAL, En+ and partly Polyus. The rule is simple. If LTM EBITDA is g times above its three-year average, the re-rating coefficient is divided by g.
A hard discount for money that does not reach the minority shareholder
A separate axis that did not exist before. The governance multiplier answers the question "how is this company managed". We added a second one. Will the modeled upside reach the shareholder at all.
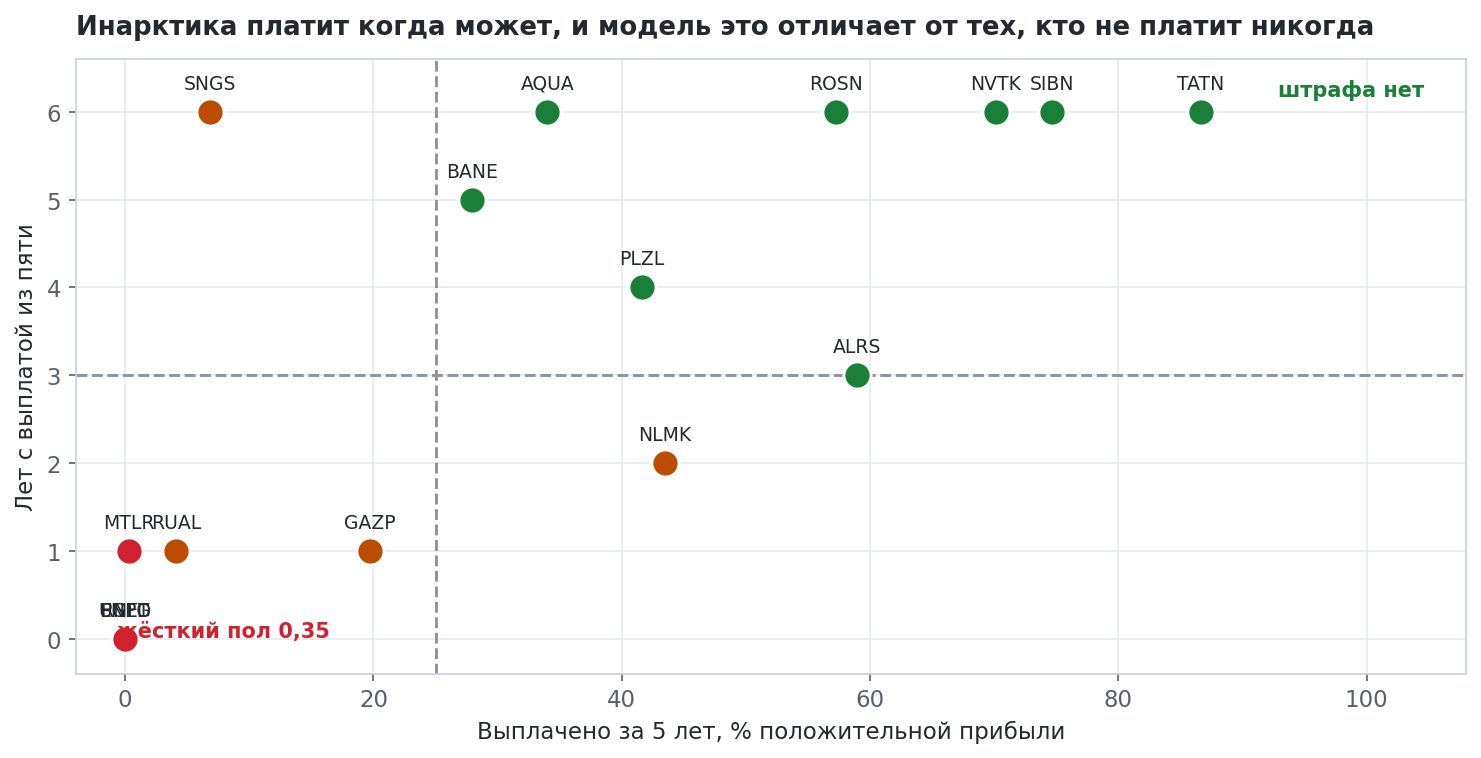
We measure the fact over five years. Dividends paid relative to the sum of positive profit, multiplied by the regularity of payments. The floor is hard, at 0.35.
Both components are mandatory, because each one on its own lies. Level without regularity praises a one-off payment. Gazprom paid out 19.7% of profit over five years, but paid in one year out of five. Regularity without level praises pennies. Surgutneftegas common pays every year, but pays out 6.8% of profit against RUB 2.57 trn earned.
The control test, for which the construction was made more complex, is this. Inarctica paid in each of the five years and paid out 34% of profit, multiplier 1.00, no penalty. It does not pay only in the latest period, and the model tells that apart from those that never pay.
Surgutneftegas preferred: the model was alive, but the showcase displayed a different one and had not updated for a week
A separate story, and it is not about the model but about how showcases diverge.
The Surgutneftegas preferred model in Frontier turned out to be fully alive. The price is taken from MOEX (a ten-minute VWAP on the futures), the OFZ curve and RUONIA are taken as of the date, and the inputs are updated by an overnight snapshot. Potential plus 8.8%.
The portal, however, showed plus 71.9%, and it was an entry from September 9, while the rest of the table had data up to the 15th. The cause was found quickly. The portal calculation turned out to be an orphan: it has not a single reference in the crons or in the code, and it was run by hand. On top of that it was wrong on three independent grounds, and all three inflated the potential. A tax of 16% against an actual effective rate of 32.6% and 35.5% in the reports; a fixed fair yield of 12.4% (the worst method in our own back-test); and the cash pile anchored in yuan when it is proven to be in dollars.
We made a single source of truth. Frontier publishes the result, the portal picks it up, and the portal's own calculation remains as a fallback in case of silence. The showcase now shows plus 8.8% and a target price that did not exist before.
Six bugs found along the way
They are not about the models, but each one cost real money or reputation.
- The recommendation books had not been rebuilt for six days, silently, with a return code of zero. The blacklist block was inserted in the middle of a function at zero indentation, and the whole of its body became unreachable code. Now an empty book fails the run.
- Twenty-five names published a dividend potential of minus 100% with a target price of zero. Among them were NLMK, PIK, Positive Technologies and Unipro, all with positive profit. The phrases "we do not expect a dividend" and "the stock is worth nothing" mean different things.
- At Russneft the system held a dividend of RUB 4.46 with an ex-date at the end of every quarter. This is a modeled split of the annual figure, which gave a fictitious 17.2% historical yield on a stock that paid nothing at all in 2023-2024.
- The "key price" chart for oil companies drew Brent under the label Urals, comparing the spot of one grade with the average of another.
- The panel for all Russian names claimed that the target capitalization is calculated at the historical multiple, whereas the model used the current one.
- Bashneft had not a single quality flag despite being controlled by Rosneft and the dividend falling from RUB 249.69 to RUB 69.29.
What we have not proved and what remains open
The list is honest, because it will be read by those who use the models.
- Predictive power over time is not confirmed, and this cannot be put down solely to the short Urals series. We need a real long history of the Russian price instead of our reconstruction, after which the test across periods has to be rerun.
- On net income the model does not work and will not work without a separate layer between EBITDA and profit. For now this means that it cannot be used to forecast dividends.
- Refining volumes by company remain our estimate; there is no primary source in any of the databases. The model prints the implied volume in millions of tonnes, and it needs to be checked against disclosure.
- LUKOIL's dividend model calculates the payout from net income, whereas the company's policy calculates it from adjusted free cash flow. 2025 profit collapsed because of deconsolidation, while the flow did not, and the model caught an accounting artifact.
- For Surgutneftegas preferred, the choice of tax rate and fair-yield method determines the sign of the potential. Our own back-test shows that the superiority of the chosen method is not proven.
- After all the fixes LUKOIL remains low in the ranking, and the multiple is not the reason: it trades exactly at its three-year median. What holds it down is leverage. Potential measures how much a move in EBITDA inflates equity, not how much cash reaches the shareholder. A company with no debt and a payout of almost the whole flow systematically loses to a company with debt and no payout. This is the next task.
See also: market overview · valuation map · stock screeners