Rusal: EBITDA soars 74.3%, but debt burden remains high
19 августа 2026 года Русал раскрыл результаты за первое полугодие 2026 года: выручка снизилась на 2,8% до 1 170 100 млн руб., а EBITDA выросла на 74,3% до 96 124,3 млн руб. (за последние 12 месяцев). Несмотря на впечатляющий рост операционной прибыльности, долговая нагрузка остаётся высокой: отношение чистого долга к EBITDA LTM составляет 6,56, а EV/EBITDA LTM – 10,8, что значительно ниже среднего за три года (19,1). На текущей цене акция выглядит привлекательно, учитывая потенциал роста по модели портала (+109%) и ожидаемую дивидендную доходность 12%.
Key takeaways
— EBITDA за полугодие выросла на 74,3% благодаря восстановлению цен на алюминий и контролю над затратами
— Маржа EBITDA удвоилась до 13,8% с 7,7% годом ранее, но чистая рентабельность остаётся скромной – 5,0%
— Чистый долг увеличился на 146,4 млрд руб. за 12 месяцев, и отношение к EBITDA LTM составляет 6,56
— EV/EBITDA LTM (10,8) значительно ниже трёхлетнего среднего (19,1), что указывает на недооценку
— Дивиденды за последние 12 месяцев не выплачивались, но модель оценивает справедливую доходность в 12%
— Капитальные затраты в первом полугодии составили 646 млн долл., что превышает операционный денежный поток в 400 млн долл.
— По модели портала, потенциал роста акции составляет +109% к справедливой стоимости
Attractiveness
Key figures, RUB bn
| Metric | H1 2025 | H1 2026 | Change |
|---|---|---|---|
| Revenue | 657 | 639 | -2.8% |
| EBITDA | 50.6 | 88.2 | +74.3% |
| Operating profit | 22.0 | 60.1 | +172.9% |
| Net profit | -7.60 | 32.1 | to profit |
| Operating cash flow | 77.6 | 30.6 | -60.5% |
| Capex | 1.05 | 0.46 | -56.1% |
| EBITDA margin | 7.7% | 13.8% | +6.1 pp |
| Net margin | -1.2% | 5.0% | +6.2 pp |
EBITDA for the half-year rose 74.3% thanks to recovering aluminium prices and cost control
For the first half of 2026, Rusal's EBITDA reached RUB 96,124.3 million (LTM), up 74.3% from the same period last year. This jump in operating profit came despite a 2.8% decline in revenue, indicating a significant improvement in efficiency.
The main driver was the recovery in global aluminium prices, as well as cost optimisation measures. In the report, the company notes that segment EBITDA of the aluminium segment rose from USD 534 million to USD 1,570 million for the half-year, while the alumina segment posted a loss of USD 178 million versus a profit of USD 309 million a year earlier.
EBITDA margin doubled to 13.8% from 7.7% a year earlier, but net margin remains modest at 5.0%
EBITDA margin for the first half of 2026 was 13.8% versus 7.7% for the same period in 2025. This reflects not only higher aluminium prices but also lower unit production costs.
However, net margin remains low – just 5.0% (a year earlier there was a loss). The reason is high finance costs: for the half-year they amounted to USD 832 million versus USD 584 million a year earlier, due to higher debt and interest rates.
Net debt increased by RUB 146.4 billion over 12 months, and the ratio to LTM EBITDA stands at 6.56
At the end of the first half of 2026, Rusal's net debt stood at RUB 630,301.1 million, up RUB 146.4 billion over the last 12 months. The ratio of net debt to LTM EBITDA is 6.56, which is a high level for a metals company.
The increase in debt is related to capital expenditures and working capital replenishment. In the report, the company notes that for the half-year capital expenditures amounted to USD 646 million, while operating cash flow was only USD 400 million, leading to a shortfall in covering investments with own funds.
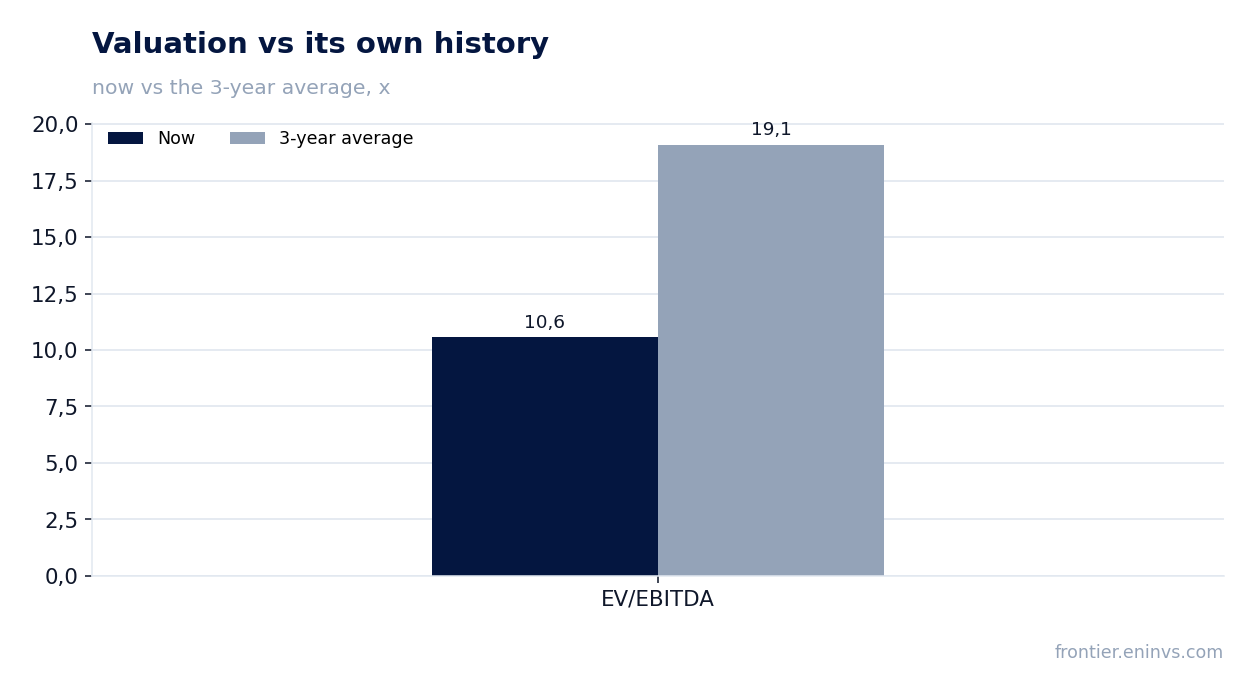
EV/EBITDA LTM (10.8) is significantly below the three-year average (19.1), indicating undervaluation
The current EV/EBITDA LTM multiple is 10.8, almost half the average over the last three years (19.1). This suggests that the market is valuing the company cheaper than its own history.
Given that EBITDA is growing and debt burden remains high, the discount may reflect investor concerns about the company's ability to service debt and pay dividends. However, if aluminium prices remain at current levels, EBITDA will continue to grow, which could lead to a re-rating of the shares.
No dividends paid over the last 12 months, but the model estimates a fair yield of 12%
Over the last 12 months, Rusal has not paid dividends, due to high debt and the need to finance capital expenditures. However, our model estimates a fair dividend yield for this stock at 12%, implying a payout ratio of 0.16 of profit.
If the company starts paying dividends at this level, it would be a significant catalyst for the shares. But this would require a substantial reduction in debt burden or an increase in profit, which is not yet obvious.
Capital expenditures in the first half-year amounted to USD 646 million, exceeding operating cash flow of USD 400 million
In the first half of 2026, Rusal's capital expenditures amounted to USD 646 million, while operating cash flow was only USD 400 million. This means the company is financing investments through debt, leading to an increase in net debt.
Such a gap between CAPEX and operating cash flow is not sustainable in the long term. The company needs either to reduce investments or increase operating cash flow to stabilise its debt burden.
According to the portal's model, the stock's upside potential is +109% to fair value
Our portal's model, based on repricing EBITDA at current commodity prices and target EV/EBITDA, shows that the stock has an upside potential of +109% to fair value. This is the strongest signal in favour of buying.
However, this potential will only materialise if aluminium prices remain at current levels or rise, and the company can cope with its debt burden. Otherwise, the discount may persist.
Valuation on the latest reported figures
| Metric | Value |
|---|---|
| Market cap | 409 bn ₽ |
| EV/EBITDA (LTM) | 10.8 |
| P/B | 0.44 |
| Net debt / EBITDA (LTM) | 6.56 |
| Operating cash flow (LTM) | 87.5 bn |
| ROE | 6.8% |
| EV/EBITDA, 3-year average | 19.1 |
Bottom line
Rusal showed strong EBITDA growth in the first half of 2026, doubling its margin, but this did not translate into adequate net profit growth due to high finance costs. Debt burden remains high, and cash flow does not cover capital expenditures, forcing the company to increase debt. Nevertheless, the stock's valuation is significantly below its own history, and the portal's model indicates an upside potential of +109%. At the current price, the stock looks attractive, but the realisation of this potential depends on the stability of aluminium prices and the company's ability to reduce debt.
Open the company's financial profile RUAL →
See also: market overview · valuation map · stock screeners