Seligdar: H1 EBITDA doubles, but free cash flow turns negative
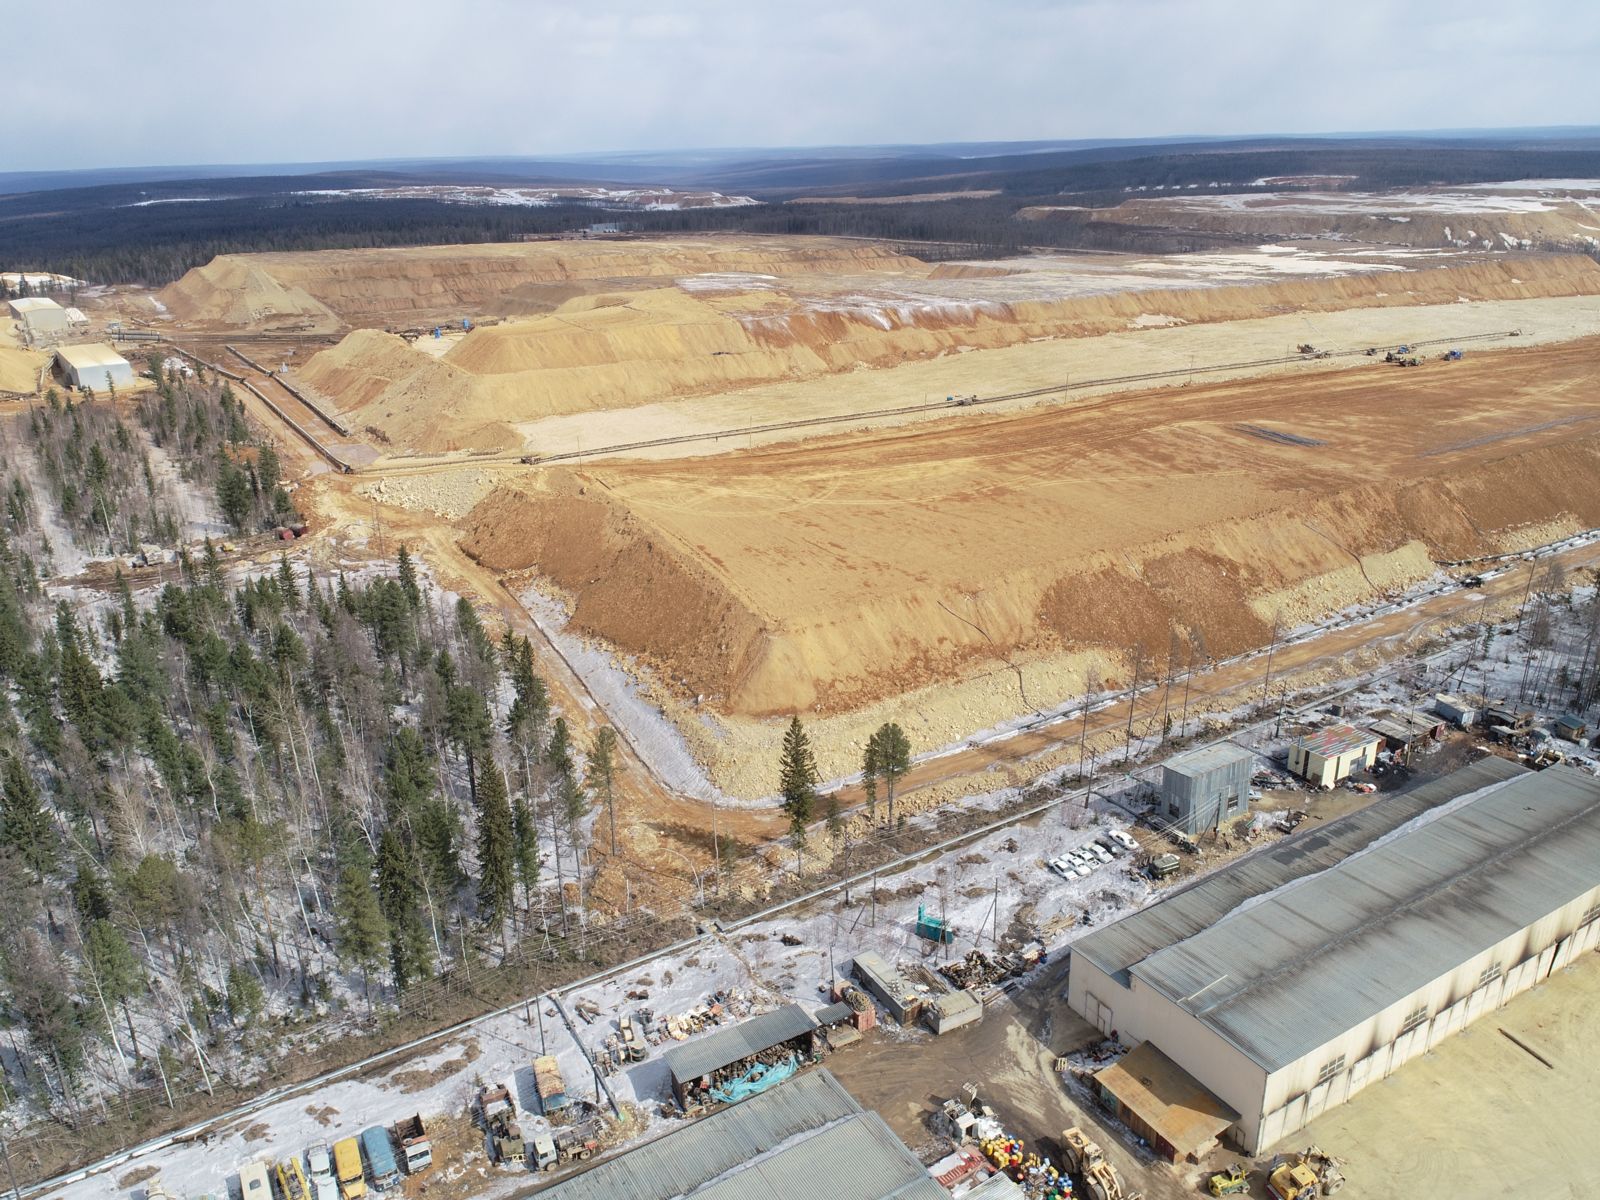
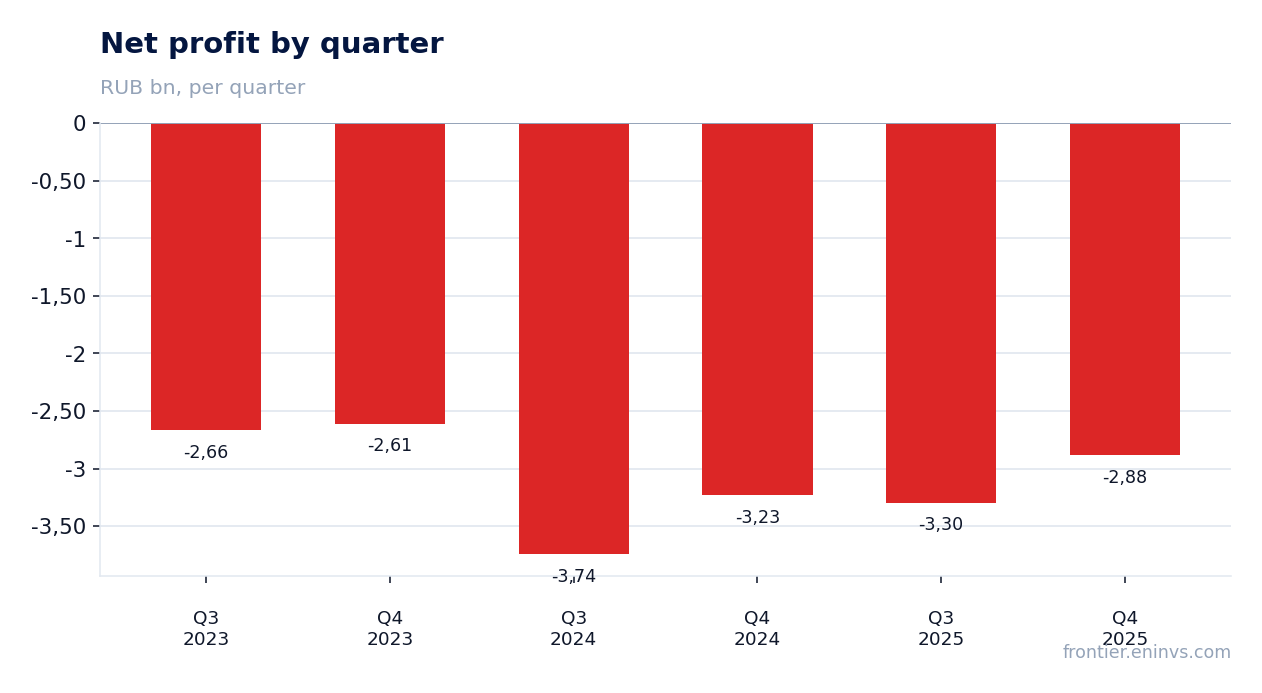
On August 28, Seligdar reported H1 2026 results: revenue grew 46.5% to RUB 41,662 million, and EBITDA jumped 145.6% to RUB 15,831 million. However, operating cash flow for the half-year was minus RUB 8,727 million versus minus RUB 13,966 million a year earlier, and after capex free cash flow is even more negative. At the current price, the share looks unattractive: EV/EBITDA LTM is 5.1x, and the portal's model implies 39% downside.
Key takeaways
— H1 EBITDA doubled on revenue growth and margin expansion
— Operating cash flow remains negative due to inventory build-up and interest payments
— Net debt/EBITDA LTM stands at 4.08x, with net debt up RUB 49.1 billion over the year
— Capex increased, but free cash flow turned negative
— No dividends paid over the last 12 months; model expects zero payouts
— Portal's model implies the share trades 39% above fair value
Attractiveness
Key figures, RUB bn
| Metric | H1 2025 | H1 2026 | Change |
|---|---|---|---|
| Revenue | 28.4 | 41.7 | +46.5% |
| EBITDA | 5.35 | 13.1 | +145.6% |
| Operating profit | 0.01 | 7.31 | +50116.3% |
| Net profit | -2.16 | 3.39 | to profit |
| Operating cash flow | -14.0 | -8.73 | — |
| Capex | 4.04 | 5.24 | +29.6% |
| EBITDA margin | 18.8% | 31.5% | +12.7 pp |
| Net margin | -7.6% | 8.1% | +15.7 pp |
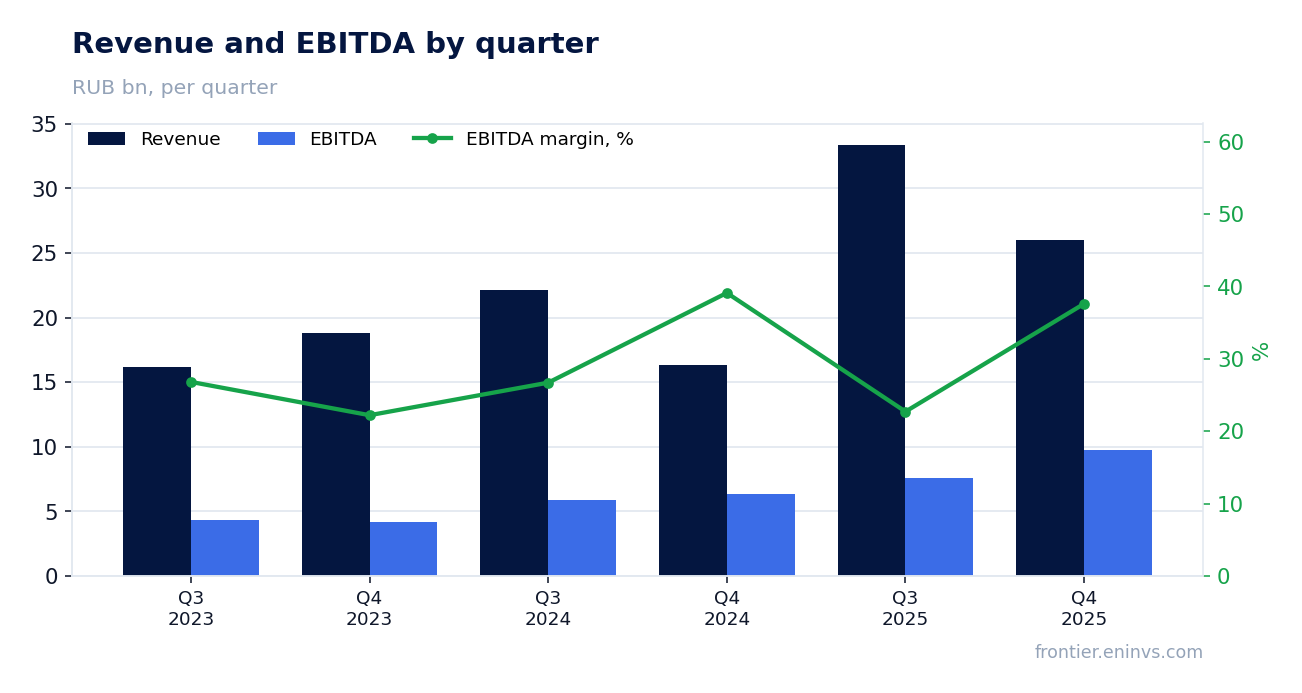
H1 EBITDA doubled on revenue growth and margin expansion
In H1 2026, Seligdar's revenue grew 46.5% YoY to RUB 41,662 million, and EBITDA rose 145.6% to RUB 15,831 million. EBITDA margin expanded from 18.8% to 31.5%. The gold division contributed the most: its revenue reached RUB 33,080 million versus RUB 23,956 million a year earlier, and divisional EBITDA grew from RUB 8,617 million to RUB 12,637 million.
The tin division also improved: revenue increased from RUB 4,467 million to RUB 8,570 million, and EBITDA from RUB 403 million to RUB 3,194 million. Higher gold and tin prices, along with increased production volumes, were the main drivers.
Operating cash flow remains negative due to inventory build-up and interest payments
Despite profit growth, operating cash flow for H1 2026 was minus RUB 8,727 million (versus minus RUB 13,966 million a year earlier). The main reason is a significant inventory build-up: changes in inventories consumed RUB 11,644 million versus RUB 9,234 million a year earlier. Interest payments also rose: interest paid reached RUB 9,015 million versus RUB 5,867 million.
On the positive side, changes in accounts payable and advances received contributed plus RUB 5,438 million versus RUB 169 million a year earlier. Still, cash flow from operations before taxes and interest remained negative at minus RUB 2,006 million.
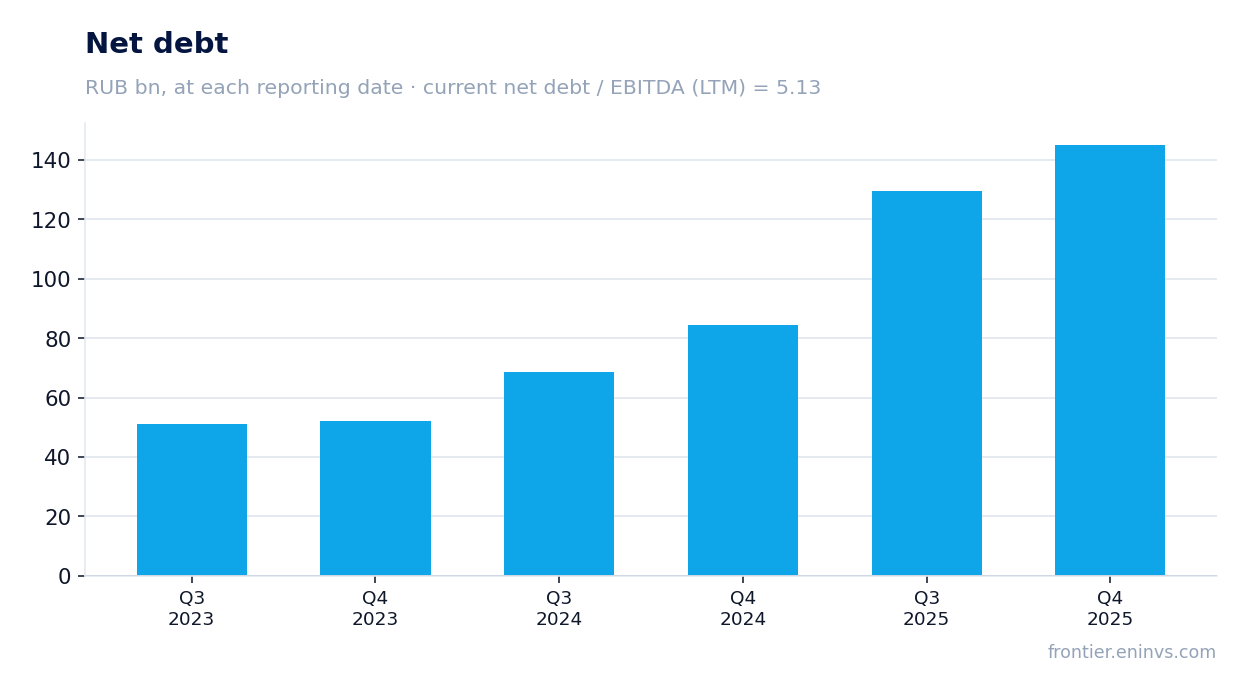
Net debt/EBITDA LTM stands at 4.08x, with net debt up RUB 49.1 billion over the year
At the end of H1 2026, Seligdar's net debt stood at RUB 145,161 million, up RUB 49.1 billion over the last 12 months. Net debt/EBITDA LTM is 4.08x. The increase is related to an active investment program and working capital financing.
Interest expenses for the half-year rose to RUB 11,307 million versus RUB 6,798 million a year earlier, reflecting both higher debt and elevated rates. The company raised new loans: proceeds amounted to RUB 29,870 million, repayments to RUB 14,403 million.
Capex increased, but free cash flow turned negative
Capital expenditures for H1 2026 amounted to RUB 5,235 million (plus capitalized interest of RUB 779 million), up from RUB 4,041 million a year earlier. Given the negative operating cash flow, free cash flow was deeply negative.
Investing activities also included loans issued of RUB 4,539 million (versus RUB 3,914 million a year earlier). The company continues to invest in development, but current cash flow does not cover investment needs, increasing reliance on debt financing.
No dividends paid over the last 12 months; model expects zero payouts
Over the last 12 months, Seligdar paid no dividends – RUB 0.0 per share. Our model also estimates the next payout at RUB 0.0 per share. Given a fair yield of 10.5% for this name, the absence of payouts makes the share less attractive for income investors.
The model's implied payout ratio is 0.79 of profit, but with zero actual payouts it is theoretical. As long as the company channels funds into investments and debt service, dividend prospects remain unclear.
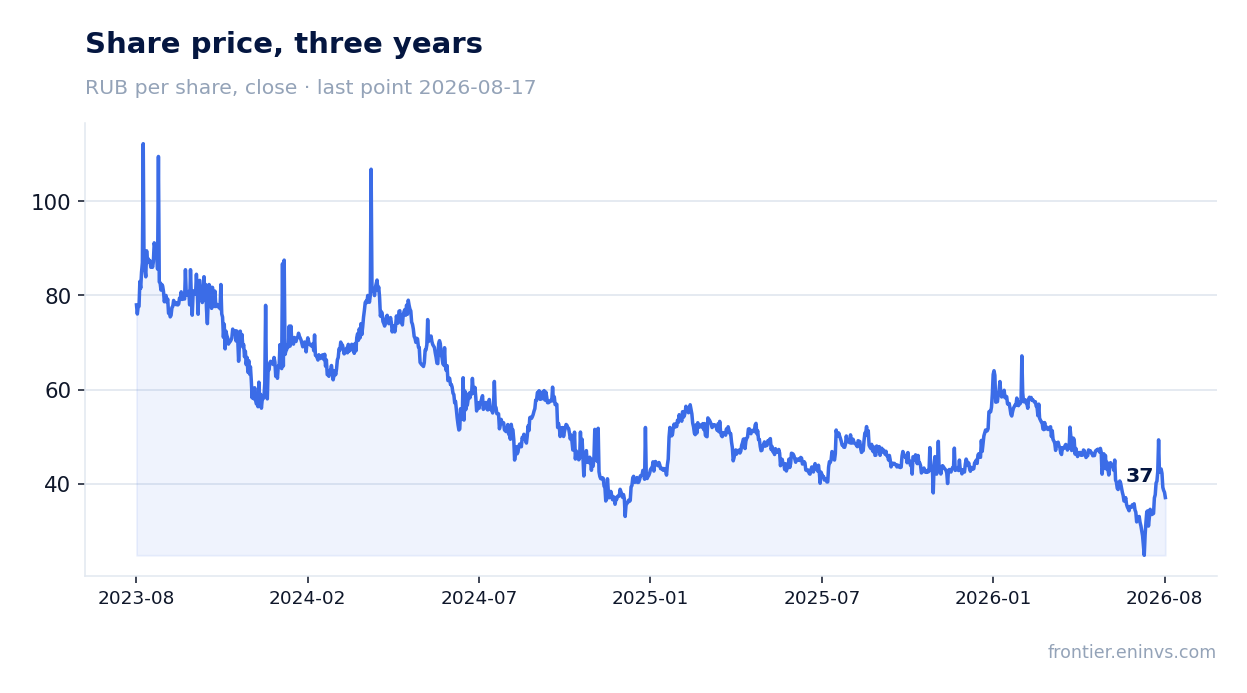
Portal's model implies the share trades 39% above fair value
Our portal's model, which re-prices EBITDA at current commodity prices and applies a target EV/EBITDA multiple, shows the share trades 39% above fair value. This suggests the market has already priced in significant growth, and further upside is limited.
With a market cap of RUB 35,885 million and EV/EBITDA LTM of 5.08x, the valuation does not look cheap, especially given the debt burden and negative free cash flow.
Valuation on the latest reported figures
| Metric | Value |
|---|---|
| Market cap | 35.9 bn ₽ |
| EV/EBITDA (LTM) | 5.1 |
| P/B | 3.38 |
| Net debt / EBITDA (LTM) | 4.08 |
| Operating cash flow (LTM) | 35.1 bn |
| ROE | 55.1% |
Bottom line
In H1 2026, Seligdar delivered strong EBITDA growth of 145.6%, driven by high gold and tin prices and margin expansion to 31.5%. However, operating cash flow remains negative, free cash flow is deeply negative, and net debt/EBITDA LTM of 4.08x with net debt up RUB 49.1 billion over the year raise concerns. At the current price, the share looks unattractive: EV/EBITDA LTM is 5.08x, and the portal's model implies 39% downside. A sustainable positive free cash flow and lower leverage would be needed to change the assessment.
Open the company's financial profile SELG →
See also: market overview · valuation map · stock screeners