Seligdar: gold rose 26.8% but EBITDA fell 34% – profit came from FX, not from metal
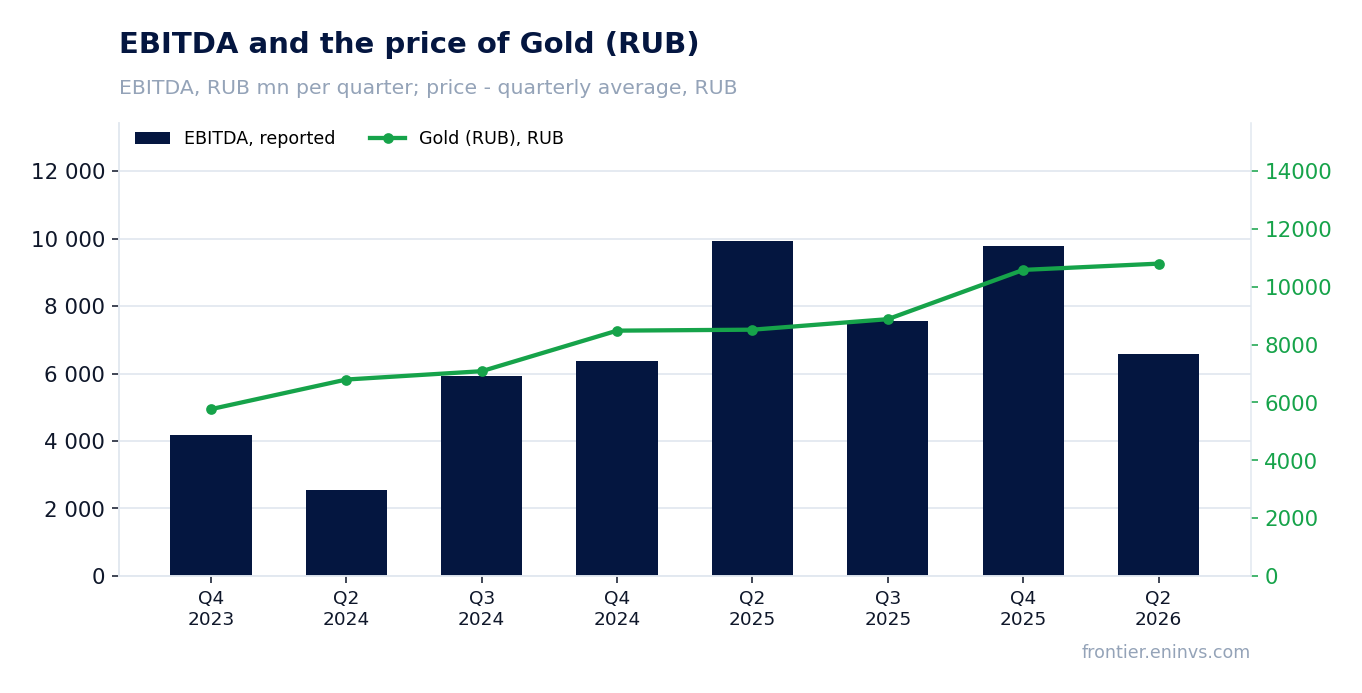
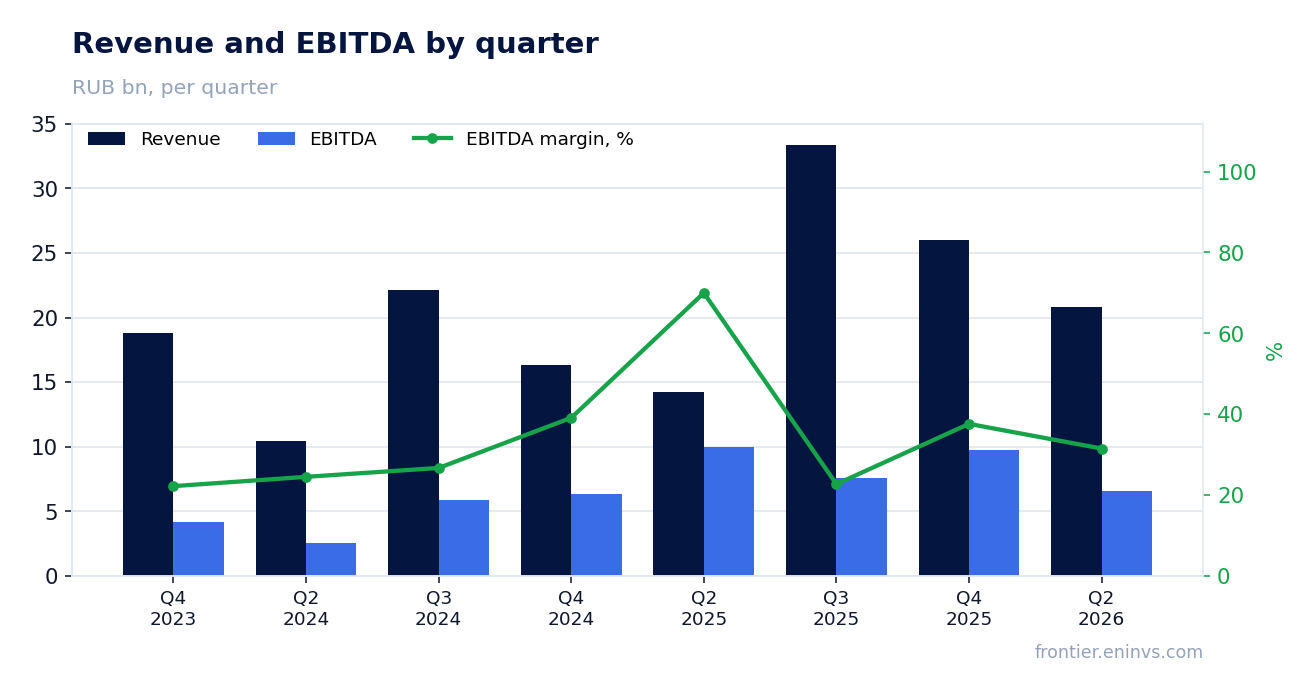
On 28 August Seligdar released its Q2 2026 results. The average rouble gold price in the period was 10,801 RUB versus 8,516 RUB a year earlier (+26.8%), revenue rose 46.6% to 20.8 bn RUB, but EBITDA fell 34.0% to 6.6 bn RUB and the margin compressed from 70.0% to 31.5%. At the year-ago volumes and costs, our calculation puts EBITDA at 13.2 bn RUB – the company earned 6.6 bn less, and the gap sits in costs, not in price. With EV/EBITDA at 5.2 and net debt at 4.35 EBITDA the share looks neutral: no dividend was paid over the last 12 months, and the portal model implies negative upside.
Key takeaways
— Rouble gold rose 26.8% year on year but fell 11.5% quarter on quarter
— At the year-ago volumes and costs EBITDA should have been 13.2 bn RUB; it came in at 6.6 bn – costs ate the gap
— Revenue growth of 46.6% was carried by the gold division, while the tin division delivered its first gross profit
— Half-year operating cash flow went to minus 8.7 bn RUB on inventory build and interest paid
— Net debt rose to 155.2 bn RUB at 4.35 EBITDA, with half-year interest at 11.3 bn RUB
— No dividend was paid over the last 12 months, and our estimate for the current year is zero
— The portal spot model puts EBITDA at current prices at 36.7 bn RUB, yet the implied upside is negative
Attractiveness
Key figures, RUB bn
| Metric | Q2 2025 | Q2 2026 | Change |
|---|---|---|---|
| Revenue | 14.2 | 20.8 | +46.6% |
| EBITDA | 9.94 | 6.57 | -34.0% |
| Operating profit | 7.28 | 3.65 | -49.8% |
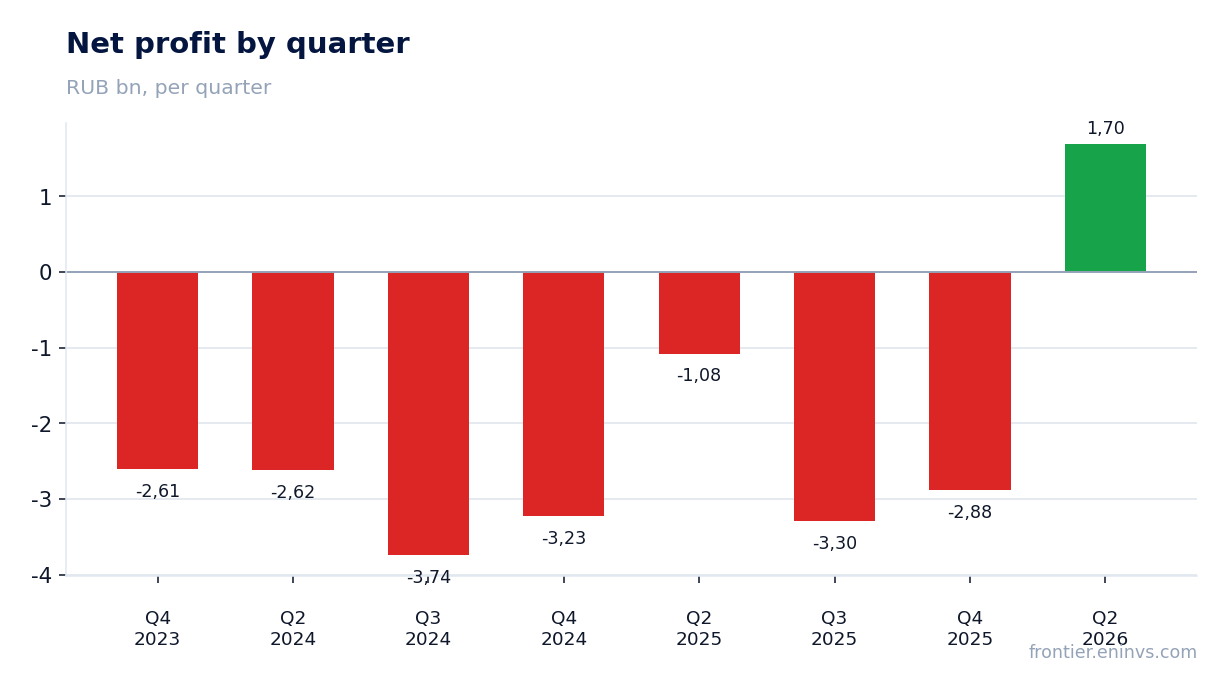
| Net profit | -1.08 | 1.70 | to profit |
| Operating cash flow | -6.98 | -4.36 | — |
| Capex | 2.02 | 2.62 | +29.6% |
| EBITDA margin | 70.0% | 31.5% | -38.5 pp |
| Net margin | -7.6% | 8.1% | +15.7 pp |
Rouble gold rose 26.8% year on year but fell 11.5% quarter on quarter
The average rouble gold price in Q2 2026 was 10,801 RUB versus 8,516 RUB a year earlier – up 26.8%. This is the main external driver of the report: gold accounts for about 85% of revenue in the portal model, and a higher metal price should have lifted both revenue and margin directly.
The price sequence matters more than the annual comparison, though. Quarter on quarter the average fell 11.5%, from 12,200 to 10,801 RUB. Spot is now 10,730 RUB, 0.7% below the reported-period average. The price backdrop in Q2 was therefore weaker than in Q1, and by the release date it had not improved.
For a producer this means revenue got price support year on year, while the quarterly price move worked against the result. Forward EBITDA depends on whether the price holds near 10.7 thousand RUB or returns to the levels of early 2026.
Commodity prices: period average and now
| Benchmark | Year ago | Q2 2026 | YoY | Spot 2026-11-06 |
|---|---|---|---|---|
| Gold (RUB), RUB | 8 516 | 10 801 | +26,8% | 10 730 |
At the year-ago volumes and costs EBITDA should have been 13.2 bn RUB; it came in at 6.6 bn – costs ate the gap
At the year-ago volumes and non-commodity costs, holding only the reported-period prices, our calculation puts revenue at 17,455.6 mn RUB (price effect +3,241.3 mn RUB, or +22.8%) and EBITDA at 13,185.9 mn RUB. Actual revenue was 20,831.3 mn RUB, 3,375.7 mn above the implied figure, while EBITDA was 6,566.8 mn RUB, 6,619.1 mn below it.
The gap cannot be explained by price: price worked in the company's favour. Revenue 19.3% above the implied level alongside weaker EBITDA means costs rose together with volumes or one-off non-producing revenue. The release states that revenue includes resale of third-party gold – 33.6 mn RUB in H1 2026 – but that amount is small and does not close the gap.
The main candidate is cost of sales. In H1 operating costs rose to 30,758.7 mn RUB from 22,179.2 mn a year earlier, including third-party ore mining services from 7,561.1 to 11,692.3 mn RUB and MET from 2,497.1 to 4,845.99 mn RUB. Part of the MET increase reflects the higher metal price, part reflects volume. It is this cost and tax growth that turned a price tailwind into a 34.0% EBITDA decline.
The EBITDA margin fell from 70.0% to 31.5%. That is not a price effect – price rose. It is the effect of unit costs rising faster than revenue, and the release does not break the increase down enough to separate volume growth from price growth line by line.
What the prices implied and what the company earned
| Base (Q2 2025) | Implied at period prices | Reported | Reported vs implied | |
|---|---|---|---|---|
| Revenue, RUB mn | 14 214 | 17 456 | 20 831 | +19,3% |
| EBITDA, RUB mn | 9 945 | 13 186 | 6 567 | -50,2% |
Revenue growth of 46.6% was carried by the gold division, while the tin division delivered its first gross profit
Q2 2026 revenue was 20,831.3 mn RUB, 46.6% above a year earlier. H1 revenue reached 41,662.3 mn RUB versus 28,429.3 mn – growth of 46.5%. The gold division contributed 33,080.3 mn RUB, the tin division 8,569.6 mn RUB.
The tin division delivered a gross profit for the first time: 2,718.4 mn RUB versus a gross loss of 100.9 mn a year earlier. Its revenue rose from 4,467.4 to 8,569.6 mn RUB. This is an important shift: the segment is no longer loss-making at the gross level, although its half-year operating profit was only 984.4 mn RUB versus a loss of 2,186.4 mn a year earlier.
The gold division remains the core: its half-year gross profit rose from 7,905.3 to 12,565.9 mn RUB and EBITDA from 8,616.7 to 12,637.5 mn RUB. But the division's half-year operating profit was 6,377.8 mn RUB versus 2,191.6 mn a year earlier, and the difference between gross and operating profit is commercial, administrative and other costs, which also grew.
The release does not disclose quarterly segment revenue, so Q2 cannot be compared with Q1 by division. The half-year data show that revenue growth was almost entirely gold, while tin added profit at the gross-margin level.
Half-year operating cash flow went to minus 8.7 bn RUB on inventory build and interest paid
H1 2026 operating cash flow was minus 8,727.4 mn RUB versus minus 13,966.1 mn a year earlier. There is an improvement, but the flow remains negative. Q2 was also negative at minus 4,363.7 mn RUB.
The cause is working capital and interest. Inventories rose 11,643.8 mn RUB in the half-year and receivables 4,955.1 mn RUB. At the same time interest paid reached 9,015.0 mn RUB versus 5,866.5 mn a year earlier, and income tax 2,359.0 mn RUB. Even with cash flow before tax and interest up to 2,005.8 mn RUB, that was not enough.
Inventories grew mainly on gold in processing, from 18,247.1 to 27,894.9 mn RUB, and finished goods. The company has accumulated metal not yet sold. At the current price that is a reserve of future revenue, but in the reported period it consumed cash.
Half-year capex was 5,235.1 mn RUB versus 4,040.6 mn a year earlier. Together with negative operating cash flow this means investment was funded by debt rather than by internal funds.
Net debt rose to 155.2 bn RUB at 4.35 EBITDA, with half-year interest at 11.3 bn RUB
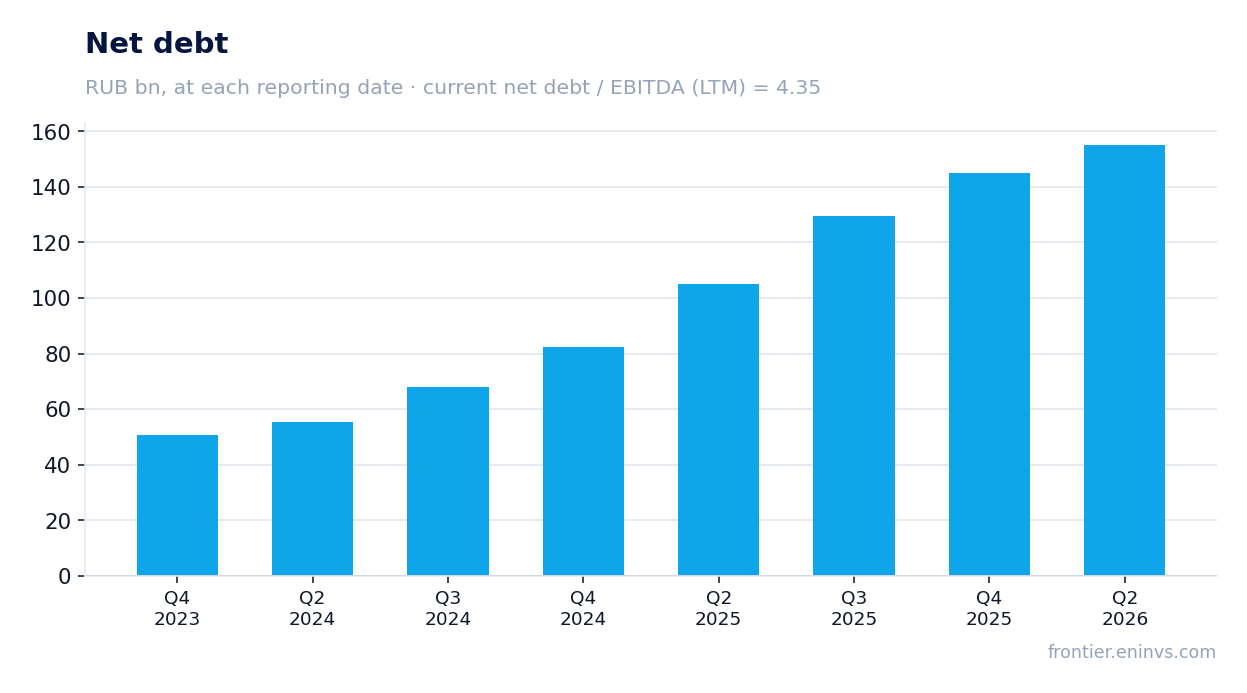
Net debt at 30 June 2026 was 155,187.5 mn RUB. From 31 December 2025 it rose from 145.2 to 155.2 bn RUB (+10.0 bn), and over 12 months from 105.1 to 155.2 bn RUB (+50.1 bn). The ratio of net debt to trailing-twelve-month EBITDA is 4.35.
Interest on loans payable in the half-year was 11,219.0 mn RUB versus 6,730.5 mn a year earlier, plus lease interest of 88.4 mn RUB. Total finance costs were 9,929.4 mn RUB – more than the half-year operating profit of 7,309.5 mn RUB. The company earns less from operations than it pays on debt.
At the same time interest income rose to 2,184.7 mn RUB and FX gains were 6,523.6 mn RUB. It was FX, not operations, that produced the positive financial result. H1 pre-tax profit was 3,903.6 mn RUB versus a loss of 2,250.7 mn a year earlier.
Loans grew in the half-year: proceeds 29,870.0 mn RUB, repayments 14,402.7 mn RUB. The company is actively refinancing and increasing debt. With the key rate at 14.0% debt service remains expensive, and that is the main risk to profit.
No dividend was paid over the last 12 months, and our estimate for the current year is zero
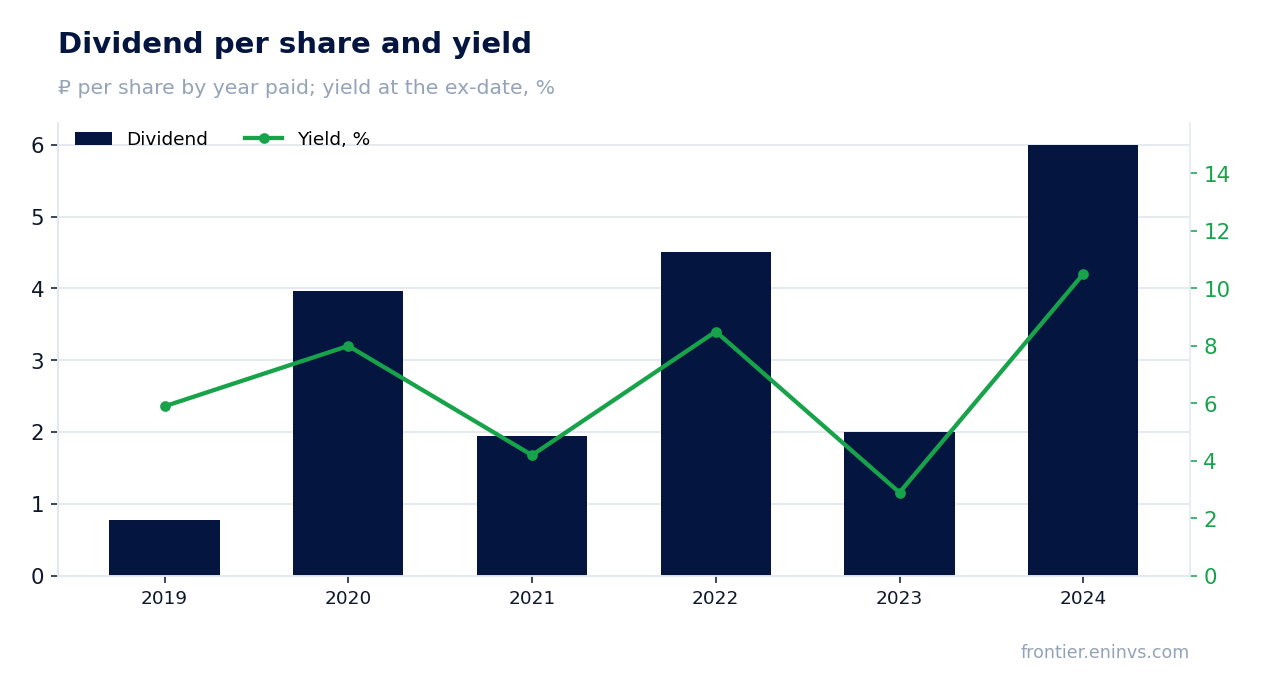
No dividend was paid over the last 12 months: 0.0 RUB per share, trailing yield 0.0%. The last payment in the history was 6.0 RUB per share for 2024, a 10.5% yield at the ex-date. Before that there were 2.0 RUB for 2023 and 4.5 RUB for 2022.
Our canonical-model estimate of the annual dividend is 0.0 RUB per share, i.e. we do not expect a payment in the current year. The model starts from profit, and the profit base is negative at minus 4,592.0 mn RUB. With a payout ratio of 0.79 of profit, a negative base gives a zero dividend. The free-cash-flow cap does not bind.
The yield we consider fair for this name is 10.5%. With the key rate at 14.0% and a zero current payment, the dividend history does not support the price. For a dividend name this is the main argument against: the buyer is paying for profit that is largely formed by FX gains rather than by cash flow.
What would change the picture: sustainable positive operating profit rather than currency revaluation, and lower debt that would reduce interest costs. Neither is in the report yet. The board decides on the payment, and our estimate is a calculated figure, not a guarantee.
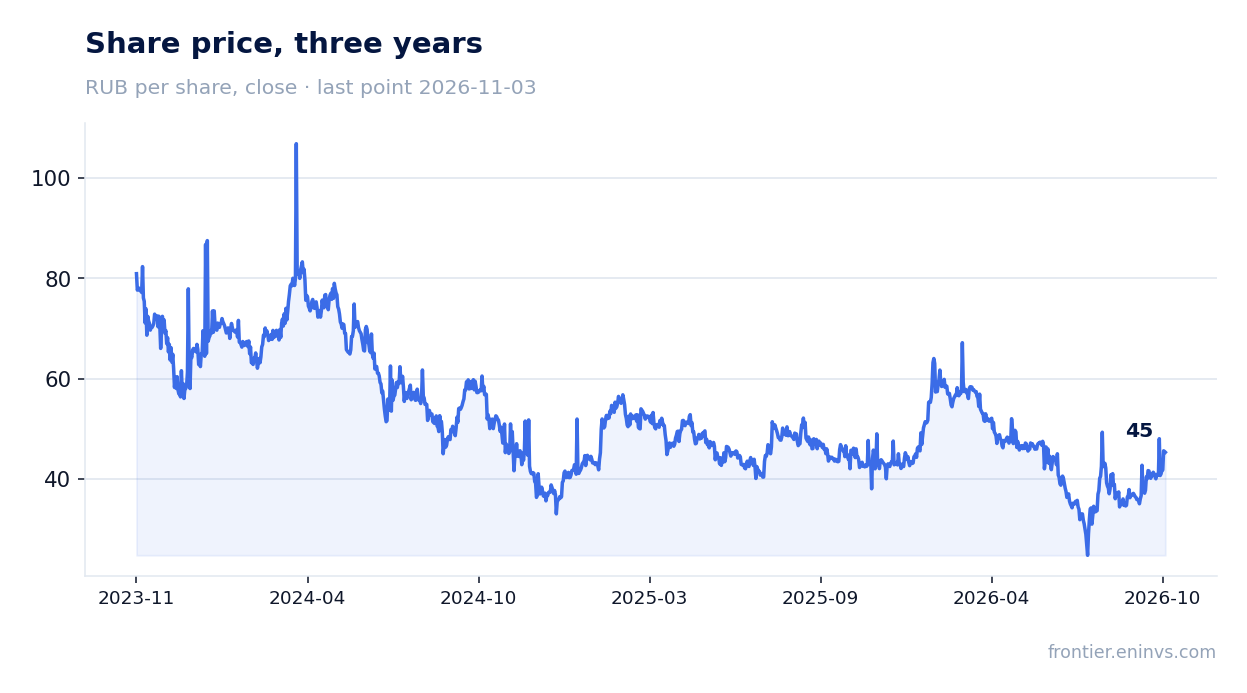
The portal spot model puts EBITDA at current prices at 36.7 bn RUB, yet the implied upside is negative
The portal spot model puts annual EBITDA at current commodity prices at 36,745.7 mn RUB versus trailing-twelve-month EBITDA of 37,576.8 mn – 2.2% lower. Current prices are therefore close to the 12-month averages and give no price advantage.
At current prices EV/EBITDA is 5.3 and net debt to EBITDA 4.22. Market capitalisation is 38,954.6 mn RUB against net debt of 155,187.5 mn – debt is four times equity. That is the key feature of the share: equity is a thin layer over a large debt.
The portal model puts the upside to fair value at minus 86%. This is our own estimate, not a market consensus and not a target price. It reflects the fact that at current gold prices and current debt the fair value of equity is below the market price.
A return on equity of 48.4% looks high, but it is calculated on a small equity base and includes FX gains. For valuing the share, EV/EBITDA of 5.2 and net debt of 4.35 EBITDA matter more. With gold near 10.7 thousand RUB and the key rate at 14.0%, the share does not look cheap.
Valuation on the latest reported figures
| Metric | Value |
|---|---|
| Market cap | 39.0 bn ₽ |
| EV/EBITDA (LTM) | 5.2 |
| P/B | 3.67 |
| Net debt / EBITDA (LTM) | 4.35 |
| Operating cash flow (LTM) | 35.1 bn |
| ROE | 48.4% |
Dividend per share, ₽, and yield at the ex-date
| Year paid | Dividend | Yield |
|---|---|---|
| 2019 | 0.78 | 5.9% |
| 2020 | 3.97 | 8.0% |
| 2021 | 1.95 | 4.2% |
| 2022 | 4.50 | 8.5% |
| 2023 | 2.00 | 2.9% |
| 2024 | 6.00 | 10.5% |
Bottom line
What was strong in the report was gold: the rouble price rose 26.8%, revenue 46.6%, and the tin division delivered its first gross profit. But the profit came not from metal or production but from FX gains of 6.5 bn RUB and from a gold price rise that did not reach EBITDA because of cost growth. At the year-ago volumes and costs our calculation puts EBITDA at 13.2 bn RUB against 6.6 bn reported – a 6.6 bn gap explained by cost of sales and MET. Net debt of 155.2 bn RUB at 4.35 EBITDA and interest costs of 11.3 bn RUB in the half-year are the main constraint. No dividend was paid over the last 12 months, and our estimate for the current year is zero. With EV/EBITDA at 5.2 and negative upside on the portal model, the share looks neutral: the price already reflects expensive gold but not the weak cash flow and the debt.
Open the company's financial profile SELG →
See also: market overview · valuation map · stock screeners