SFI Holding: loss driven by VSK impairment, yet dividend yield remains high
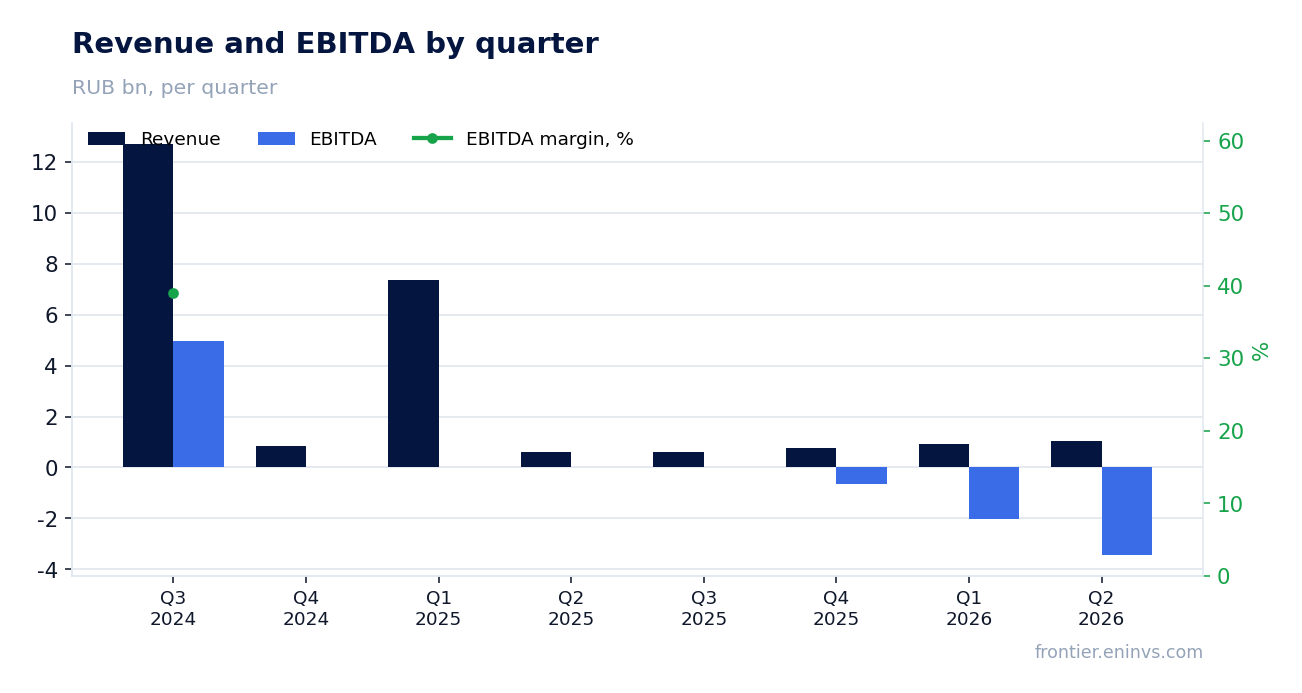
On August 28, SFI Holding reported Q2 2026 results: revenue grew 69.0% YoY to RUB 1,052 million, but the net loss was RUB 3,449 million due to a RUB 4,289 million impairment of its investment in VSK. This review examines what lies behind these figures and why the trailing 12-month dividend yield reached 185.2%.
Key takeaways
— Q2 revenue grew 69.0% YoY, but from a low base after a 91.6% decline a year earlier
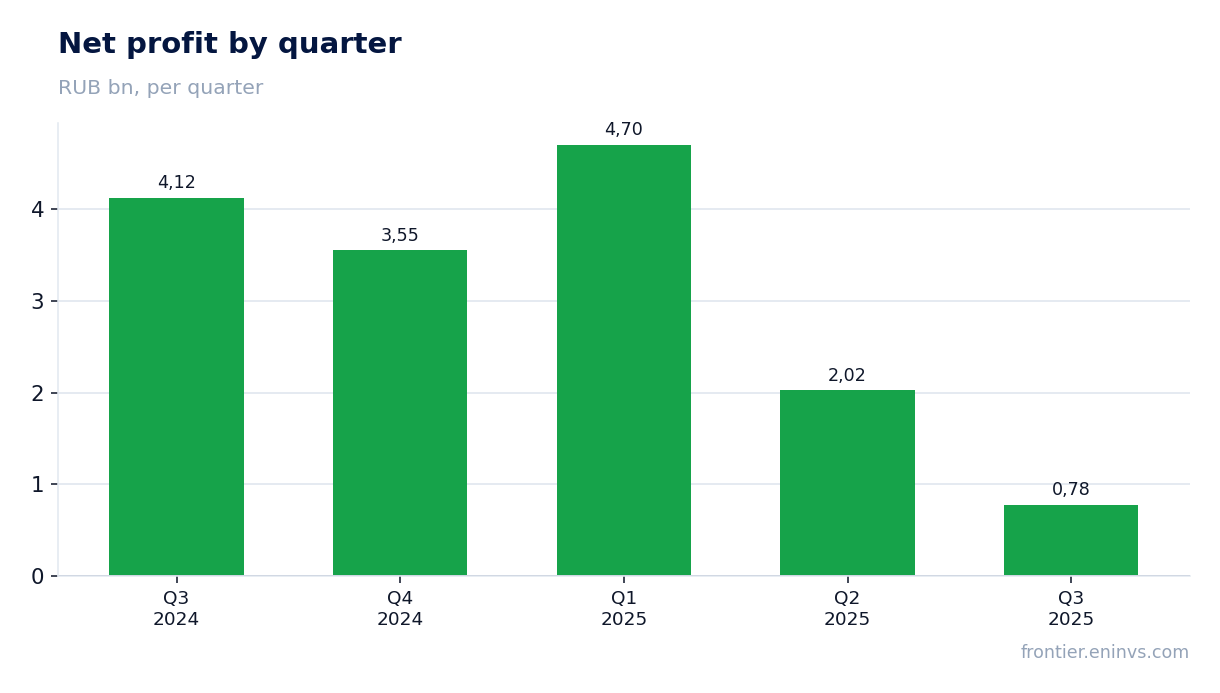
— The net loss of RUB 3,449 million was driven by a RUB 4,289 million impairment of the VSK investment
— EBITDA margin was minus 327.9% in Q2 due to an operating loss
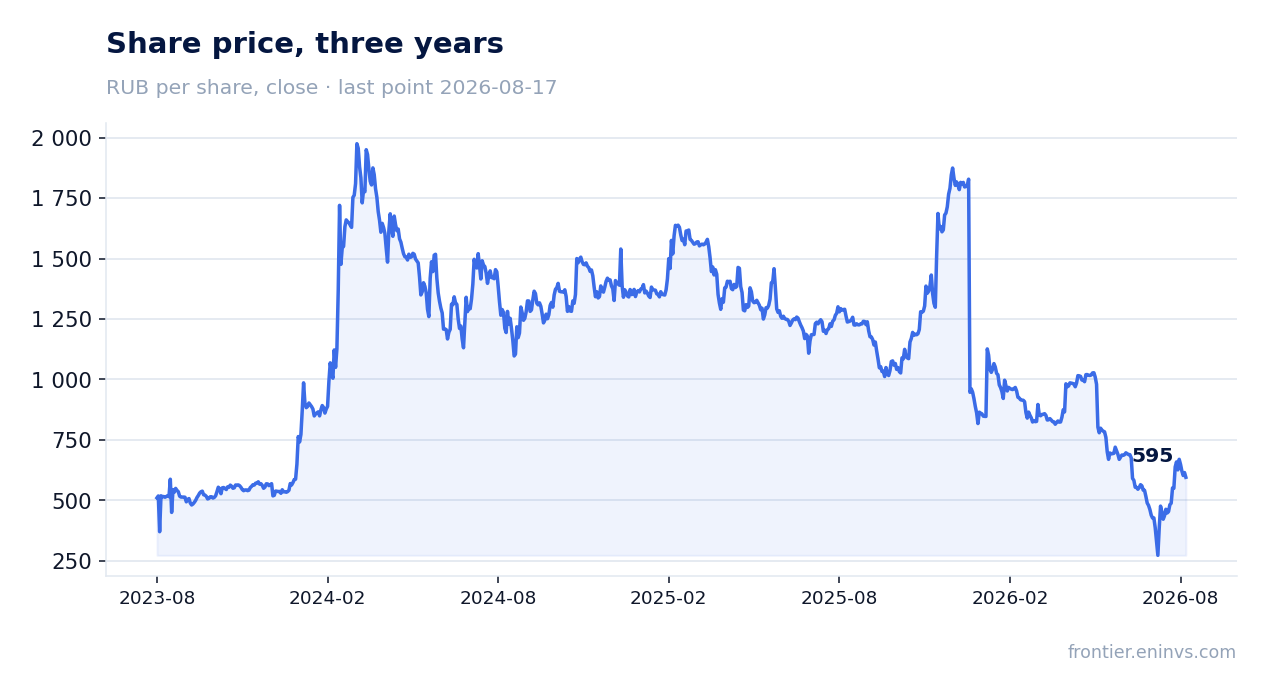
— Trailing 12-month dividend yield reached 185.2% with a payout of RUB 1,074 per share
— P/E LTM stands at 1.42, reflecting low trailing earnings
— Operating cash flow is negative, but for a holding company this is not a performance indicator
— The key rate was cut from 16% to 14.25% in H1 2026, affecting financial results
Key figures, RUB bn
| Metric | Q2 2025 | Q2 2026 | Change |
|---|---|---|---|
| Revenue | 0.62 | 1.05 | +69.0% |
| EBITDA | — | -3.45 | — |
| Net profit | 2.02 | — | — |
| Capex | 0.03 | — | — |
| EBITDA margin | — | -327.9% | — |
| Net margin | 325.2% | — | — |
Q2 revenue grew 69.0% YoY, but from a low base after a 91.6% decline a year earlier
In Q2 2026, SFI Holding's revenue reached RUB 1,052 million, up 69.0% YoY. However, in the prior year, revenue fell 91.6% in Q2, so the current growth only partially offsets the decline.
For H1 2026, revenue was RUB 1,961 million (sum of Q1 and Q2), significantly below 2025 levels when Q2 alone was RUB 622.6 million. Net interest income contributed the bulk of revenue, amounting to RUB 1,038.8 million in Q2 2026 (per the income statement).
The net loss of RUB 3,449 million was driven by a RUB 4,289 million impairment of the VSK investment
In Q2 2026, SFI Holding posted a net loss of RUB 3,449 million versus a profit of RUB 2,024 million a year earlier. The key driver was an impairment loss on the investment in associate VSK of RUB 4,289 million recognized in H1 2026.
Excluding this impairment, the company would have been profitable, but expected credit losses (RUB 1,509 million for the quarter) and negative fair-value revaluation of financial instruments (RUB 105 million) also weighed. The share of VSK's net profit for the quarter was RUB 1,364 million, partially offsetting the loss.
EBITDA margin was minus 327.9% in Q2 due to an operating loss
In Q2 2026, SFI Holding's EBITDA was minus RUB 3,449 million, corresponding to a margin of minus 327.9% of revenue. Negative EBITDA reflects an operating loss, shown in the income statement as 'Total net interest and non-interest expenses from operating activities': minus RUB 3,487 million for the quarter.
Key expense items are expected credit losses (RUB 1,509 million) and the VSK impairment (RUB 4,289 million for H1). Operating expenses (staff and other) were RUB 122 million for the quarter, insignificant relative to the loss.
Trailing 12-month dividend yield reached 185.2% with a payout of RUB 1,074 per share
Over the last 12 months, SFI Holding paid dividends of RUB 1,074 per share, providing a yield of 185.2% at the current price. This is extraordinarily high, but it is linked to one-off payments: in H1 2026, the company paid RUB 8,021.7 million in dividends to shareholders, far exceeding net profit for the period.
Our model estimates the next dividend at RUB 0 per share and a fair yield for this name at 10.5%. The payout ratio to trailing 12-month profit is 0.7, but with the current loss, the sustainability of such payments is questionable.
P/E LTM stands at 1.42, reflecting low trailing earnings
SFI Holding's market capitalization is RUB 27,695 million, and trailing 12-month net profit is RUB 19,542.5 million, giving a P/E LTM of 1.42. Such a low valuation is explained by the fact that LTM profit includes large one-off gains from the sale of the Europian leasing business at the end of 2025.
Excluding these one-off items, profit would be significantly lower, and the multiple would be higher. Investors should note that current earnings do not reflect the holding's operating activities, which posted a loss in Q2 2026.
Operating cash flow is negative, but for a holding company this is not a performance indicator
Over the last 12 months, SFI Holding's operating cash flow was minus RUB 26,500 million. However, for a holding company with stakes in insurance and leasing assets, this metric reflects movements in client balances and central counterparty positions, not business performance.
In the H1 2026 cash flow statement, operating cash flow was plus RUB 4,556 million, but this is due to working capital changes, not operating profit. We deliberately do not use operating cash flow as a key metric for this company.
The key rate was cut from 16% to 14.25% in H1 2026, affecting financial results
SFI Holding's report states that the Bank of Russia gradually cut the key rate from 16% to 14.25% during H1 2026. This reduction has a dual effect: on the one hand, it lowers interest expenses on borrowings; on the other, it reduces yields on placed funds.
For SFI Holding, which derives a significant portion of income from investments in associates, especially insurer VSK, lower rates may pressure the insurer's investment income. At the same time, it could improve the valuation of future cash flows in impairment tests.
Valuation on the latest reported figures
| Metric | Value |
|---|---|
| Market cap | 27.7 bn ₽ |
| P/E (LTM) | 1.4 |
| P/B | 0.34 |
| ROE | 1.1% |
| Dividend yield (12m) | 157.7% |
Bottom line
In Q2 2026, SFI Holding showed 69.0% YoY revenue growth, but from an extremely low base, and the net loss of RUB 3,449 million was driven by a one-off VSK impairment. The 185.2% trailing 12-month dividend yield is the result of large payouts not backed by current earnings and is unlikely to repeat. The real question for shareholders is whether the holding can restore operating profitability without relying on one-off items and asset sales.
Open the company's financial profile SFIN →
See also: market overview · valuation map · stock screeners