Softline: revenue up 15.5%, but Q2 profit rests on other income rather than operations

On 27 August Softline published its Q2 2026 results. Revenue reached RUB 19,362 mn (+15.5% YoY), EBITDA – RUB 1,441 mn (+5.1%), net profit – RUB 446 mn versus a RUB 44 mn loss a year earlier. Operating profit, however, compressed to RUB 316 mn, and the EBITDA margin fell to 7.4% from 8.2%. The share looks rather attractive: EV/EBITDA LTM of 7.7 is below its own three-year average of 11.7, but leverage at 8.36x EBITDA LTM and weak cash flow cap that valuation.
Key takeaways
— Revenue added 15.5% off a low base last year, but operating profit fell to RUB 316 mn.
— The EBITDA margin compressed to 7.4% from 8.2% as commercial, general and administrative expenses rose to RUB 11,077 mn for the half-year.
— Q2 net profit of RUB 446 mn rests on RUB 2,631 mn of other income for the half-year, not on the operating result.
— Operating cash flow for the half-year was negative at minus RUB 11,462 mn, and capex does not explain it.
— Net debt rose from RUB 28.9 bn on 31 March to RUB 37.2 bn on 30 June, and over 12 months from RUB 24.2 bn to RUB 37.2 bn.
— The 2026 dividend was RUB 0.18 per share, while our estimate of the annual dividend is RUB 0.0 against a fair yield of 7.0%.
— EV/EBITDAC LTM of 11.1 and EV/EBITDA LTM of 7.7 are below the three-year average of 11.7, but the portal model shows minus 48% to fair value.
Attractiveness
Key figures, RUB bn
| Metric | Q2 2025 | Q2 2026 | Change |
|---|---|---|---|
| Revenue | 16.8 | 19.4 | +15.5% |
| EBITDA | 1.37 | 1.44 | +5.1% |
| Operating profit | 0.36 | 0.32 | -12.1% |
| Net profit | -0.04 | 0.45 | to profit |
| Operating cash flow | -3.06 | -5.73 | — |
| Capex | 1.21 | 1.04 | -14.0% |
| EBITDA margin | 8.2% | 7.4% | -0.8 pp |
| Net margin | -0.3% | 2.3% | +2.6 pp |
Revenue added 15.5% off a low base last year, but operating profit fell to RUB 316 mn.
Q2 2026 revenue reached RUB 19,362 mn, 15.5% more than a year earlier. The growth rests on a low base: in Q2 2025 revenue was RUB 16,763 mn and was falling 2.0% YoY.
Operating profit for the same quarter was RUB 316 mn, versus RUB 500 mn a year earlier. The gap between revenue growth and the fall in operating result shows costs are rising faster than sales.
For the first half-year revenue reached RUB 38,724 mn versus RUB 33,526 mn a year earlier, while operating profit was RUB 632 mn versus RUB 719 mn. The half-year result confirms the quarterly one: sales grow, the operating result contracts.
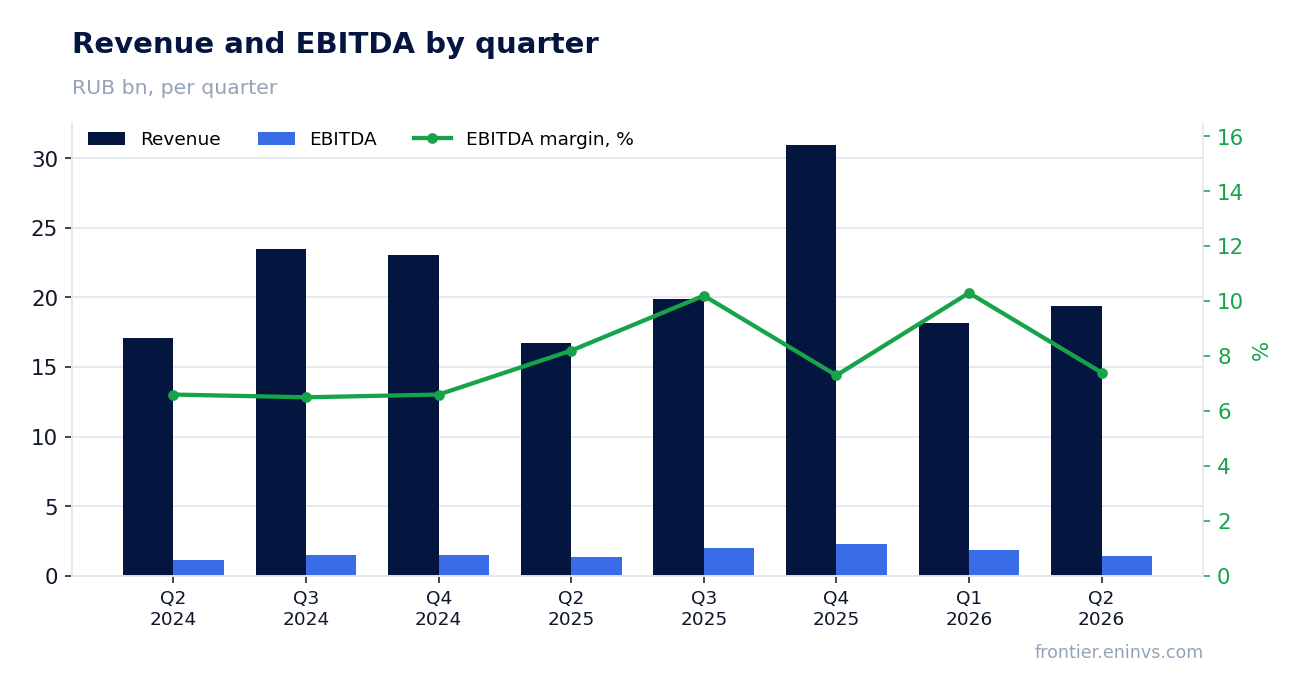
The EBITDA margin compressed to 7.4% from 8.2% as commercial, general and administrative expenses rose to RUB 11,077 mn for the half-year.
Q2 EBITDA was RUB 1,441 mn, 5.1% more than a year earlier, but the margin fell to 7.4% from 8.2%. EBITDA is growing slower than revenue, a direct consequence of cost growth.
Commercial, general and administrative expenses for the first half-year were RUB 11,077 mn versus RUB 9,294 mn a year earlier. From 1 January 2026 the company changed its accounting policy and included production staff remuneration and production-related depreciation in cost of sales; for H1 2025 such expenses were RUB 11,000 mn. The company ensured comparability through retrospective restatement.
Gross profit for the half-year rose to RUB 11,593 mn from RUB 9,958 mn, but administrative expenses almost fully absorbed it. Half-year operating profit was RUB 632 mn, and at that level the EBITDA margin remains thin.
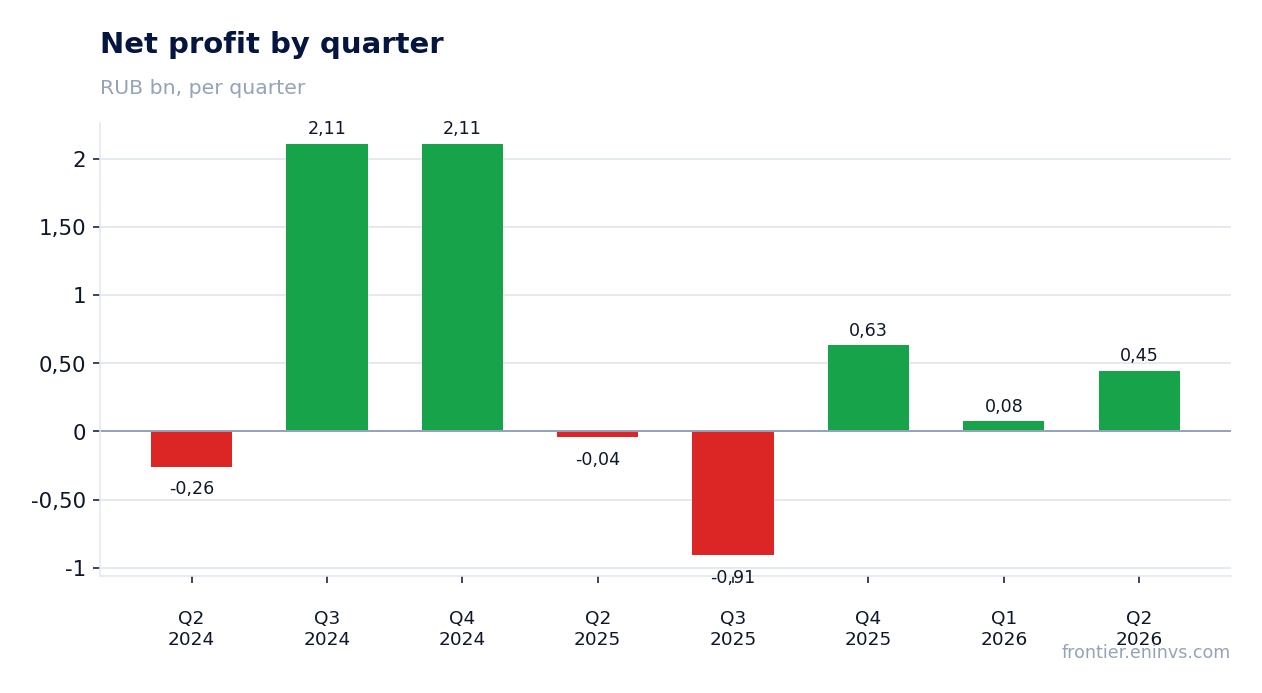
Q2 net profit of RUB 446 mn rests on RUB 2,631 mn of other income for the half-year, not on the operating result.
Q2 net profit was RUB 446 mn versus a RUB 44 mn loss a year earlier. The net margin rose to 2.3% from minus 0.3%, but the source of that improvement lies outside operations.
For the first half-year other income was RUB 2,631 mn, whereas a year earlier there was none. It was this, not operating profit of RUB 632 mn, that formed pre-tax profit of RUB 305 mn after financial expenses of RUB 3,211 mn.
At the same time the company recognised goodwill impairment of RUB 551 mn and a foreign exchange loss of RUB 105 mn. Income tax for the half-year came out positive at RUB 587 mn, which also supported net profit.
Profit attributable to the group's owners for the half-year was RUB 1,638 mn, while non-controlling interests accounted for a loss of RUB 746 mn. That structure means part of the result rests on one-off items rather than sustainable operating profitability.
Operating cash flow for the half-year was negative at minus RUB 11,462 mn, and capex does not explain it.
Net cash from operating activities for H1 2026 was minus RUB 11,462 mn versus minus RUB 6,111 mn a year earlier. The negative result formed before capital expenditure and is not tied to the investment programme.
The main cause is a RUB 21,266 mn reduction in contract liabilities and trade and other payables. Trade and other payables on the balance sheet fell from RUB 36,148 mn at end-2025 to RUB 20,186 mn on 30 June 2026, and that is an outflow of money, not a loss.
Capex for the half-year was RUB 810 mn on property and RUB 1,262 mn on intangibles, about RUB 2.1 bn in total. That is not comparable to the scale of the negative operating flow, so investment cannot explain it.
Cash on the balance sheet fell from RUB 13,134 mn at the start of the year to RUB 3,175 mn on 30 June. The company closed the gap with debt: loan proceeds for the half-year were RUB 24,036 mn against repayments of RUB 18,626 mn.
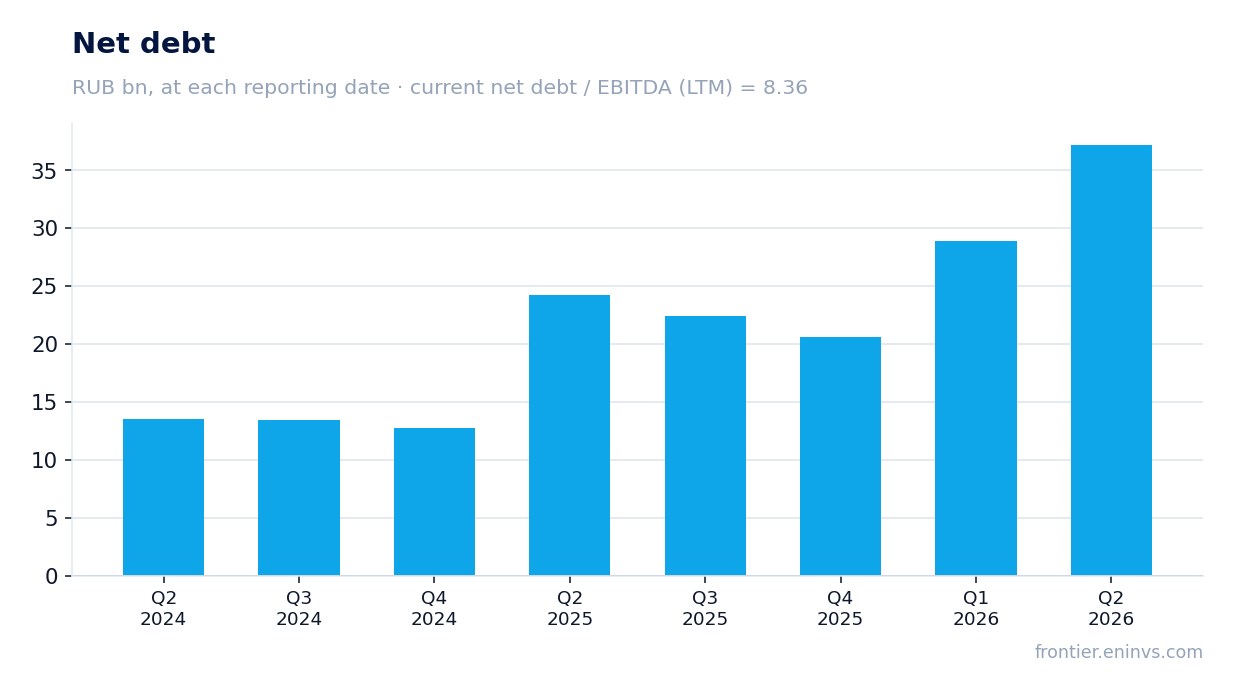
Net debt rose from RUB 28.9 bn on 31 March to RUB 37.2 bn on 30 June, and over 12 months from RUB 24.2 bn to RUB 37.2 bn.
Net debt on 30 June 2026 was RUB 37,204 mn. From 31 March it rose from RUB 28.9 bn, i.e. by RUB 8.3 bn in the quarter. Over 12 months it rose from RUB 24.2 bn on 30 June 2025 to RUB 37.2 bn, an increase of RUB 13.0 bn.
The ratio of net debt to EBITDA over the last 12 months is 8.36. That is a high level for a company with a 7.4% EBITDA margin: debt is almost eight times the annual cash result.
Financial expenses for the half-year were RUB 3,211 mn, almost the same as a year earlier (RUB 3,205 mn). Interest absorbs a significant part of EBITDA: with quarterly EBITDA of RUB 1,441 mn, half-year interest is comparable to it.
Short-term loans on the balance sheet are RUB 24,280 mn, long-term – RUB 8,656 mn. Most of the debt is short, and refinancing it remains a constant task.
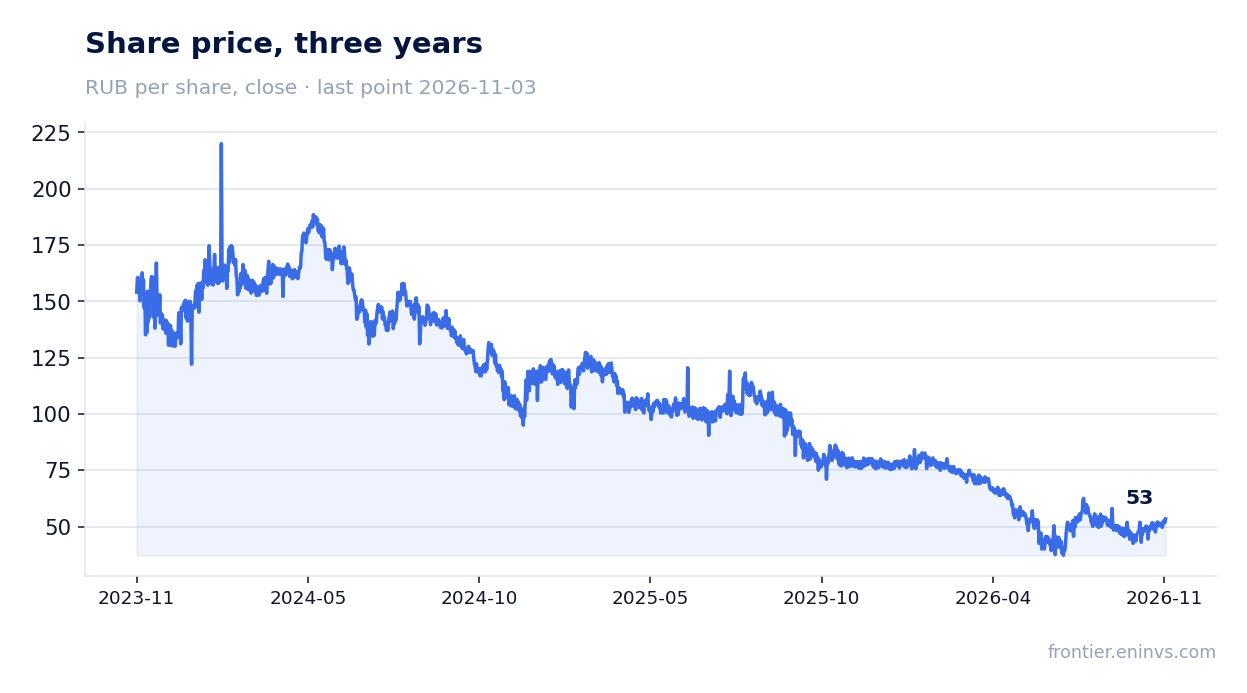
The 2026 dividend was RUB 0.18 per share, while our estimate of the annual dividend is RUB 0.0 against a fair yield of 7.0%.
Over the last 12 months the company paid RUB 0.18 per share, which at a price of RUB 54.28 gives a yield of about 0.3%. Under the 2026 payment calendar the dividend was also RUB 0.18 per share at an ex-date price of RUB 37.52 and a yield of 0.5%.
Our estimate of the annual dividend is RUB 0.0 per share, meaning at the current price we do not assume a payment. The dividend-potential model is capped by free cash flow: with negative operating flow of minus RUB 11,462 mn for the half-year, a payment is not backed by cash.
The yield we consider fair for this name is 7.0% against a key rate of 14.0%. The current yield of 0.3% is far from that level, and the gap is explained not only by price but by the absence of profit to pay from.
The payout parameter in the model is 0.73 of profit, but the profit base over the last 12 months is RUB 1,848 mn. With that base and negative free cash flow, the dividend remains symbolic. A further rise in debt and interest could reduce the payment: half-year financial expenses of RUB 3,211 mn are already comparable to annual profit.
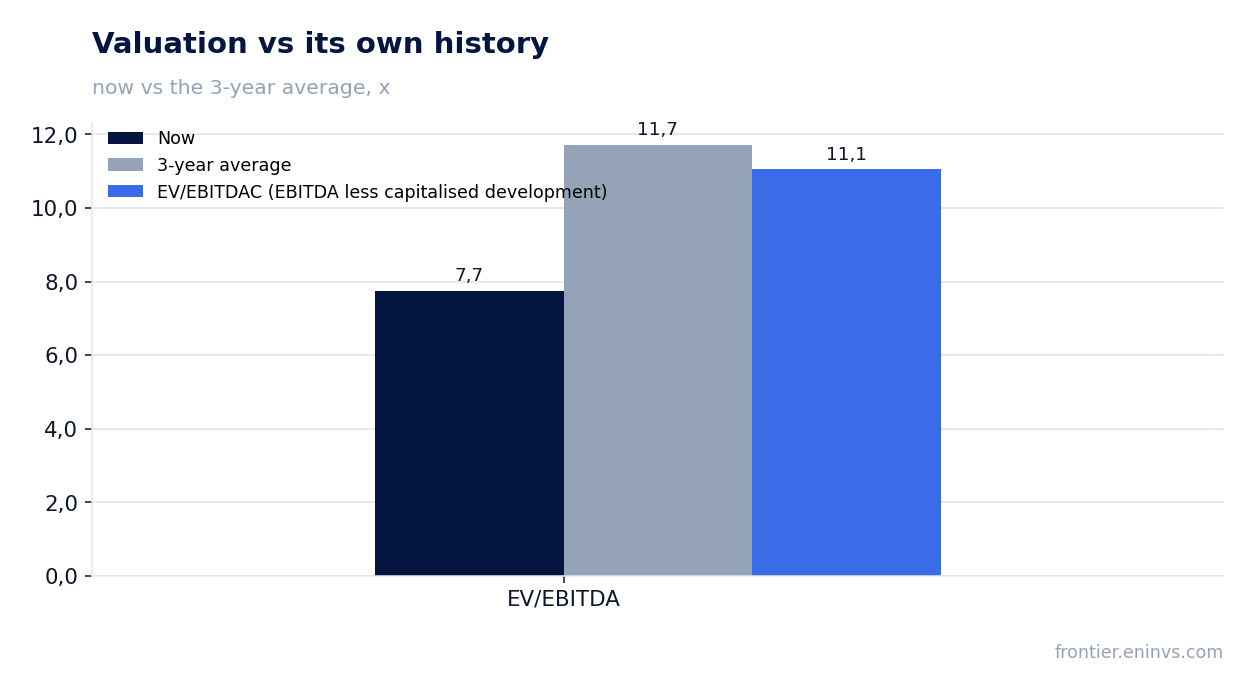
EV/EBITDAC LTM of 11.1 and EV/EBITDA LTM of 7.7 are below the three-year average of 11.7, but the portal model shows minus 48% to fair value.
On the EV/EBITDAC LTM multiple, which accounts for capitalised development costs, the share is worth 11.1. That matters more than EV/EBITDA LTM of 7.7: for a software developer, EBITDA without capitalisation flatters the margin, and EBITDAC gives a fairer picture.
EV/EBITDA LTM of 7.7 is 34% below its own three-year average of 11.7. On this multiple the share is cheaper than it was on average over three years. P/E LTM is 11.7, which with net profit half made up of other income does not look cheap.
The portal model, which compares EBITDA growth with a target multiple and market capitalisation, shows minus 48% to fair value. That is our own estimate, not a market consensus, and it diverges from the conclusion of cheapness on the historical multiple.
The divergence is explained by debt: EV/EBITDA is low partly because market capitalisation is small – RUB 21,712 mn – against net debt of RUB 37,204 mn. The market valuation already reflects high leverage, and a lower multiple does not necessarily mean undervaluation.
Valuation on the latest reported figures
| Metric | Value |
|---|---|
| Market cap | 21.7 bn ₽ |
| P/E (LTM) | 11.7 |
| EV/EBITDA (LTM) | 7.7 |
| EV/EBITDAC (EBITDA less capitalised development) | 11.1 |
| P/B | 0.97 |
| Net debt / EBITDA (LTM) | 8.36 |
| Operating cash flow (LTM) | -8.67 bn |
| ROE | 5.9% |
| Dividend yield (12m) | 0.3% |
| EV/EBITDA, 3-year average | 11.7 |
Bottom line
The strong side of the report remains revenue: RUB 19,362 mn in Q2, up 15.5% YoY, and gross profit growth to RUB 11,593 mn for the half-year. The weakness is elsewhere: operating profit fell to RUB 316 mn, the EBITDA margin compressed to 7.4%, and net profit of RUB 446 mn rests on RUB 2,631 mn of other income for the half-year. Debt rose from RUB 28.9 bn on 31 March to RUB 37.2 bn on 30 June, the ratio to EBITDA LTM is 8.36, and operating flow is negative. For the holder the main question is not revenue but the ability to turn it into cash and service debt; a dividend of RUB 0.18 per share does not compensate for that. The share looks rather attractive on EV/EBITDA of 7.7 against a three-year average of 11.7, but the portal model shows minus 48%, and the verdict rests on a low valuation rather than on the quality of the result.
Open the company's financial profile SOFL →
See also: market overview · valuation map · stock screeners