Sovcombank, 1H2026: the margin has recovered, but capital keeps dividends locked
On the morning of 14 August, Sovcombank published its interim condensed consolidated IFRS results for 1H2026. The press-release headline is net profit up 2.6x to RUB 45.3bn. Below, we break down what that growth is made of, what the bank leaves outside its own "regular profit", and why, at 0.54x book value, investors should not yet expect dividends.
Enhanced Investments relies on primary sources: the [bank's press release and tables](https://sovcombank.ru/articles/novosti-kompanii/chistaya-pribil-sovkombanka-virosla-v-2-6-raza), [Form 102 on the Bank of Russia website](https://www.cbr.ru/banking_sector/credit/coinfo/f102/?regnum=963&dt=2026-07-01) (RAS, reg. no. 963), the [1Q26 IFRS presentation](https://sovcombank.ru/document/16976) and the [dividend policy of PAO Sovcombank, version 2.0](https://sovcombank.ru/document/1246). Quarterly figures for 2Q26 that the bank did not disclose directly are calculated by us as the half-year minus the first quarter and are marked as estimates.
What the report showed: eight numbers
- Net profit of RUB 45.3bn versus RUB 17.5bn a year earlier, up 2.6x.
- Second quarter: RUB 25.6bn versus RUB 19.7bn in the first quarter and RUB 5.0bn a year earlier.
- Net interest margin of 7.2% for the half-year versus 4.5%; 7.6% in the second quarter.
- Cost of funding of 12.4% versus 17.4% – this is the source of the profit.
- ROE of 21.1% annualised versus 10.2%.
- Operating expenses of RUB 80.2bn – up only 4.7% despite inflation and two new insurance companies in the perimeter.
- Stage 3 and POCI loans at 4.8% of the portfolio versus 4.6%; provision coverage fell from 105.1% to 100.9%.
- Capital adequacy ratio N1.0 of 11.0% versus 10.3% a year earlier.
All of the profit growth is liability repricing, not business growth
The loan book grew 11.0% year on year to RUB 3,157bn, while profit rose 2.6x. A gap like this has one explanation: deposits and bonds raised at 2024–2025 rates repriced downward faster than loan yields fell.
Funding cost fell from 17.4% to 12.4%, i.e. by 5.0 percentage points. Yield on interest-earning assets fell only from 22.7% to 20.7%, i.e. by 2.0 points. The three-point difference ended up in the margin: net interest margin rose from 4.5% to 7.2%, and net interest income from RUB 73.2bn to RUB 124.7bn (+70.4%).
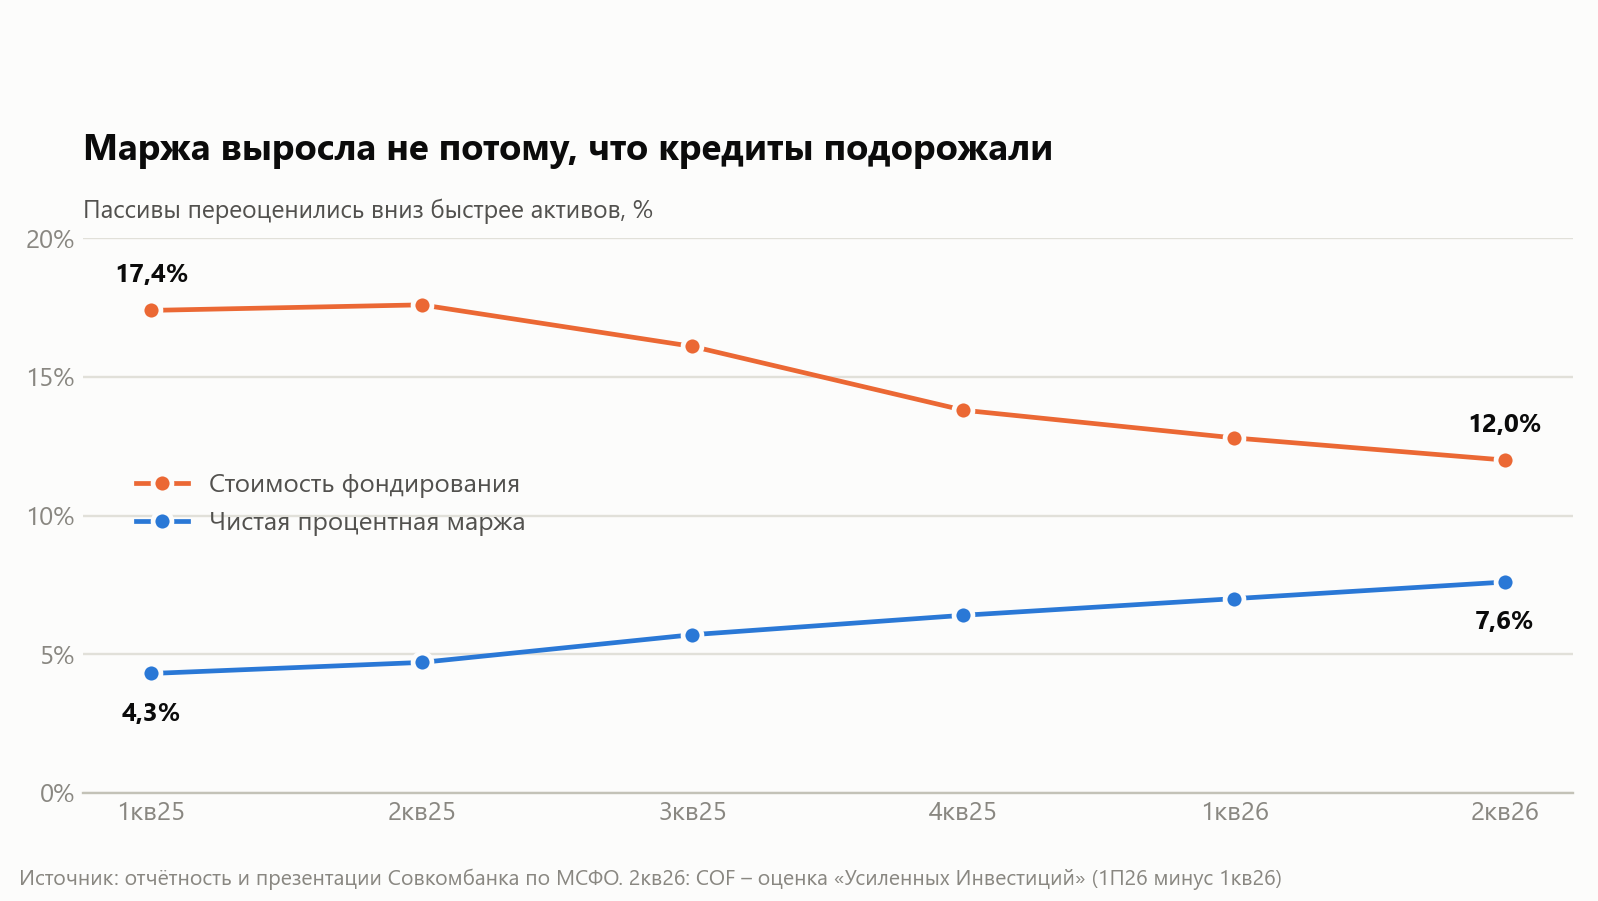
It is important to understand the nature of this move. It is not an improvement in credit quality or a gain in market share, but a normalisation after a period when a bank with a large fixed-rate retail book was squeezed by expensive liabilities. The 4.3% margin in 1Q 2025 was the trough; since then the margin has risen for five consecutive quarters. Further upside is limited: most of the expensive deposits have already repriced, and the next steps will depend on rates on new loans.
The second quarter was stronger than the first, across every line
The bank disclosed only profit on a quarterly basis. Everything else is calculated as the half-year minus the first quarter; since some lines in the 1Q26 presentation are rounded to whole billions, our estimates are approximate.
- Net interest income: about RUB 65bn in 2Q26 versus RUB 60bn in 1Q26 – authors' estimate.
- Net fee and commission income: about RUB 13.5bn versus RUB 12bn – authors' estimate.
- Operating expenses: about RUB 38bn versus RUB 42bn – authors' estimate.
- Cost-to-income ratio: about 42% versus 51% – authors' estimate.
- Cost of risk: about 2.2% versus 3.0% – authors' estimate.
- Net interest margin of 7.6% – disclosed by the bank.
- Net profit of RUB 25.6bn – disclosed by the bank.
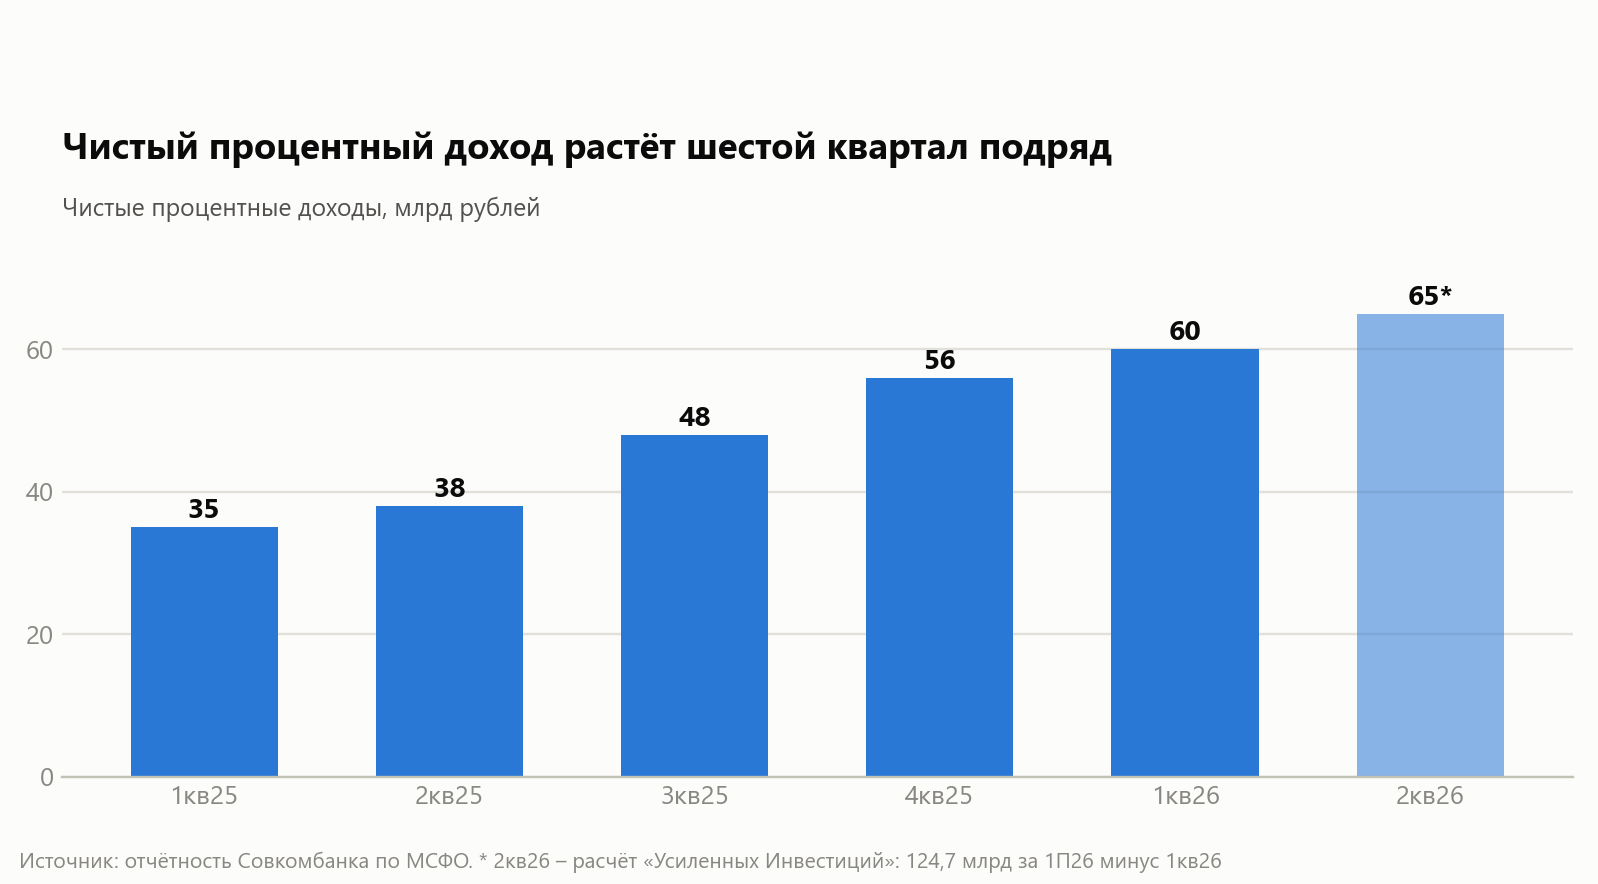
For comparison: the report beat analyst consensus. Renaissance Capital had expected quarterly profit of RUB 24.3bn, half-year profit of RUB 43.3bn, ROE of about 20% and a margin of about 6.1% ahead of publication. The actual RUB 45.3bn and 21.1% came in higher. A caveat on the margin: the bank calculates it on average interest-earning assets rather than total assets, so a direct comparison of 7.2% with 6.1% is not valid.
Retail brought the profit, while the corporate segment gave up margin
A year ago the retail segment was loss-making: minus RUB 1.3bn before tax. It now earns RUB 34.9bn – with a portfolio that shrank 1.4%. Retail did not need to grow: retail funding costs fell 4.9 points, while retail loan yields fell by only 1.0 point.
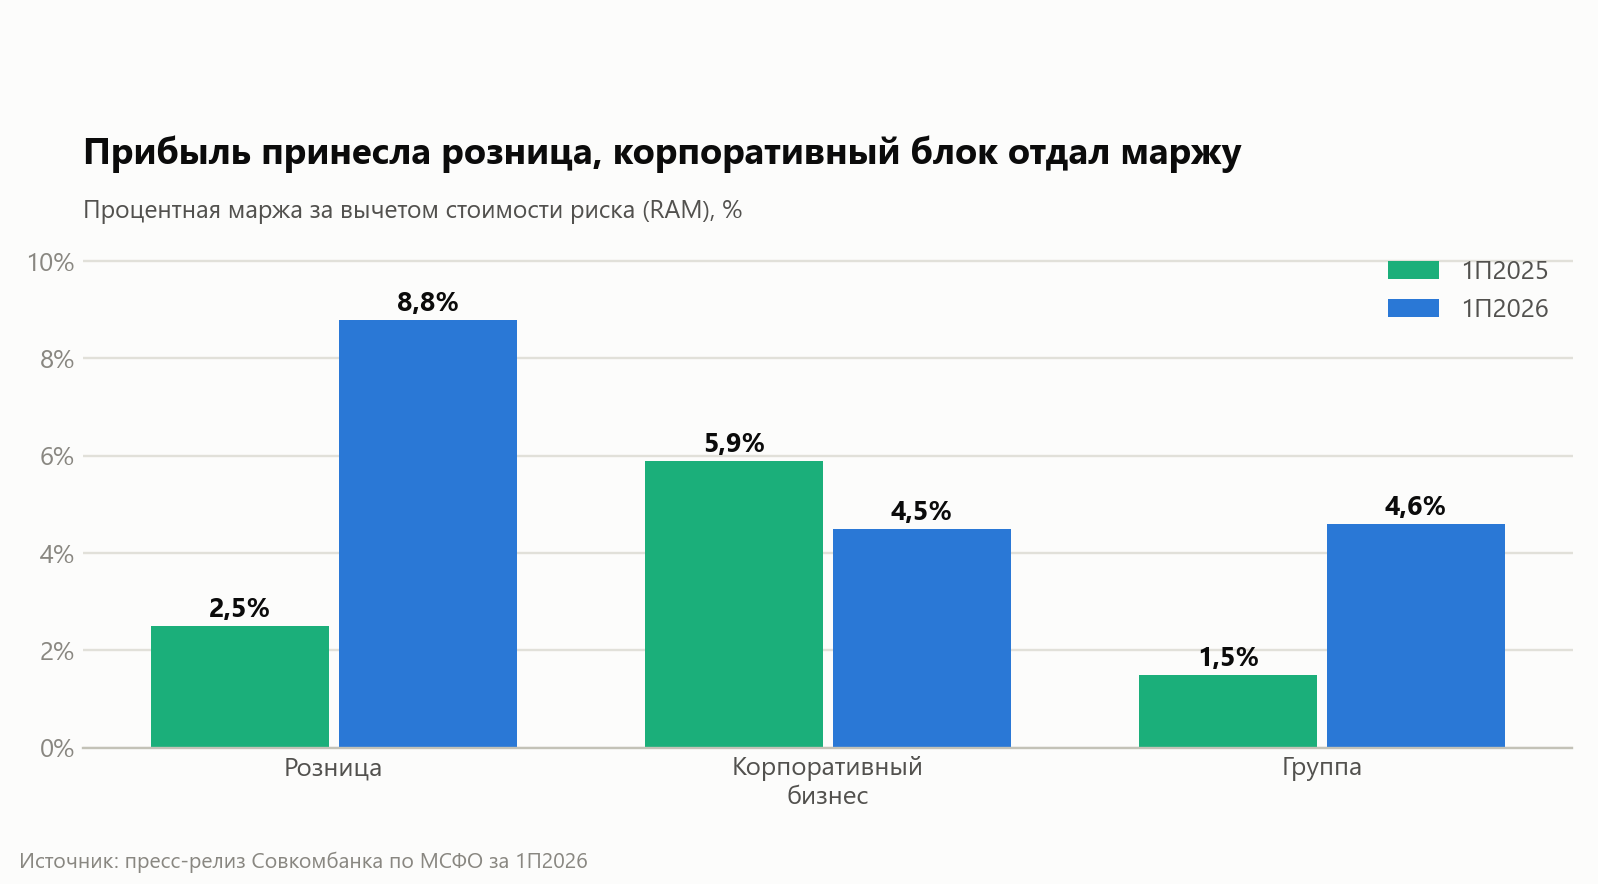
The corporate segment moved the other way: pre-tax result fell from RUB 46.0bn to RUB 37.5bn while the portfolio grew 22.8% to RUB 1,785bn. The portfolio grew while risk-adjusted margin fell, from 5.9% to 4.5%. The bank was adding volume in the segment where it earns less on every rouble of assets.
Guarantees are a separate growth point within the corporate block. Fees for issuing bank guarantees rose 24.0% to RUB 13.3bn, and the portfolio of guarantees, letters of credit and sureties reached RUB 1,166.9bn. This is fee income without funding an asset, but it is also an off-balance-sheet obligation equal to about a third of the loan book – and it does put a load on capital.
Risk improved in the quarter, but portfolio quality did not
Credit loss expense rose 11% to RUB 41.2bn with the portfolio up 11.0% – that is, proportionally. Group cost of risk for the half-year was 2.6%; by our estimate it fell in the second quarter to about 2.2% from 3.0% in the first. Retail cost of risk for the half-year was 4.3%, corporate 1.2%.
Balance-sheet metrics look weaker than the provisioning trend. The share of Stage 3 and POCI loans rose from 4.6% to 4.8%, while provision coverage of these loans fell from 105.1% to 100.9%. Both moves are small but point in the same direction: slightly more problem loans and a slightly thinner cushion against them. At the same time, the impairment allowance grew 10.9% to RUB 152bn, i.e. exactly in line with the portfolio.
The retail portfolio is shrinking unevenly: consumer loans fell 22.0% to RUB 262bn, auto loans were almost unchanged (RUB 509bn), and mortgages added 18.6% to reach RUB 430bn. The bank is shifting from unsecured retail to secured lending – which explains why retail cost of risk did not rise along with the overall deterioration in quality.
Expenses barely grew – the main surprise of the report
Operating expenses were RUB 80.2bn, up just 4.7% year on year. Staff costs rose to RUB 48.9bn from RUB 44.5bn, while other administrative expenses fell from RUB 32.1bn to RUB 31.3bn. And this despite Kapital Life and Kapital Medical Insurance joining the perimeter in the second quarter, adding about 3,000 people to group headcount (40,000 versus 37,000 on 1 January).
The cost-to-income ratio fell from 64.0% to 46.4% – but it should be remembered that the denominator almost doubled over the year thanks to interest income. CIR improved mainly because income grew, not because expenses were cut.
There is also a question about the line itself. Insurance companies' expenses may be reflected in the group's accounts not in operating expenses but within the net result of non-bank activities, which is presented on a net basis. If so, the thesis "the perimeter grew but expenses hardly did" is partly explained by accounting geometry, not only by cost control. This is the first thing to clarify in the notes to the financial statements.
Minus RUB 15bn on securities: what is left outside the brackets
The bank separately calculates "regular" profit of RUB 49.3bn, which is 9% above the actual figure. The difference is the non-regular result: minus RUB 5.1bn before tax and minus RUB 4.0bn after tax. The composition of this line is worth looking at in full.
- Financial instruments at fair value through profit or loss: minus RUB 15.1bn versus plus RUB 4.7bn a year earlier.
- Foreign currency, precious metals and derivatives: plus RUB 3.1bn versus minus RUB 21.3bn a year earlier.
- Other non-regular income: plus RUB 4.4bn, including RUB 3.8bn of bargain-purchase gain on the two insurance companies.
- Other non-bank activities: plus RUB 2.6bn.
The first two lines cannot be read separately. A year earlier there was exactly the mirror-image combination – a gain on securities and a large loss on currency. Together these two items gave minus RUB 12.1bn in 1H2026 versus minus RUB 16.6bn in 1H2025, so in aggregate the picture improved. It looks like a position and its hedge booked in different lines of the statements.
What matters here for the investor: the non-regular result is negative in both periods, so the "regular profit" metric currently does not flatter but overstates the actual result. RUB 45.3bn is the figure to rely on. We would also note that there is no revaluation gain on the stake in B2B-RTS after its IPO in the report: the group retained control, so no fair-value remeasurement was made, and only the net effect of the placement – RUB 1,456mn – reached the result.
Capital is the real constraint: 11.0% against a dividend threshold of 11.5%
Equity attributable to shareholders rose 20.3% to RUB 425.8bn, and book value per share to RUB 19.0. But the regulator is interested not in that, but in the N1.0 ratio on the bank's regulatory reporting: 11.0% versus 10.3% a year earlier.
Next comes the arithmetic of constraints. Capital adequacy requirements for systemically important banks rise every year: by the bank's own calculations, about 10% in 2026, 11% in 2027 and 12% in 2028. That is, the actual 11.0% already equals next year's requirement.
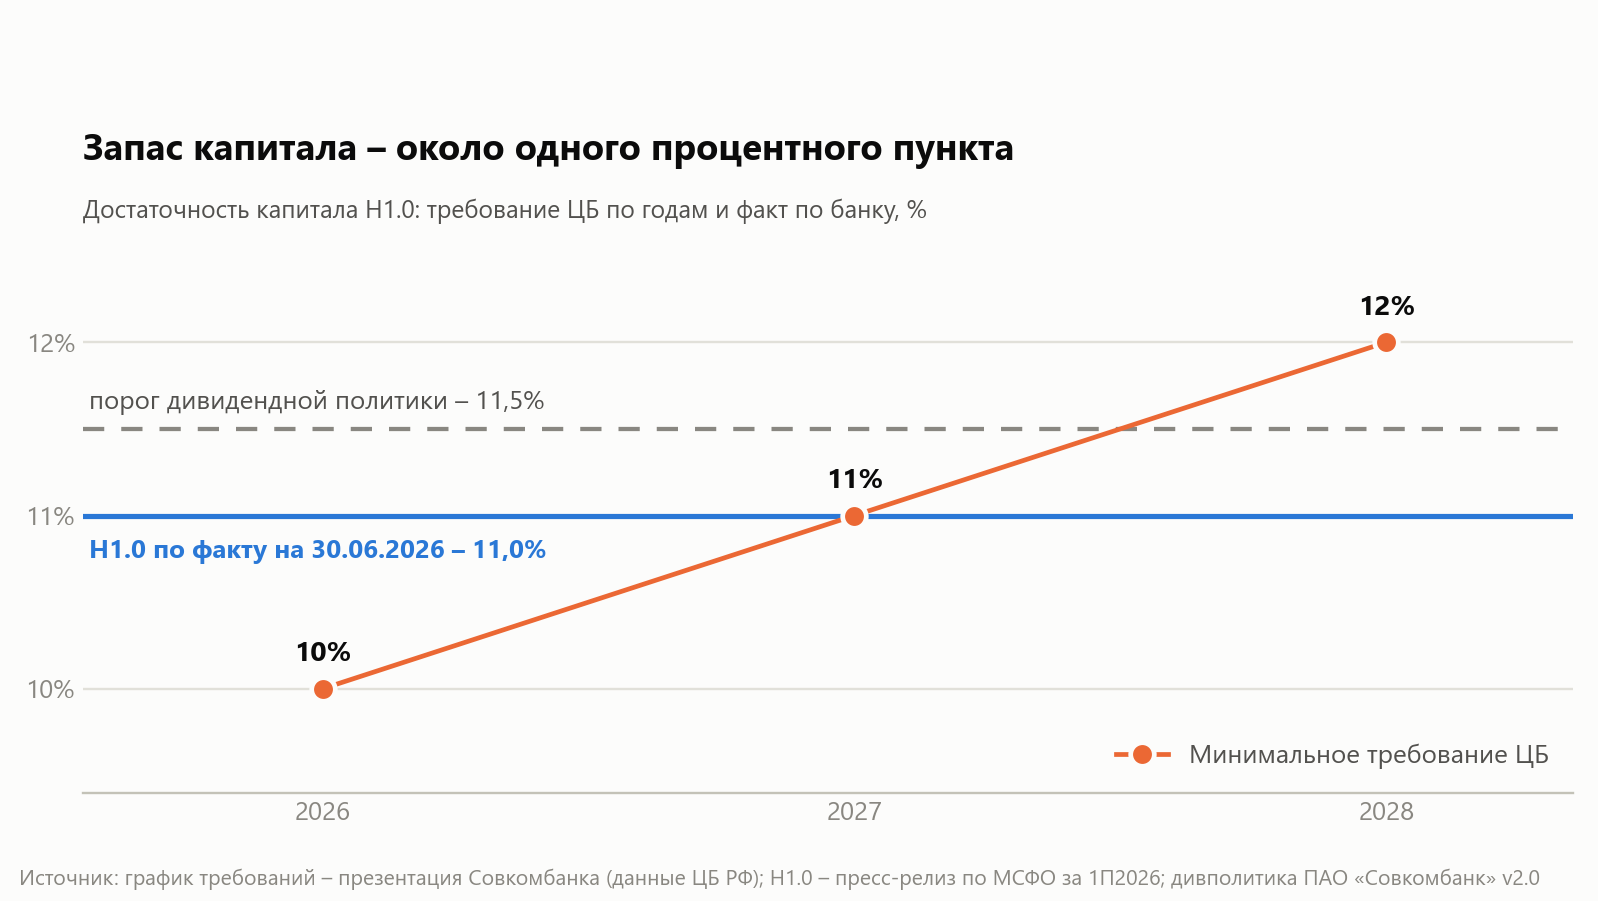
And the dividend policy sets its own bar: a payout of 25–50% of IFRS profit provided the payment does not push N1.0 below 11.5%. The ratio is currently below that threshold. That is why for 2025 shareholders received RUB 0.35 per share – RUB 7.9bn, or less than 15% of profit, against a stated range of 25–50%.
Let us check whether the buffer is growing. With ROE of about 21%, capital adds roughly two points to the ratio per year before asset growth; the loan portfolio is growing 11% a year. By a rough estimate, the bank approximately holds the level it has reached, while the requirement adds a point a year. This is an illustration, not a forecast: without faster profit growth or slower asset growth, the buffer will be thin in 2027 too.
Buyback instead of dividends – and it is carried out by the insurance subsidiary
In mid-June the bank approved a programme of buying its own shares on the Moscow Exchange through its subsidiary Sovcombank Life Insurance. The volume is RUB 2bn per quarter, about RUB 8bn a year, comparable to the RUB 7.9bn dividend paid for 2025. Between mid-June and the end of June, shares worth about RUB 162mn were bought; purchases are financed from the insurance company's own funds.
Management's logic has been stated plainly: with the price well below book value per share, a buyback is more efficient than a payout. At the end of May Sergey Khotimsky put it even more bluntly – an additional capital buffer will bring an immediate buyback, not dividends. Today's release repeats the same idea: capital is allocated between buybacks, organic growth and M&A deals, and the bank is ready to consider new assets.
There is an internal contradiction here that is worth keeping in mind. A buyback, organic portfolio growth and M&A compete for the same limited resource – capital, whose buffer is about one point of the ratio. The declared readiness for all three directions at once requires either very high profit or a very selective approach.
Two facts from the release that usually go unnoticed. The free-float share rose from 16.3% at the end of 2025 to 21.6%, while the combined direct and indirect holding of management rose from 50.4% on 1 January to 51.9% on 1 July. Both stakes rose at the same time, which means a third party gave up its share; who that was does not follow from the release.
RAS shows RUB 64bn, IFRS RUB 45bn. Tax explains the gap
Investors who followed the monthly reporting saw a very different picture. According to [Form 102 on the Bank of Russia website](https://www.cbr.ru/banking_sector/credit/coinfo/f102/?regnum=963&dt=2026-07-01), the bank earned RUB 64.2bn of net profit in the first half of 2026 versus RUB 3.9bn a year earlier – up 16.3x. The gap with IFRS of almost RUB 19bn needs to be understood before building a model on either figure.
The first reason is obvious: RAS covers the standalone bank, while IFRS covers a group with leasing, factoring, insurance and platforms. The second is less visible and far more interesting. Income tax expense under RAS was RUB 0.49bn on RUB 64.7bn of pre-tax profit – an effective rate of about 0.8%. Under IFRS the same period gives RUB 12.4bn of tax on RUB 57.6bn of pre-tax profit, i.e. 21.5%.
A practically zero tax charge at the standalone bank level usually means large non-taxable income – most often dividends from subsidiaries, which are fully eliminated on consolidation. This is our reading of the figures, not a statement by the bank, and it is a good question for the investor call. For practical purposes the conclusion is simple: Sovcombank's RAS profit cannot be compared with its IFRS profit.
A useful detail from the same form: the bank's total RAS income for the half-year was RUB 998.0bn versus RUB 1,014.3bn a year earlier, i.e. it even declined, while expenses fell from RUB 1,012.0bn to RUB 933.3bn. The entire increase in RAS profit is the cheaper liabilities – exactly the same story as in IFRS.
Valuation: about 0.54x book value and 2–3x earnings
At the time of writing, the shares traded around RUB 10.3, with a market capitalisation of about RUB 233bn on 22.5bn shares in issue. The reaction to the report was muted: in the first minutes after publication the quote slid to 10.46 and 10.13 before returning to the previous close.
- P/B of about 0.54 – RUB 10.3 versus RUB 19.0 of book value per share.
- Trailing 12-month P/E of about 2.9 – we estimate earnings for the period at about RUB 81bn (about RUB 53bn for 2025 minus RUB 17.5bn for 1H2025 plus RUB 45.3bn for 1H2026).
- P/E on the annualised second-quarter run rate of about 2.3, multiplying RUB 25.6bn by four. This is arithmetic, not a forecast: the quarter was strong, and the repeatability of such a pace is not guaranteed.
- Dividend yield of 3.4% on the payout for 2025 – and this is a ceiling until N1.0 rises above 11.5%.
In other words, the market values the bank at about half of its capital, not believing in the sustainability of current ROE. This scepticism has grounds: Sovcombank's profitability has historically been cyclical, and today's 21% was obtained from an effect – liability repricing – that is one-off in nature. The opposing argument is also understandable: with a margin held at about 7% and capital growing faster than the price, the discount closes over time through capital itself, even if the multiple does not change.
What remains unclear
The investor call on the half-year results is scheduled for 15:00 Moscow time on 14 August. The list of things worth clarifying:
- Where exactly in the income statement the expenses of Kapital Life and Kapital MS are reflected – in operating expenses or in the net result of non-bank activities.
- What is behind the minus RUB 15.1bn on instruments at fair value through profit or loss, and whether the plus RUB 3.1bn on currency and derivatives is a hedge of the same position.
- What N1.0 trajectory is assumed for the end of 2026 and 2027, and at what level dividends under the 25–50% policy will resume.
- How a buyback of RUB 8bn a year, corporate portfolio growth of 22.8% and the stated readiness for new M&A deals fit together with a capital buffer of about one point.
- Why provision coverage of Stage 3 and POCI loans fell below 100% for the group as a whole, and whether the auditor has a position on this.
- Who exactly gave up the stake that lifted the free float from 16.3% to 21.6% while management's holding rose at the same time.
Conclusion
The report is strong and better than analysts expected, but it is best read as a report on the end of a painful cycle, not the start of a new growth phase. The profit was made not by the business but by liability repricing: the margin rose from 4.5% to 7.2%, while the loan book added only 11%, retail shrank and the corporate segment earned less than a year ago. Asset quality deteriorated slightly, and so did provision coverage.
The main constraint is not income but capital. The N1.0 ratio of 11.0% is below the bank's own dividend threshold of 11.5% and equal to the regulator's requirement for 2027. As long as that holds, all excess capital will go into buybacks, portfolio growth and deals – but not into cash for shareholders. For an investor buying at half of book value this is more an argument for than against; for someone waiting for a dividend stream, the horizon shifts by at least a year.
Tickers
SVCB – an extended issuer card with financial metrics, multiples and corporate events on our portal: frontier.eninvs.com.
Reviews of financial statements, ideas and weekly analytics are in the Telegram channel Enhanced Investments (@eninv).
See also: market overview · valuation map · stock screeners