Sollers: revenue up 29.3%, but subsidies and inventory build fail to avert a RUB 2.7 bn loss
On 28 August, Sollers reported results for the first half of 2026. Revenue rose 29.3% year on year to RUB 32,985 mn, but EBITDA turned negative at RUB -472 mn against a 6.0% margin a year earlier, and net loss reached RUB 2,691 mn versus RUB 1,227 mn a year ago. Net debt climbed to RUB 28,257 mn, and our estimate for the 2026 dividend is RUB 9.26 per share – a yield of just 2.5%. At the current price the shares look unattractive: the loss, leverage at 13.76x LTM EBITDA and weak dividend potential outweigh revenue growth.
Key takeaways
— Revenue rose 29.3%, but growth was driven by subsidies and a low base last year
— EBITDA turned negative at RUB -472 mn as cost of sales and commercial expenses grew faster
— Net loss of RUB 2,691 mn was partly offset by a tax income of RUB 306 mn
— Operating cash flow of RUB 7,700 mn was generated by a rise in payables, not by profit
— Net debt rose to RUB 28,257 mn, and net debt/LTM EBITDA stands at 13.76 – a high level
— Our estimate for the 2026 dividend is RUB 9.26 per share – a yield of 2.5%
— EV/EBITDA LTM of 11.3 versus a three-year average of 4.77 – the stock trades well above its own history
Attractiveness
Key figures, RUB bn
| Metric | H1 2025 | H1 2026 | Change |
|---|---|---|---|
| Revenue | 25.5 | 33.0 | +29.3% |
| EBITDA | 1.54 | -0.47 | -130.7% |
| Operating profit | 0.05 | -1.96 | -4175.0% |
| Net profit | -1.23 | -2.69 | — |
| Operating cash flow | 21.4 | 7.70 | -64.0% |
| Capex | 3.14 | 2.60 | -17.3% |
| EBITDA margin | 6.0% | -1.4% | -7.4 pp |
| Net margin | -4.8% | -8.2% | -3.4 pp |
Revenue rose 29.3%, but growth was driven by subsidies and a low base last year
Revenue for the first half of 2026 was RUB 32,985 mn, up 29.3% year on year. The main contribution came from sales of vehicles and components, as well as a low base effect: a year earlier revenue was RUB 25,517 mn.
The report states that in H1 2026 subsidies receivable amounted to RUB 18,676 mn and were netted against cost of sales. This means state support compensated part of production costs but did not directly increase revenue. Without subsidies, cost of sales would have been higher and the loss larger.
Revenue growth was accompanied by an increase in inventories: raw materials rose from RUB 3,668 mn at end-2025 to RUB 8,313 mn at 30 June 2026. This may indicate production ramp-up, but also creates a risk of overstocking if demand does not materialise.
EBITDA turned negative at RUB -472 mn as cost of sales and commercial expenses grew faster
EBITDA for H1 2026 was RUB -472 mn versus positive EBITDA a year earlier, when the margin was 6.0%. The negative EBITDA margin in the reporting period was 1.4%.
Cost of sales rose to RUB 29,493 mn from RUB 20,271 mn a year earlier, an increase of 45.5%. This significantly outpaces revenue growth of 29.3%, which led to a decline in gross profit to RUB 3,492 mn from RUB 5,246 mn.
Commercial expenses decreased to RUB 1,634 mn from RUB 2,138 mn, but general and administrative expenses rose to RUB 3,830 mn from RUB 3,125 mn. As a result, operating loss amounted to RUB 1,956 mn versus operating profit of RUB 48 mn a year earlier.
Net loss reached RUB 2,691 mn versus RUB 1,227 mn a year earlier. The loss was partly offset by a tax income of RUB 306 mn, whereas a year earlier there was a tax expense of RUB 633 mn.
Net loss of RUB 2,691 mn was partly offset by a tax income of RUB 306 mn
Net loss for H1 2026 was RUB 2,691 mn versus RUB 1,227 mn a year earlier. Loss before tax was RUB 2,997 mn, but thanks to a tax income of RUB 306 mn the final loss was smaller.
The report explains that the increase in deferred tax asset is related to a temporary difference from advance receipt of subsidies. The corresponding income will be recognised in future periods, which may support financial results going forward.
Share of losses of joint ventures decreased to RUB 167 mn from RUB 1,025 mn a year earlier. This is due to the loss of UAZ-Avtokomponent JV in H1 2026 amounting to RUB 335 mn versus RUB 1,101 mn a year earlier, as well as the cessation of accounting for the Mazda-SOLLERS JV after control over OOO AIT passed to the Group in December 2025.
Operating cash flow of RUB 7,700 mn was generated by a rise in payables, not by profit
Operating cash flow for H1 2026 was RUB 7,700 mn versus RUB 21,377 mn a year earlier. However, this flow was generated not by profit but by changes in working capital.
Tax payables other than income tax increased by RUB 17,795 mn, providing the main cash inflow. Trade and other payables, advances received and other payables also increased by RUB 3,366 mn. At the same time, receivables and prepayments rose by RUB 9,633 mn, and inventories by RUB 3,800 mn, which partly offset the inflow.
Capital expenditures in H1 2026 were RUB 2,600 mn versus RUB 3,066 mn a year earlier. Research and development costs were RUB 1,067 mn versus RUB 1,279 mn a year earlier. Despite the decline, investments remain significant and exceed depreciation, putting pressure on free cash flow.
Net cash from operating activities after interest and income tax paid was RUB 7,700 mn, but after investments of RUB 3,087 mn free cash flow remains positive. However, the quality of this flow is questionable as it depends on growth in payables, which may be temporary.
Net debt rose to RUB 28,257 mn, and net debt/LTM EBITDA stands at 13.76 – a high level
Net debt at 30 June 2026 was RUB 28,257 mn. Compared with 31 December 2025, net debt rose from RUB 11.8 bn to RUB 28.3 bn, an increase of RUB 16.4 bn. Over the last 12 months net debt has hardly changed: at 30 June 2025 it was RUB 29.3 bn, and at 30 June 2026 – RUB 28.3 bn, a decrease of RUB 1.0 bn.
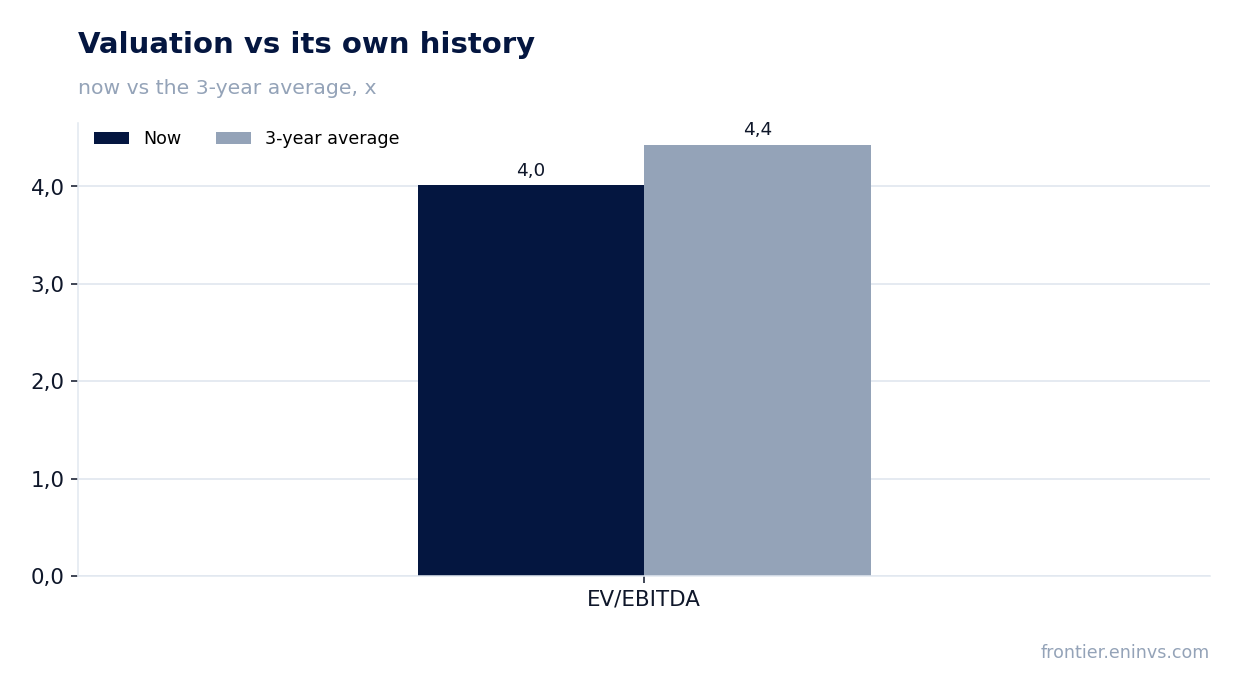
The net debt/LTM EBITDA ratio stands at 13.76. This is a high level, reflecting both significant debt and low LTM EBITDA. For comparison, EV/EBITDA LTM is 11.3, while the three-year average is 4.77. Thus, the current valuation is significantly above its historical level.
Financial expenses in H1 2026 were RUB 874 mn versus financial income of RUB 383 mn a year earlier. This is due to higher debt and interest rates. The central bank key rate at 30 June 2026 was 14.25%, which remains high and increases the cost of debt servicing.
Our estimate for the 2026 dividend is RUB 9.26 per share – a yield of 2.5%
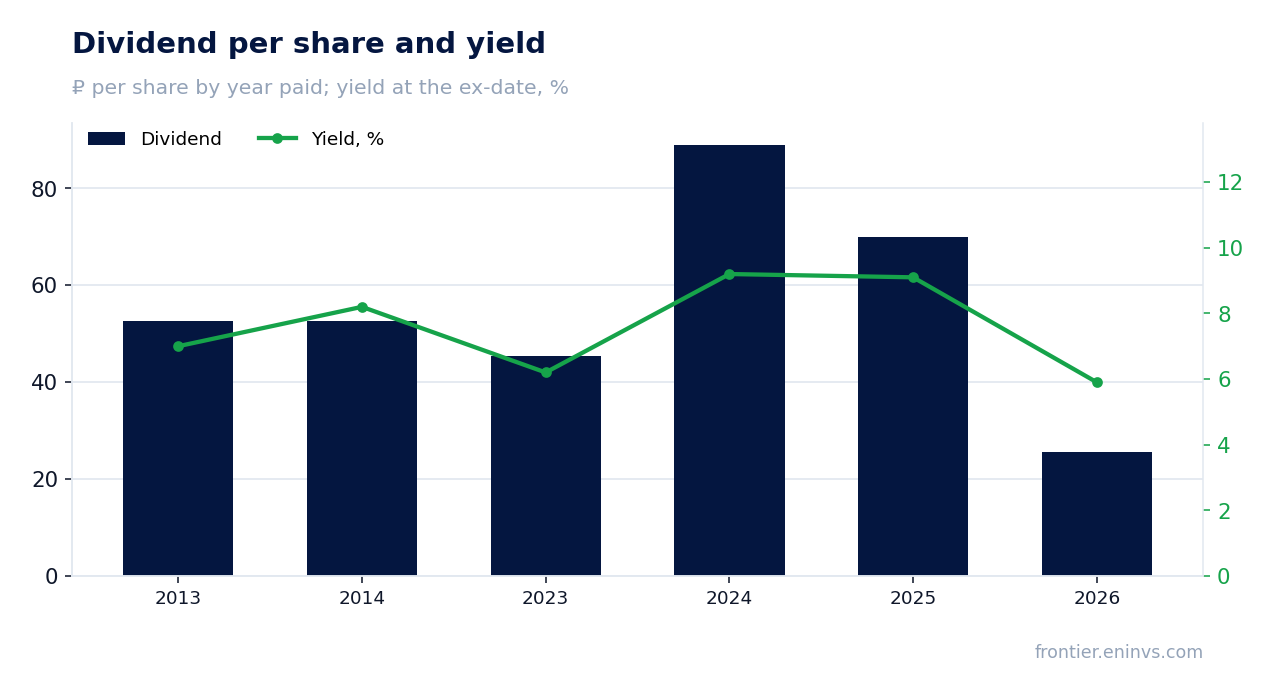
Over the last 12 months the company paid dividends of RUB 25.5 per share, which at the current price gives a yield of 6.9%. However, this is the payment for 2025, and it was significantly lower than for 2024, when the dividend was RUB 89.0 per share.
Our estimate for the dividend for the current financial year (to be paid next year) is RUB 9.26 per share. This is our own forecast, based on the assumption that the payout ratio remains at 35% of LTM net profit, as in the previous year. At the current price this gives a yield of only 2.5%. The decision on payment is made by the board of directors.
The yield we consider fair for this name is 7.0%. The current expected yield of 2.5% is significantly below this level, making the dividend story unattractive. For comparison, the central bank key rate is 14.0%, which also exceeds the expected dividend yield.
Risks to the dividend are related to the loss in H1 2026 and high debt. If the company cannot restore profitability, the payout ratio may be reduced, and the dividend even lower. In addition, high capital expenditures and debt servicing may limit free cash flow available for payments.
EV/EBITDA LTM of 11.3 versus a three-year average of 4.77 – the stock trades well above its own history
EV/EBITDA LTM is 11.3, significantly above the three-year average of 4.77. This means the current valuation substantially exceeds the historical norm for the company. P/E LTM is 13.7, which may also indicate overvaluation given the loss in the reporting period.
Our fundamental valuation model (the portal's model) shows a potential downside to fair value of 93%. This is our own calculation, not a market consensus. The model takes into account EBITDA growth, a target multiple and the current market capitalisation.
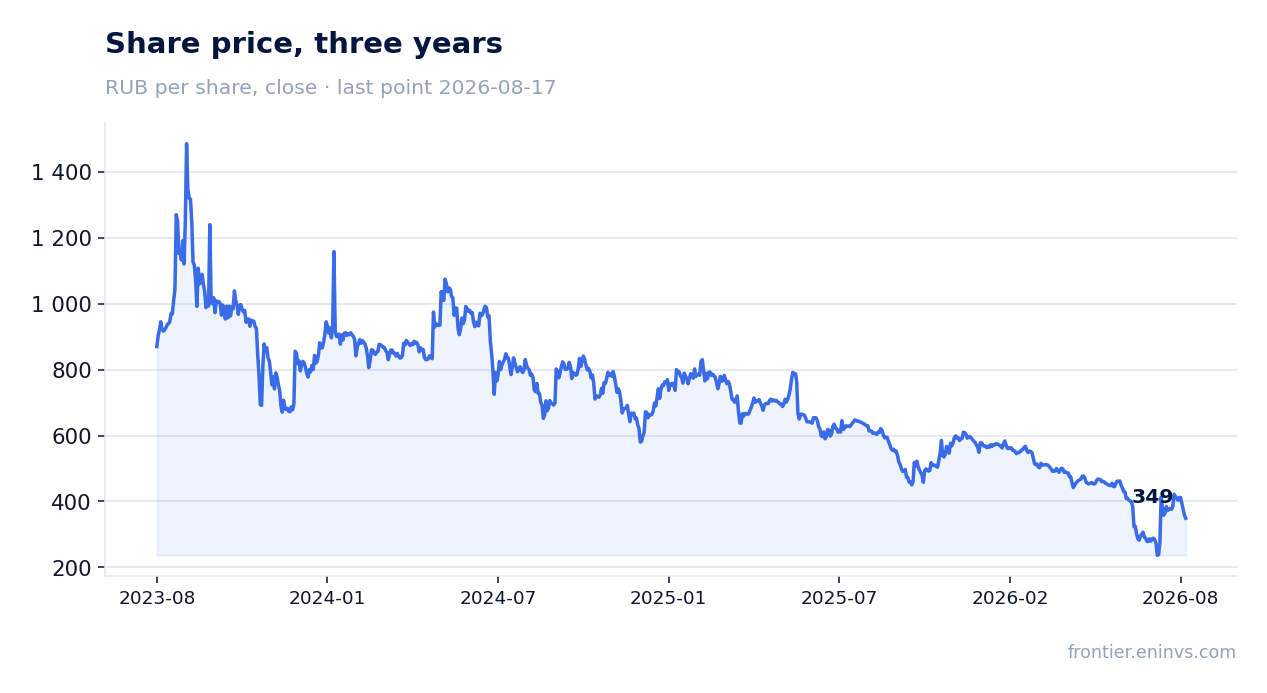
The company's market capitalisation is RUB 11,445 mn. With this level of debt and negative EBITDA in H1 2026, the current valuation looks inflated. To restore attractiveness, a sustainable improvement in operating profitability and a reduction in debt burden are necessary.
Valuation on the latest reported figures
| Metric | Value |
|---|---|
| Market cap | 11.4 bn ₽ |
| P/E (LTM) | 13.7 |
| EV/EBITDA (LTM) | 11.3 |
| P/B | 0.46 |
| Net debt / EBITDA (LTM) | 13.76 |
| Operating cash flow (LTM) | -8.87 bn |
| ROE | -23.0% |
| Dividend yield (12m) | 7.0% |
| EV/EBITDA, 3-year average | 4.8 |
Dividend per share, ₽, and yield at the ex-date
| Year paid | Dividend | Yield |
|---|---|---|
| 2013 | 52.52 | 7.0% |
| 2014 | 52.52 | 8.2% |
| 2023 | 45.39 | 6.2% |
| 2024 | 89.00 | 9.2% |
| 2025 | 70.00 | 9.1% |
| 2026 | 25.50 | 5.9% |
| Our estimate, current year | 9.26 | 2.5% on the current price |
Bottom line
Sollers' revenue rose 29.3%, but this growth did not translate into profit: EBITDA turned negative at RUB -472 mn, and net loss was RUB 2,691 mn. Operating cash flow of RUB 7,700 mn was secured by an increase in payables, not by operating activities. Net debt rose to RUB 28,257 mn, and the net debt/LTM EBITDA ratio stands at 13.76 – a high level. Our estimate for the 2026 dividend is RUB 9.26 per share, giving a yield of 2.5% – below the fair yield for the company. EV/EBITDA LTM of 11.3 versus a three-year average of 4.77 indicates overvaluation. At the current price the shares look unattractive.
Open the company's financial profile SVAV →
See also: market overview · valuation map · stock screeners