TGK-14: H1 profit doubles, but rising debt and negative ROE question the valuation
On August 10, 2026, TGK-14 released its condensed consolidated interim financial statements for H1 2026. Net profit rose 109.3% YoY to RUB 842.9 million, EBITDA – 64.6% to RUB 2,625.6 million (here and elsewhere, unless noted, figures are for the reporting period). However, over the last 12 months debt increased by RUB 3.0 billion, and return on equity is negative. At the current price, the share looks rather attractive: multiples are below its own history, but rising debt and dividend uncertainty warrant caution.
Key takeaways
— H1 net profit doubled on revenue growth and operational efficiency
— EBITDA margin expanded by 5.6 p.p. to 20.2% on faster revenue growth
— Debt increased by RUB 3.0 billion over 12 months to RUB 11.2 billion, equivalent to 3.16 LTM EBITDA
— Capital expenditures almost twice exceeded operating cash flow, leading to negative free cash flow
— No dividends paid over the last 12 months, but the model estimates a forward yield of 21.6% versus a fair 11.0%
— Shares trade at a discount to their own three-year average EV/EBITDA
— Return on equity is negative, indicating issues with efficient use of shareholder capital
Attractiveness
Key figures, RUB bn
| Metric | H1 2025 | H1 2026 | Change |
|---|---|---|---|
| Revenue | 10.9 | 13.0 | +19.2% |
| EBITDA | 1.59 | 2.62 | +64.6% |
| Operating profit | 0.92 | 1.81 | +97.0% |
| Net profit | 0.40 | 0.84 | +109.3% |
| Operating cash flow | -0.22 | 0.88 | to profit |
| Capex | 2.56 | 1.81 | -29.2% |
| EBITDA margin | 14.6% | 20.2% | +5.6 pp |
| Net margin | 3.7% | 6.5% | +2.8 pp |
H1 net profit doubled on revenue growth and operational efficiency
For H1 2026, TGK-14's net profit amounted to RUB 842.9 million, up 109.3% from the same period last year. Revenue grew 19.2% to RUB 12,990.4 million (per the income statement). The main driver was operating profit nearly doubling – from RUB 919.2 million to RUB 1,810.9 million.
Profit growth was also supported by other operating income, which rose 15.5% to RUB 1,105.1 million. Finance costs remained almost flat year-on-year (RUB 1,332.1 million vs. RUB 1,305.9 million), allowing most of the operating growth to flow to the bottom line.
EBITDA margin expanded by 5.6 p.p. to 20.2% on faster revenue growth
EBITDA for H1 2026 reached RUB 2,625.6 million (calculated as operating profit plus depreciation: RUB 1,810.9 million + RUB 768.9 million + RUB 40.9 million intangibles), up 64.6% from last year. EBITDA margin expanded from 14.6% to 20.2%.
The main contribution to margin expansion came from slower growth in fuel costs (+15.3%) and personnel costs (+2.7%) relative to revenue (+19.2%). Purchased electricity and capacity costs rose 40.9%, but their share in revenue remains moderate.
Debt increased by RUB 3.0 billion over 12 months to RUB 11.2 billion, equivalent to 3.16 LTM EBITDA
Net debt as of June 30, 2026, stood at RUB 11,163.2 million, up RUB 3.0 billion over the last 12 months (and RUB 2.7 billion since the start of the year). The ratio of net debt to LTM EBITDA is 3.16.
The debt increase is linked to a large investment program: in H1, purchases of property, plant and equipment amounted to RUB 1,808.7 million, and capitalized interest – RUB 483.0 million. Operating cash flow before working capital changes was RUB 2,749.4 million, but after interest and taxes only RUB 877.9 million remained.
Capital expenditures almost twice exceeded operating cash flow, leading to negative free cash flow
In H1 2026, capital expenditures (purchases of property, plant and equipment and intangibles) totaled RUB 1,807.0 million (RUB 1,808.7 million minus RUB 1.7 million proceeds from intangible sales), almost twice the net operating cash flow of RUB 877.9 million. Including capitalized interest (RUB 483.0 million), free cash flow remains deeply negative.
The deficit was covered by raising loans (RUB 200.0 million) and, mainly, by reducing cash on the balance sheet: the balance fell from RUB 8,199.8 million to RUB 1,749.8 million over the half-year. This creates risk for future dividends if the investment program continues at such a pace.
No dividends paid over the last 12 months, but the model estimates a forward yield of 21.6% versus a fair 11.0%
Over the last 12 months, the company paid no dividends (RUB 0.0 per share). However, the 'Enhanced Investments' model estimates the next payment also at RUB 0.0 per share, implying a forward yield of 21.6% (based on the current price). This yield is significantly higher than the 11.0% level we consider fair for this issuer.
The model implies a payout ratio of 0.67 of profit, indicating potential for dividend resumption if the company decides to allocate part of its profit to payments. However, with negative free cash flow and rising debt, this would require either cutting the investment program or taking on additional borrowings.
Shares trade at a discount to their own three-year average EV/EBITDA
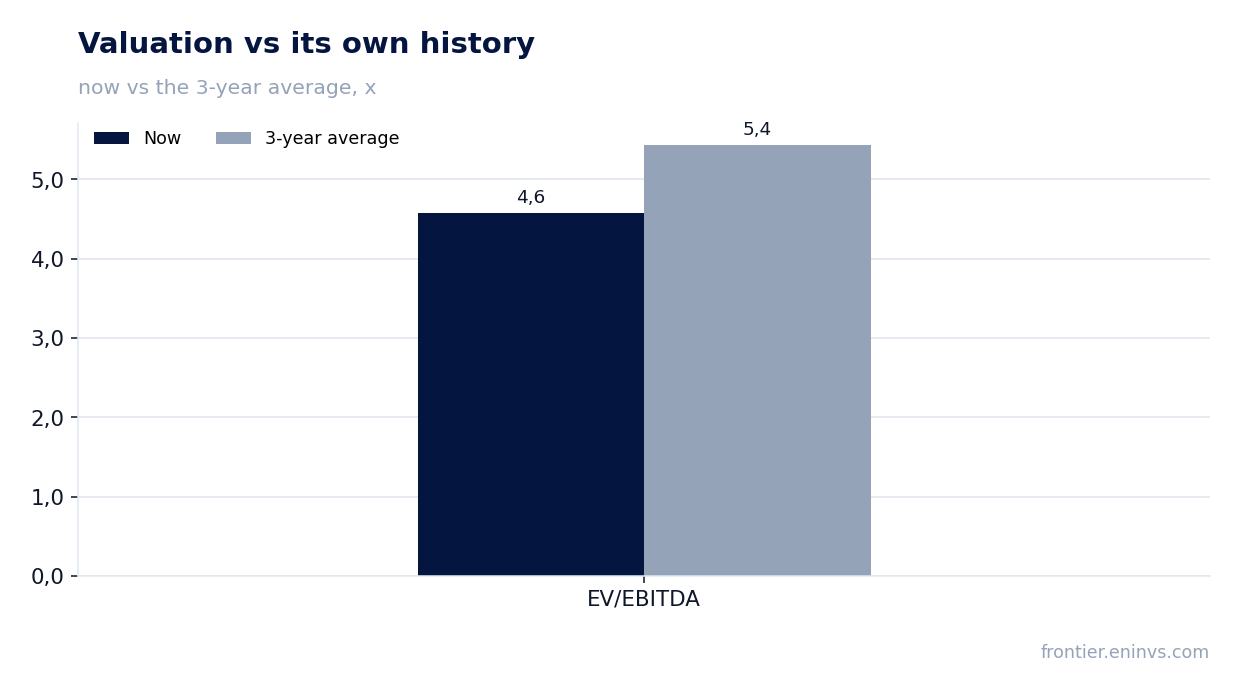
LTM EV/EBITDA is 4.60, 15.4% below the three-year average (5.44). LTM P/E is 7.55. Market capitalization is RUB 5,119.5 million, significantly below the book value of equity (RUB 7,259.5 million as of June 30, 2026).
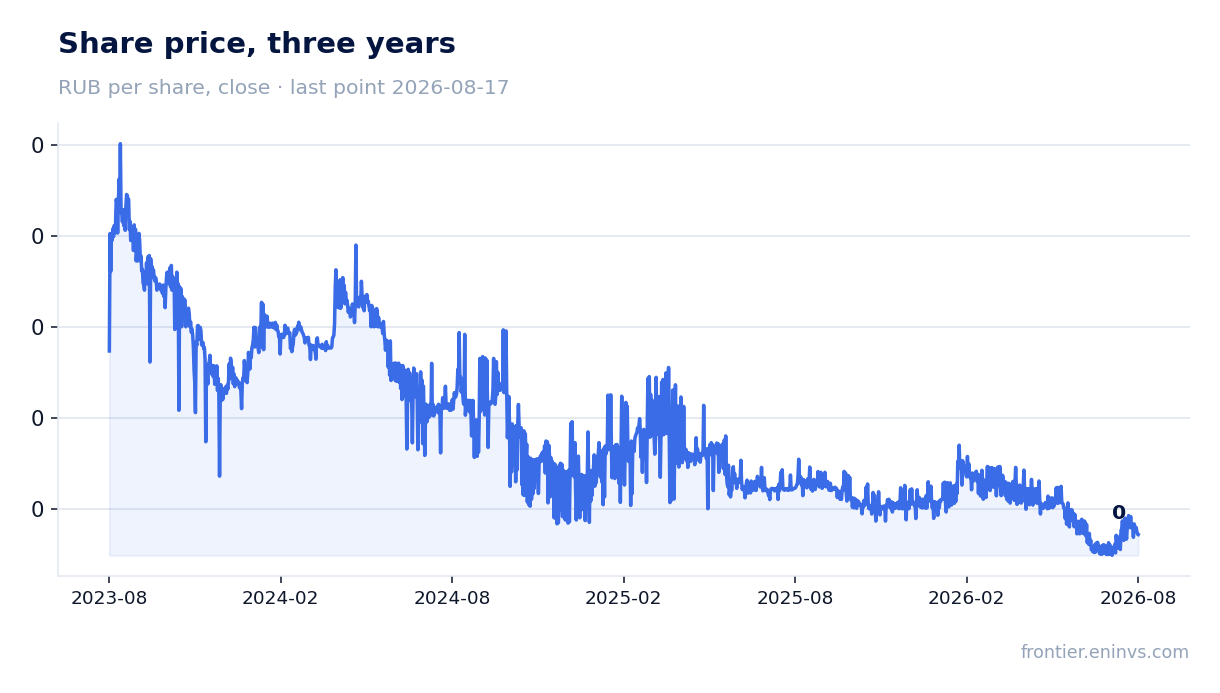
The discount to its own history is partly justified by rising debt and dividend uncertainty, but also reflects negative market sentiment: since the report release (August 10) to August 17, shares lost 9.8%, although they rose 0.8% on the release day.
Return on equity is negative, indicating issues with efficient use of shareholder capital
LTM ROE is -5.1%. This means the company earns less than its cost of capital, typical for companies with high debt and significant investments in fixed assets that have not yet reached full capacity.
Negative return on equity contrasts with the growth in net profit in the reporting period. This is because ROE is calculated on the average equity over the last 12 months, which includes prior-period losses and dividend payments that reduced equity. Nevertheless, it is a signal to shareholders: the company is not yet generating sufficient return on invested capital.
Valuation on the latest reported figures
| Metric | Value |
|---|---|
| Market cap | 5.12 bn ₽ |
| P/E (LTM) | 7.6 |
| EV/EBITDA (LTM) | 4.6 |
| P/B | 0.80 |
| Net debt / EBITDA (LTM) | 3.16 |
| Operating cash flow (LTM) | 2.69 bn |
| ROE | -5.1% |
| EV/EBITDA, 3-year average | 5.4 |
Bottom line
Bottom line: TGK-14 showed a strong H1 – profit doubled, margins expanded, and the company trades at a discount to its own history. However, debt growth of RUB 3.0 billion over 12 months and negative free cash flow question the sustainability of this dynamic. The valuation remains attractive only if investments start generating cash flow and debt burden does not spiral out of control. We rate the share as 'rather attractive': potential exists, but it is coupled with risks that require monitoring.
Open the company's financial profile TGKN →
See also: market overview · valuation map · stock screeners