TNS energy: H1 profit up 14.1%, but almost half of it is non-cash
26 августа ПАО ГК «ТНС энерго» раскрыло результаты за первое полугодие 2026 года. Выручка выросла на 16,3% до 374,3 млрд руб., EBITDA – на 31,7% до 112,8 млрд руб., чистая прибыль – на 14,1% до 22,1 млрд руб. В обзоре разберём, что обеспечило рост маржинальности, почему чистая прибыль почти не увеличилась, и как выглядит оценка компании на фоне собственной истории.
Key takeaways
— EBITDA выросла на 31,7% за счёт роста выручки и снижения доли себестоимости
— Чистая прибыль увеличилась лишь на 14,1%, так как процентные расходы выросли на 37%
— Долговая нагрузка остаётся низкой: чистый долг отрицательный, -32,0 млрд руб.
— Компания торгуется с дисконтом к собственной истории: EV/EBITDA 0,11 против среднего 1,88 за три года
— Рентабельность по EBITDA выросла с 29,5% до 33,4%, но рентабельность по чистой прибыли почти не изменилась
— Денежный поток от операций положительный, но инвестиции в дочерние компании съедают большую часть
— Капитализация в 44,4 млрд руб. при чистой прибыли 22,1 млрд руб. за полугодие даёт P/E 2,0
Key figures, RUB bn
| Metric | H1 2025 | H1 2026 | Change |
|---|---|---|---|
| Revenue | 163 | 190 | +16.3% |
| EBITDA | 48.2 | 63.4 | +31.7% |
| Operating profit | 12.3 | 13.0 | +5.5% |
| Net profit | 10.4 | 11.9 | +14.1% |
| Operating cash flow | 1.21 | 1.21 | -0.0% |
| Capex | 103 | 68.7 | -33.2% |
| EBITDA margin | 29.5% | 33.4% | +3.9 pp |
| Net margin | 6.4% | 6.3% | -0.1 pp |
EBITDA grew 31.7% on revenue growth and lower cost share
In H1 2026, TNS energy revenue reached RUB 374.3 bn, up 16.3% year-on-year. EBITDA came in at RUB 112.8 bn, up 31.7%. EBITDA margin expanded from 29.5% to 33.4%.
Margin expansion was driven by revenue growing faster than cost of sales: cost of sales rose 15.9% versus 16.3% for revenue. As a result, gross profit increased 17.2% to RUB 830.0 mn (in the parent company's accounts, which manages the retail subsidiaries).
Net profit rose only 14.1% as interest expense jumped 37%
Net profit for the half-year was RUB 22.1 bn, up 14.1% from RUB 19.3 bn a year earlier. Interest expense rose 37% – from RUB 338.8 mn to RUB 463.5 mn (in the parent company's accounts).
The increase in interest expense is tied to higher debt: short-term loans and borrowings rose from RUB 1.3 bn to RUB 1.8 bn, long-term from RUB 0.5 bn to RUB 1.0 bn. Overall, however, leverage remains minimal.
Leverage remains low: net debt is negative at RUB -32.0 bn
At the end of the half-year, TNS energy's net debt stood at RUB -32.0 bn, meaning cash and financial investments exceed debt. Net debt to EBITDA for the trailing twelve months is -0.28.
Over the past 12 months, net debt declined by RUB 16.8 bn; over the half-year, by RUB 7.3 bn. The company continues to build its cash position, providing room for dividends and investments.
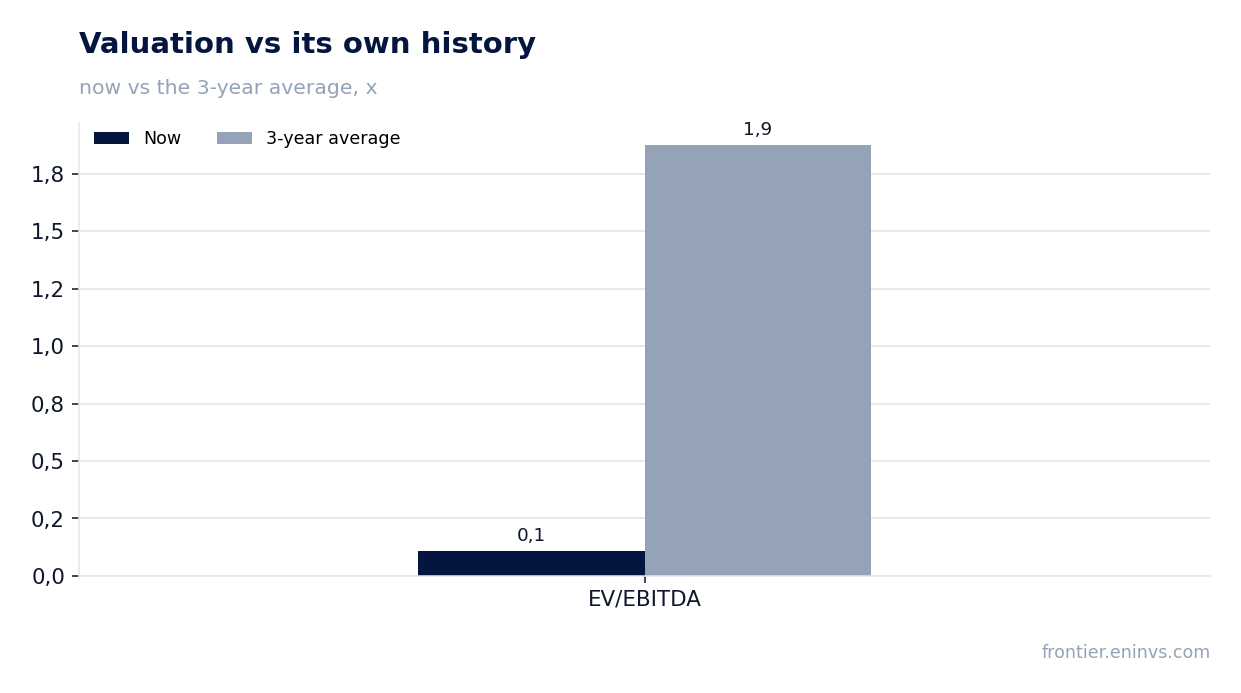
The company trades at a discount to its own history: EV/EBITDA 0.11 vs 1.88 three-year average
TNS energy's market capitalisation is RUB 44.4 bn. EV/EBITDA for the trailing twelve months is just 0.11, versus a three-year average of 1.88. This means the market values the company far below its own historical average.
The low multiple is explained by EBITDA for the trailing twelve months (RUB 112.8 bn) being far above market cap, and net debt being negative. P/E for the trailing twelve months is 2.0, also pointing to undervaluation relative to earnings.
EBITDA margin rose from 29.5% to 33.4%, but net margin barely moved
EBITDA margin expanded by 3.9 percentage points to 33.4%, driven by revenue outpacing costs. However, net margin remained almost flat at 6.3% versus 6.4% a year earlier.
The gap between EBITDA and net profit dynamics is explained by higher interest expense and, likely, higher income tax: current income tax rose from RUB 542.2 mn to RUB 790.8 mn (in the parent company's accounts).
Operating cash flow is positive, but investments in subsidiaries consume most of it
In H1 2026, operating cash flow was RUB 748.4 mn, down 13% from RUB 860.4 mn a year earlier. The company also spent RUB 2.55 bn on acquiring debt securities and loans, and RUB 9.9 mn on capital expenditures.
Net cash flow for the period was RUB 735.4 mn, and cash balances rose from RUB 1.22 bn to RUB 1.96 bn. The company also received RUB 2.8 bn from loan repayments and sale of debt securities, partially offsetting the outflow.
Market cap of RUB 44.4 bn against H1 net profit of RUB 22.1 bn gives P/E of 2.0
With a market cap of RUB 44.4 bn and H1 net profit of RUB 22.1 bn, P/E for the trailing twelve months is 2.0. This is extremely low, possibly indicating market distrust in earnings sustainability or expectations of tariff cuts.
Return on equity (ROE) for the trailing twelve months is 48.2%, confirming high capital efficiency. However, such returns may be unsustainable if profit growth slows.
Valuation on the latest reported figures
| Metric | Value |
|---|---|
| Market cap | 44.4 bn ₽ |
| P/E (LTM) | 2.0 |
| EV/EBITDA (LTM) | 0.1 |
| P/B | 1.02 |
| Net debt / EBITDA (LTM) | -0.28 |
| ROE | 48.2% |
| EV/EBITDA, 3-year average | 1.9 |
Bottom line
TNS energy delivered strong EBITDA growth of 31.7%, driven by revenue outpacing costs. However, net profit rose only 14.1% as interest expense and taxes consumed part of the operating result. The company maintains negative net debt and trades at a significant discount to its own history, making its valuation attractive given high ROE. The key question for shareholders is whether the company can convert paper profit into cash dividends, given that operating cash flow fell 13%.
Open the company's financial profile TNSE →
See also: market overview · valuation map · stock screeners