Unipro: H1 2026 revenue flat, while trailing twelve-month profit is nearly 40 times market cap
On 28 September 2026 Unipro reported results for the first half of 2026. Revenue was RUB 64,123.93 mn, unchanged year on year, and operating profit reached RUB 17,298.668 mn. Over the trailing twelve months net profit was RUB 39,385.5 mn on revenue of RUB 134,300.0 mn. With a market capitalisation of RUB 61,787.73 mn and net debt of minus RUB 90,561.28 mn, the stock trades below 1.6 times trailing earnings, while no dividend was paid over the last 12 months. We find the share attractive: the cash cushion and the discount to its own history outweigh the absence of a dividend and flat revenue.
Key takeaways
— H1 2026 revenue stayed at last year's level – RUB 64,123.93 mn
— Operating profit of RUB 17,298.668 mn on revenue of RUB 64,123.93 mn implies a margin of about 27%
— Trailing twelve-month net profit of RUB 39,385.5 mn is almost two-thirds of annual revenue
— Net debt of minus RUB 90,561.28 mn – the cash cushion exceeds market capitalisation
— No dividend was paid over the last 12 months, and our estimate for the next payout is RUB 0.0 per share
— P/E LTM of 1.57 against a three-year average EV/EBITDA of 1.06 – the stock is cheaper than its own history
— The price is down 3.4% since the release – the market found no reason to bid the shares up
Attractiveness
Key figures, RUB bn
| Metric | H1 2025 | H1 2026 | Change |
|---|---|---|---|
| Revenue | 64.1 | 64.1 | +0.0% |
| EBITDA | 21.0 | — | — |
| Operating profit | 17.3 | 17.3 | +0.0% |
| Net profit | 20.9 | — | — |
| EBITDA margin | 32.7% | — | — |
| Net margin | 32.6% | — | — |
H1 2026 revenue stayed at last year's level – RUB 64,123.93 mn
H1 2026 revenue was RUB 64,123.93 mn, unchanged year on year. The company is not growing sales: generation volumes and prices in the power and capacity markets were roughly the same as a year earlier. For a generating company such stability is not a failure, but it is not a re-rating driver either.
Over the trailing twelve months revenue reached RUB 134,300.0 mn, only slightly more than two half-year figures. This confirms the absence of seasonal spikes or one-off large sales. Revenue growth is not the source of profit in this report – cost control and other income are.
Operating profit of RUB 17,298.668 mn on revenue of RUB 64,123.93 mn implies a margin of about 27%
Operating profit for H1 2026 was RUB 17,298.668 mn. With revenue of RUB 64,123.93 mn, the operating margin is about 27%. That is a high level for thermal generation and shows the company keeps fixed and variable costs under control.
Comparable operating profit for H1 2025 is not in the facts, so the direction of the margin cannot be determined. Still, the absolute figure is large relative to market capitalisation: RUB 17.3 bn for the half-year is more than a quarter of the company's market value.
Trailing twelve-month net profit of RUB 39,385.5 mn is almost two-thirds of annual revenue
Trailing twelve-month net profit was RUB 39,385.5 mn on revenue of RUB 134,300.0 mn. That is about 29% of revenue, well above the 27% operating margin for H1 2026. The gap comes from other income and financial items not visible in operating profit.
Such a high net margin may reflect one-off factors, but the facts do not break them out. For an investor, the key point is that twelve-month profit is nearly 40 times market capitalisation – a setup for undervaluation if the profit is sustainable.
Net debt of minus RUB 90,561.28 mn – the cash cushion exceeds market capitalisation
Net debt at the latest reporting date is minus RUB 90,561.28 mn, meaning cash and equivalents exceed debt by that amount. This is more than the market capitalisation of RUB 61,787.73 mn. The company effectively trades at a discount to its own cash.
Such a cushion ensures financial stability and allows capex to be funded without external debt. However, it does not directly benefit shareholders until it is distributed through dividends or buybacks. How these funds are used remains key to the valuation.
No dividend was paid over the last 12 months, and our estimate for the next payout is RUB 0.0 per share
No dividend was paid over the last 12 months. Our model estimates the next payout at RUB 0.0 per share. This means the company is not distributing profit despite a large cash cushion. The reason could be an investment programme or a decision by the controlling shareholder, but the facts do not disclose it.
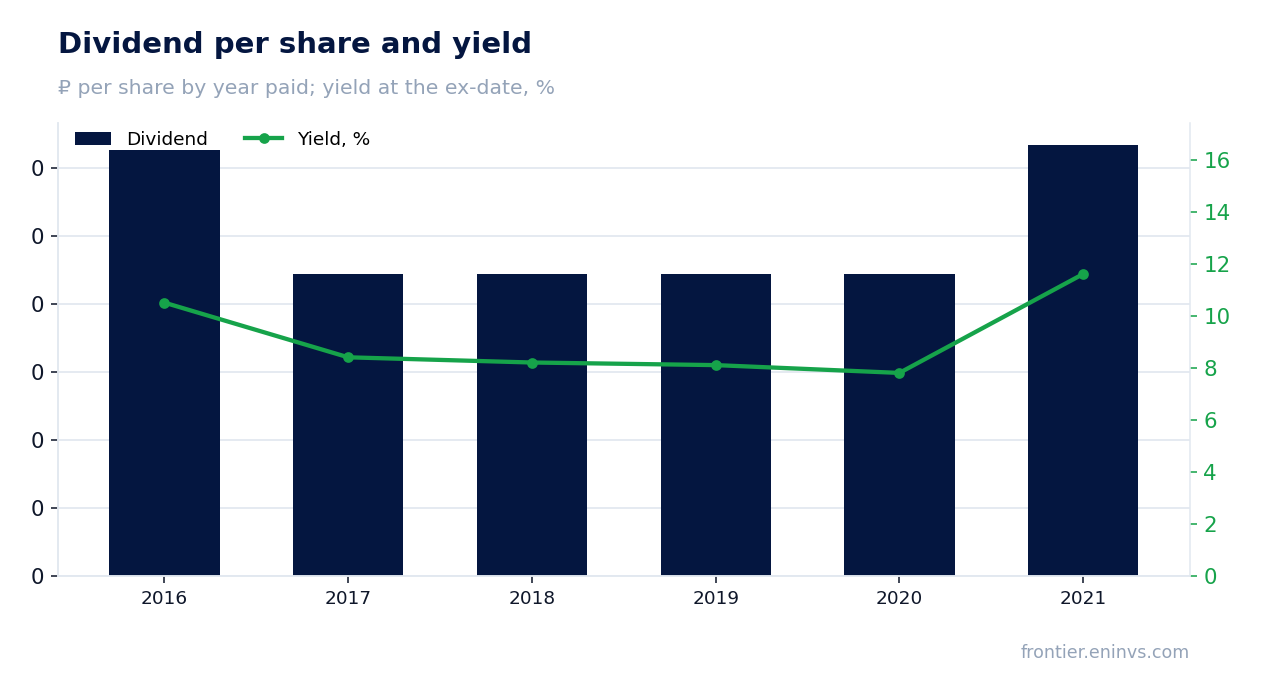
The yield we consider fair for this name is 12.0%. With the central bank key rate at 14.0%, such a yield would need to be delivered by a dividend, but the current payout is zero. The payout history for 2016–2021 shows payments of RUB 0.222 to RUB 0.3172 per share, with yields of 7.8–11.6% to the ex-date price. A resumption of payouts would be a strong catalyst, but it is not there yet.
P/E LTM of 1.57 against a three-year average EV/EBITDA of 1.06 – the stock is cheaper than its own history
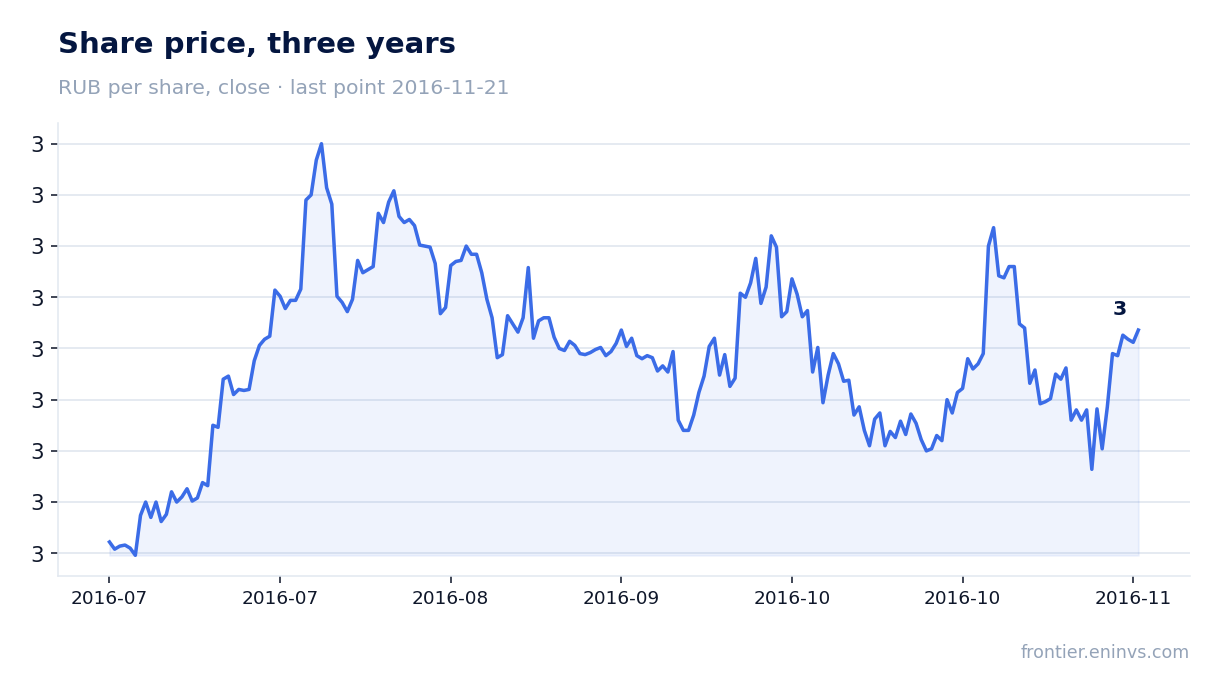
The trailing twelve-month P/E is 1.57. The three-year average EV/EBITDA is 1.06. The two multiples are not directly comparable, but both point to deep undervaluation. A P/E below 2 is rare even for the Russian market, and an EV/EBITDA around 1 means the business is valued below annual operating profit.
With a market capitalisation of RUB 61,787.73 mn and a net cash position of RUB 90,561.28 mn, EV is negative, which makes EV/EBITDA negative. This means the market values the operating business below zero once net cash is taken into account. This can persist until there is clarity on capital allocation.
The price is down 3.4% since the release – the market found no reason to bid the shares up
Since the release the share has lost 3.4%, and on the release day it fell 3.9%. The closing price before the release was RUB 1.0035. The market reaction shows investors saw no improvement in the figures: revenue did not grow, no dividend was declared, and half-year profit is not disclosed in the facts.
The decline came amid a lack of new drivers. At the same time, the fundamentals – the cash cushion and low multiples – remain unchanged. The market is likely waiting for signals on dividend resumption or revenue growth, which the report did not provide.
Valuation on the latest reported figures
| Metric | Value |
|---|---|
| Market cap | 61.8 bn ₽ |
| P/E (LTM) | 1.6 |
| P/B | 0.34 |
| ROE | 16.5% |
Dividend per share, ₽, and yield at the ex-date
| Year paid | Dividend | Yield |
|---|---|---|
| 2016 | 0.31 | 10.5% |
| 2017 | 0.22 | 8.4% |
| 2018 | 0.22 | 8.2% |
| 2019 | 0.22 | 8.1% |
| 2020 | 0.22 | 7.8% |
| 2021 | 0.32 | 11.6% |
Bottom line
Unipro reported H1 2026 with stable revenue of RUB 64,123.93 mn and operating profit of RUB 17,298.668 mn. The key point is not the income statement but the balance sheet: net debt of minus RUB 90,561.28 mn exceeds the market capitalisation of RUB 61,787.73 mn. At the same time, no dividends are paid, and our estimate for the next payout is zero. Trailing twelve-month profit of RUB 39,385.5 mn looks impressive but may contain one-off items. The real strength is the cash cushion and low multiples; the real question is when and how this money will reach shareholders. The share deserves an attractive status for a patient investor willing to wait for payouts to resume.
Open the company's financial profile UPRO →
See also: market overview · valuation map · stock screeners