VK company: 9M revenue rose to RUB 128 bn, but profit turned negative and leverage sits at 2.34x EBITDA
On 21 May 2026, VK company released its operational and unaudited financial results for the first quarter of 2026, along with data for the nine months of 2026. Revenue for the reporting period reached RUB 128 bn, adjusted EBITDA came in at RUB 20.2 bn with a 15.8% margin, and operating cash flow was RUB 17.4 bn. Net profit for the nine months remains negative, while the net debt to EBITDA ratio over the last twelve months stands at 2.34. The shares look neutral: revenue and EBITDA are growing, but negative profit and leverage leave no room for a higher rating.
Key takeaways
— Revenue for the nine months rose to RUB 128 bn, but without a segment breakdown for this period it is impossible to tell what is driving it
— EBITDA of RUB 20.2 bn at a 15.8% margin is a level that has not yet translated into positive net profit
— Operating cash flow of RUB 17.4 bn is almost equal to EBITDA, but capex and interest consume that cushion
— Net debt of RUB 82.3 bn at 2.34x EBITDA is a burden that limits room for manoeuvre
— A valuation of 4.78x LTM EBITDA looks inexpensive, but negative profit and debt prevent that valuation from materialising
— Management's guidance of EBITDA above RUB 24 bn for 2026 is the main benchmark to be tested at year-end
Attractiveness
Key figures, RUB bn
| Metric | — | 9M 2026 | Change |
|---|---|---|---|
| Revenue | — | 128 | — |
| EBITDA | — | 20.2 | — |
| Operating cash flow | — | 17.4 | — |
| EBITDA margin | — | 15.8% | — |
Revenue for the nine months rose to RUB 128 bn, but without a segment breakdown for this period it is impossible to tell what is driving it
VK company's revenue for the nine months of 2026 amounted to RUB 128 bn. This is the only comparable figure for the reporting period disclosed in the press release. The segment breakdown in the document is given only for the first quarter of 2026, so it cannot be extrapolated to the full nine-month period.
In the first quarter of 2026, group revenue was RUB 37.6 bn, up 6% year on year. The main contribution came from the Social Platforms and Media Content segment at RUB 26.1 bn, up 6%. The Business Technologies segment (VK Tech) grew 59% to RUB 4.29 bn, and Educational Technologies grew 23% to RUB 2.5 bn.
This growth structure means that the fastest-growing segments are small in revenue terms, while the core segment adds a modest 6%. For the nine months, this means the overall revenue dynamic of RUB 128 bn rests on a large but slow-growing social segment rather than on the fast-growing technology lines.
EBITDA of RUB 20.2 bn at a 15.8% margin is a level that has not yet translated into positive net profit
Adjusted EBITDA for the nine months of 2026 was RUB 20.2 bn at a 15.8% margin. This means that for every rouble of revenue, the company earns about 16 kopecks of operating profit before depreciation, interest and taxes.
In the first quarter of 2026, EBITDA was RUB 6.4 bn at a 17% margin, up 27% year on year. All operating segments showed positive EBITDA margins. The Social Platforms and Media Content segment generated RUB 6.2 bn of EBITDA at a 24% margin, Educational Technologies RUB 0.6 bn at 24%, and VK Tech RUB 0.28 bn at 7%.
The 15.8% margin for the nine months is below the 17% seen in the first quarter. This means that margins in the second and third quarters were weaker than at the start of the year. At the same time, net profit for the nine months remains negative, and return on equity is minus 3.3%. EBITDA does not cover depreciation, interest and taxes sufficiently to bring the company into profit.
Operating cash flow of RUB 17.4 bn is almost equal to EBITDA, but capex and interest consume that cushion
Operating cash flow for the nine months of 2026 was RUB 17.4 bn. This is roughly 86% of EBITDA for the same period. Such a gap means the company converts operating profit into cash fairly efficiently, but not fully.
The press release does not disclose capital expenditure for the nine months. However, with revenue of RUB 128 bn and negative net profit, it is fair to say that capex and interest expenses together exceed the difference between EBITDA and operating cash flow. Otherwise the company would have shown a positive profit.
In the first quarter of 2026, the company sold a 25% stake in AO Tochka for RUB 21.2 bn and placed exchange-traded bonds worth RUB 10 bn. These one-off inflows increase the cash cushion but are not an operating result. Without them, the cash reserve would be smaller and leverage higher.
Net debt of RUB 82.3 bn at 2.34x EBITDA is a burden that limits room for manoeuvre
VK company's net debt at the end of the latest annual balance sheet was RUB 82.3 bn. The net debt to EBITDA ratio over the last twelve months is 2.34. This level cannot be called critical, but it is not comfortable either for a company with negative net profit.
In the first quarter of 2026, net debt decreased by RUB 20 bn to RUB 62 bn compared with the end of 2025, and the net debt to EBITDA ratio was 2.6. This decrease was partly due to the sale of a 25% stake in AO Tochka for RUB 21.2 bn and the placement of bonds worth RUB 10 bn.
The difference between RUB 62 bn at the end of April 2026 and RUB 82.3 bn at the end of the latest annual balance sheet is explained by different dates. For the investor, what matters is that the company actively manages its debt, but does so partly through asset sales rather than solely through operating cash flow.
A valuation of 4.78x LTM EBITDA looks inexpensive, but negative profit and debt prevent that valuation from materialising
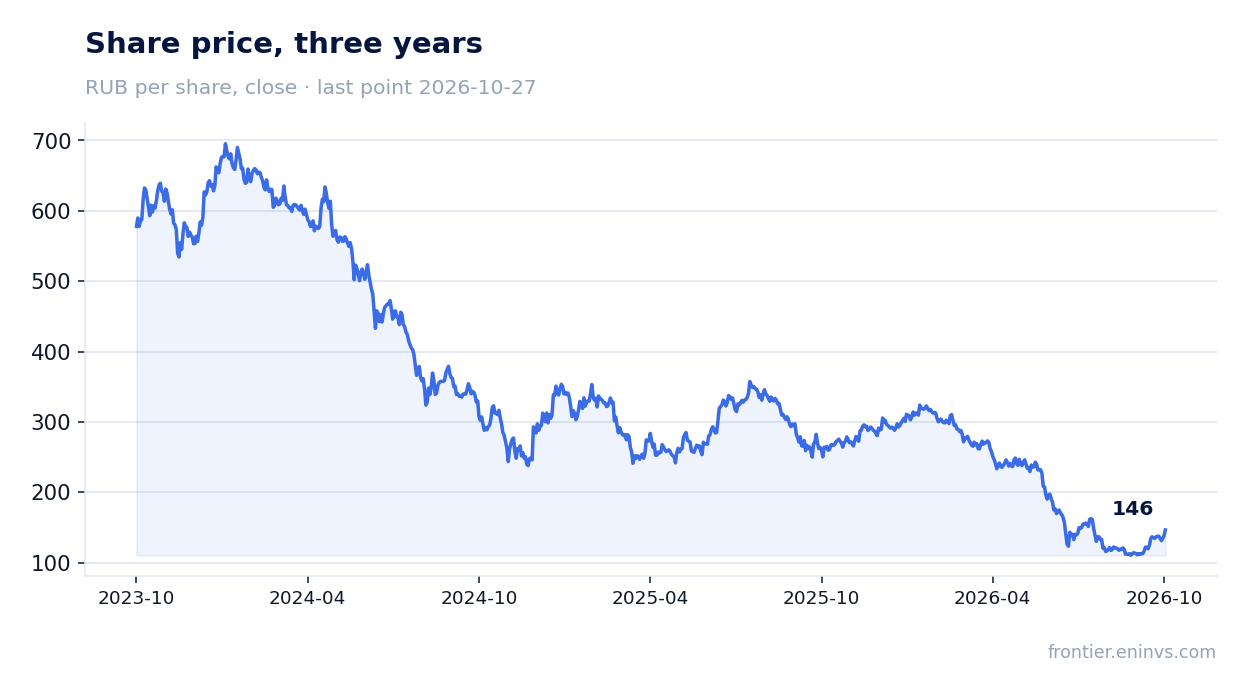
The EV/EBITDA ratio over the last twelve months is 4.78. With a market capitalisation of RUB 85.9 bn and net debt of RUB 82.3 bn, this means investors value the company at about 4.8 times annual EBITDA. For a growing technology business, this is not a high valuation.
However, negative net profit and a return on equity of minus 3.3% mean the company is not yet earning on equity capital. Until profit turns positive, the low EBITDA multiple will remain more a reflection of risks than of undervaluation.
Comparing the current multiple with its own three-year history is not possible: the facts do not include a three-year average. So we limit ourselves to stating: 4.78x EBITDA is a level that implies either significant future profit growth or the persistence of current risks.
Management's guidance of EBITDA above RUB 24 bn for 2026 is the main benchmark to be tested at year-end
In the press release for the first quarter of 2026, the company raised its EBITDA guidance for 2026 to above RUB 24 bn. That is RUB 3.8 bn more than the RUB 20.2 bn for the nine months of 2026. To meet the guidance, the company needs to earn about RUB 3.8 bn of EBITDA in the fourth quarter.
For comparison, EBITDA in the first quarter of 2026 was RUB 6.4 bn. If the fourth quarter is no worse than the first, the guidance is achievable. However, the 15.8% margin for the nine months is below the 17% seen in the first quarter, which points to a possible slowdown.
The main risk to meeting the guidance is the persistence of negative net profit. If interest expenses and depreciation remain high, even meeting the EBITDA guidance will not lead to positive profit. The investor should watch the dynamics of net profit and leverage in the next report.
Valuation on the latest reported figures
| Metric | Value |
|---|---|
| Market cap | 85.9 bn ₽ |
| EV/EBITDA (LTM) | 4.8 |
| P/B | 0.65 |
| Net debt / EBITDA (LTM) | 2.34 |
| ROE | -3.3% |
Bottom line
The strong side of the report remains revenue growth to RUB 128 bn and EBITDA to RUB 20.2 bn for the nine months, along with operating cash flow of RUB 17.4 bn, which almost covers EBITDA. The weak side is negative net profit and leverage of 2.34x EBITDA, which prevent the 4.78x EBITDA valuation from being called undervaluation. The main question for a holder now is whether the company can turn profitable while maintaining current growth. The verdict is neutral: the arguments for and against roughly balance each other out.
Open the company's financial profile VKCO →
See also: market overview · valuation map · stock screeners