VK company: revenue up 11.7%, but trailing operating cash flow is just RUB 3bn

On August 13, VK company reported H1 2026 results. Revenue grew 11.7% YoY to RUB 81.0bn, adjusted EBITDA rose 25.1% to RUB 13.0bn. But trailing twelve-month operating cash flow was just RUB 3.0bn – the key issue in the report, and the analysis shows why profitability is not converting into cash.
Key takeaways
— Revenue +11.7% – acceleration, but the main driver is the 'Technology for Business' segment
— EBITDA +25.1% – margin up to 16.1% on lower marketing and agent fees
— Net loss narrowed threefold, but still minus RUB 3.8bn for the half-year
— Trailing operating cash flow – just RUB 3.0bn, against EBITDA of RUB 38.7bn
— Leverage at 2.13x EBITDA, but the company breached a loan covenant
— Sale of 25% in an associate brought RUB 21.2bn and saved the report
— EV/EBITDA 3.9x – cheap, but cash flow does not confirm the valuation
Key figures, RUB bn
| Metric | H1 2025 | H1 2026 | Change |
|---|---|---|---|
| Revenue | 72.6 | 81.0 | +11.7% |
| EBITDA | 10.4 | 13.0 | +25.1% |
| Operating profit | -5.64 | -5.67 | — |
| Net profit | -12.7 | -3.85 | — |
| Operating cash flow | -5.23 | 15.4 | to profit |
| Capex | 7.24 | 12.4 | +71.8% |
| EBITDA margin | 14.4% | 16.1% | +1.7 pp |
| Net margin | -17.5% | -4.7% | +12.8 pp |
Revenue +11.7% – acceleration, but the main driver is the 'Technology for Business' segment
In H1 2026, VK company's revenue grew 11.7% YoY to RUB 81.0bn. This is an acceleration compared to the previous year, when growth was more modest. The main contributors were the 'Technology for Business' segment – revenue up 40.9% to RUB 9.0bn, and 'Educational Technology' – up 25.8% to RUB 4.9bn.
The largest segment, 'Social Platforms and Media Content', added 13.4% to RUB 57.3bn, while 'Ecosystem Services' grew only 7.3% to RUB 13.7bn. Thus, growth was driven not only by advertising and user payments, but also by the B2B direction, which is becoming a second engine.
EBITDA +25.1% – margin up to 16.1% on lower marketing and agent fees
Adjusted EBITDA for H1 grew 25.1% YoY to RUB 13.0bn, with margin expanding from 14.4% to 16.1%. The main contribution came from lower marketing expenses – down 31.5% to RUB 4.4bn, as well as lower agent/partner fees and media content costs – down 2.1% to RUB 20.5bn.
Personnel costs rose 23.0% to RUB 37.7bn, reflecting investments in development and hiring. Nevertheless, operating efficiency improved, and the company managed to grow EBITDA faster than revenue.
Net loss narrowed threefold, but still minus RUB 3.8bn for the half-year
Net loss for H1 2026 was RUB 3.8bn versus RUB 12.7bn a year earlier. The improvement came from higher EBITDA and one-off factors: gain on sale of an associate – RUB 3.5bn, and lower finance costs – down from RUB 18.0bn to RUB 6.7bn due to debt repayment and lower rates.
Nevertheless, the company remains loss-making, with net margin at minus 4.7% versus minus 17.5% a year ago. This reflects high depreciation and amortisation – RUB 18.7bn for the half-year, which eats up operating profit.
Trailing operating cash flow – just RUB 3.0bn, against EBITDA of RUB 38.7bn
Over the trailing twelve months, VK company's operating cash flow was just RUB 3.0bn, while EBITDA for the same period was RUB 38.7bn. This means the company is not converting profit into cash: the gap is explained by working capital growth, interest and tax payments, and other non-cash adjustments.
In H1 2026, operating cash flow was positive – RUB 15.4bn, but largely thanks to interest received and lower receivables. The sustainability of cash generation remains an open question, especially given capex of RUB 12.4bn for the half-year on property and intangibles.
Leverage at 2.13x EBITDA, but the company breached a loan covenant
Net debt at end-June 2026 stood at RUB 82.3bn, equivalent to 2.13x trailing EBITDA. During the half-year, net debt fell by RUB 22.1bn, and over the year by RUB 8.2bn, mainly due to the sale of an associate stake and positive operating flow.
The report discloses that the company breached a financial covenant under a bank loan, but the bank waived early repayment. This indicates lender loyalty, yet the breach signals strain in financial policy.
Sale of 25% in an associate brought RUB 21.2bn and saved the report
In H1, VK company sold a 25% stake in an associate for RUB 21.2bn, against a carrying value of RUB 17.7bn. The gain of RUB 3.5bn entered the income statement and supported the net result.
The proceeds of RUB 21.2bn went to debt repayment: during the half-year, the company repaid loans and borrowings of RUB 29.9bn, partly refinanced by new borrowings of RUB 15.0bn and a bond issue of RUB 10.0bn. Without this deal, net debt would have been noticeably higher.
EV/EBITDA 3.9x – cheap, but cash flow does not confirm the valuation
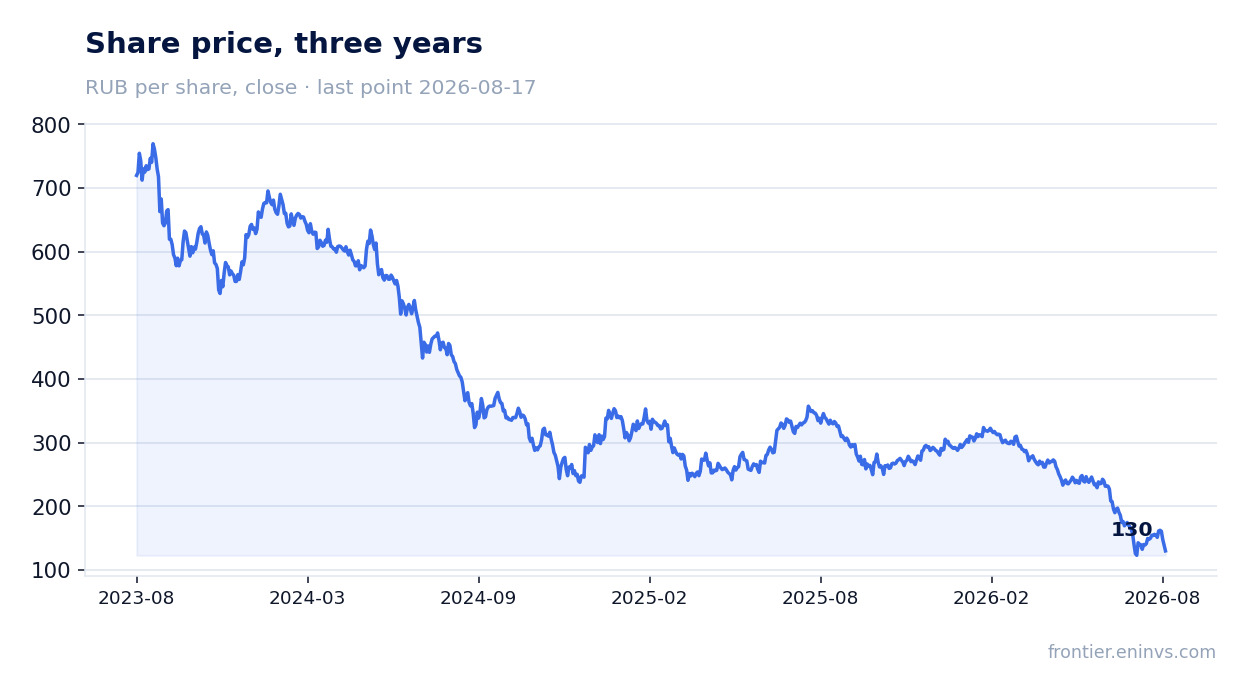
EV/EBITDA on trailing twelve months is 3.9x – a low level for an IT company, especially given revenue and EBITDA growth. However, EBITDA does not reflect the full picture: capitalised development and amortisation of intangibles inflate operating profit.
Operating cash flow of just RUB 3.0bn over twelve months shows that real cash generation is much weaker. Investors relying on EV/EBITDA risk overestimating the business value if cash flow does not recover.
Valuation on the latest reported figures
| Metric | Value |
|---|---|
| Market cap | 69.3 bn ₽ |
| EV/EBITDA (LTM) | 3.9 |
| P/B | 0.21 |
| Net debt / EBITDA (LTM) | 2.13 |
| Operating cash flow (LTM) | 23.6 bn |
| ROE | -3.3% |
Bottom line
VK company's H1 2026 report shows accelerating revenue and EBITDA growth, as well as a significant reduction in net loss. However, earnings quality is low: operating cash flow over twelve months is just RUB 3.0bn, and without the sale of an associate stake, net debt would be significantly higher. The company remains loss-making, and its 3.9x EV/EBITDA valuation looks attractive only against EBITDA, not cash flow. The key question for a holder is whether the company can convert growth into cash, or whether it will have to continue selling assets to service debt.
Open the company's financial profile VKCO →
See also: market overview · valuation map · stock screeners