VseInstrumenti: revenue falls, but EBITDA grows 36% — margin driven by cost cuts

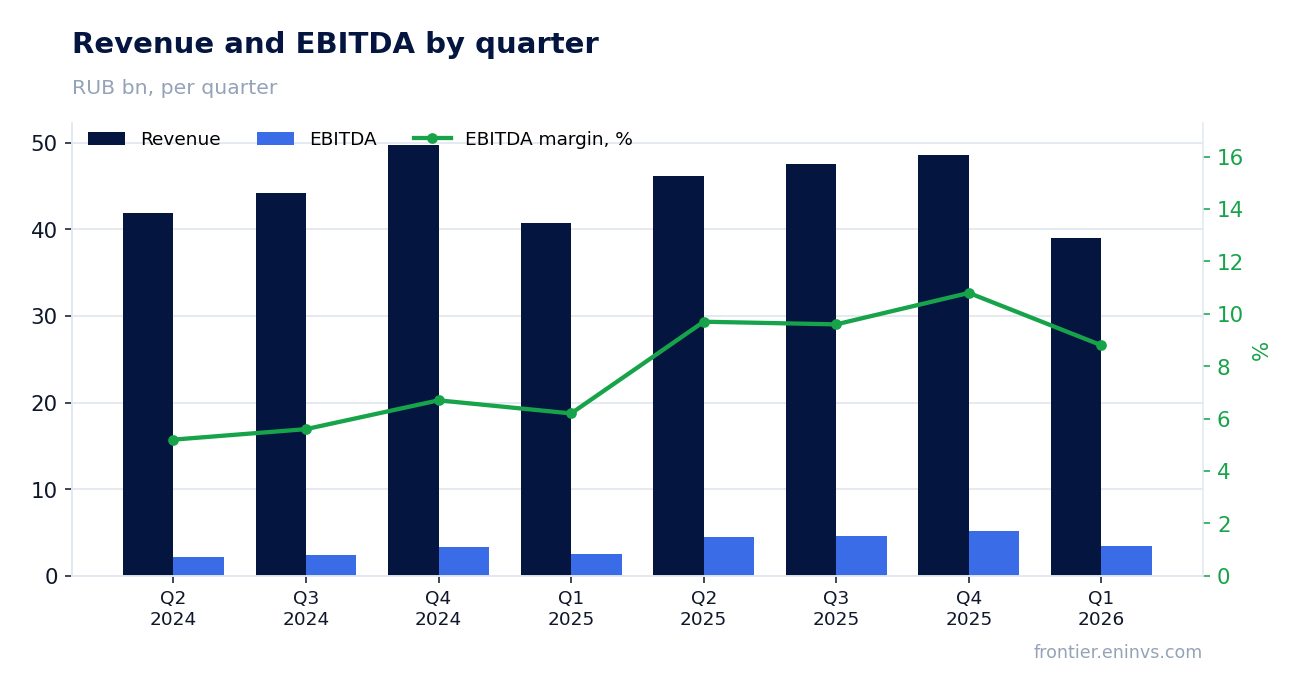
On July 28, 2026, VseInstrumenti reported Q1 2026 results: revenue fell 4.1% YoY to RUB 39,023.6 million, while EBITDA rose 36.0% to RUB 3,417.0 million. This review examines the drivers of margin expansion, changes in debt, and implications for shareholders.
Key takeaways
— EBITDA +36% despite falling revenue — margin driven by lower selling expenses
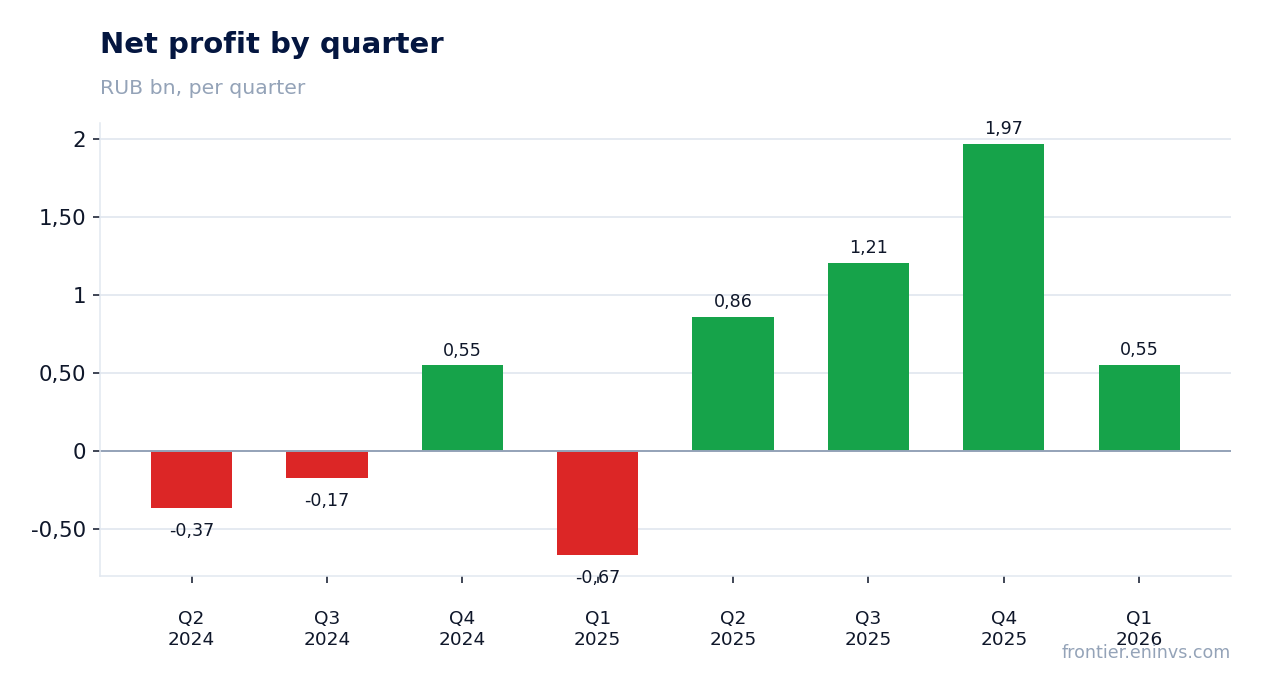
— Net profit turned positive after a loss a year ago — helped by lower finance costs
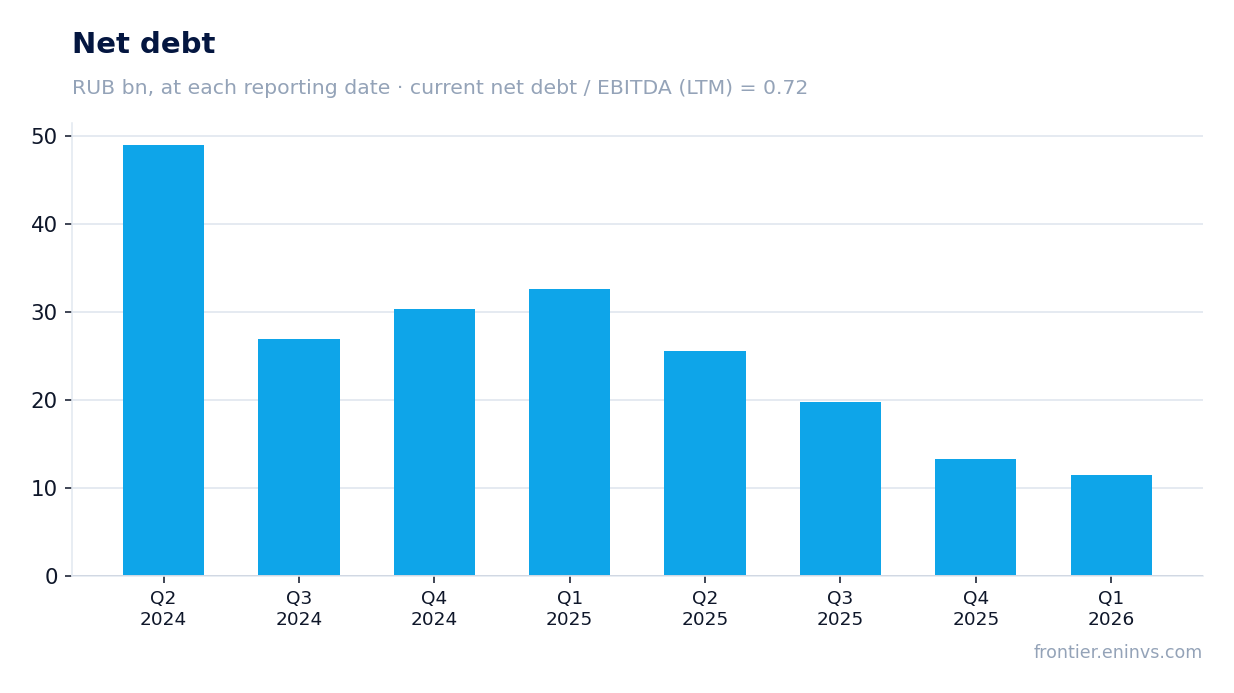
— Debt reduced by RUB 1.8 billion in the quarter — to RUB 11,479.8 million
— Dividend of RUB 7 per share yields 10.1% — above our fair yield of 7%
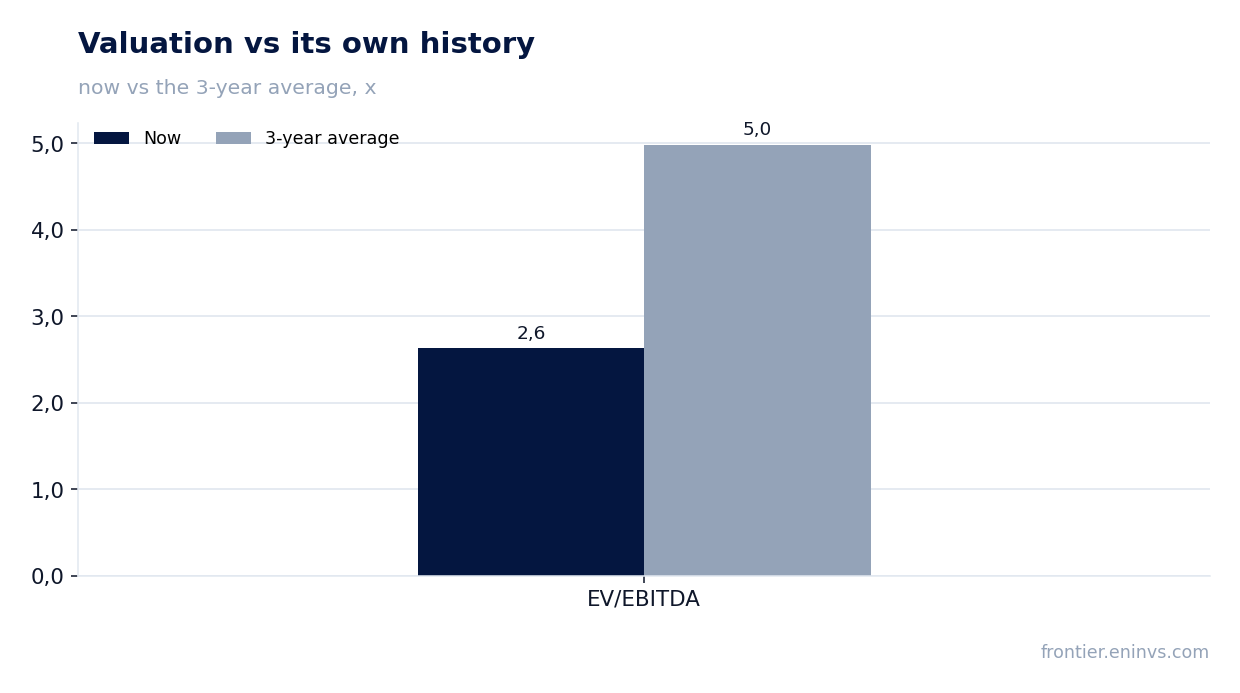
— Valuation: EV/EBITDA 2.6x vs 3-year average 5.0x — shares trade at a discount to history
Key figures, RUB bn
| Metric | Q1 2025 | Q1 2026 | Change |
|---|---|---|---|
| Revenue | 40.7 | 39.0 | -4.1% |
| EBITDA | 2.51 | 3.42 | +36.0% |
| Operating profit | 0.95 | 1.90 | +100.8% |
| Net profit | -0.67 | 0.55 | to profit |
| Operating cash flow | 2.11 | 2.01 | -5.1% |
| Capex | 0.39 | 0.34 | -13.5% |
| EBITDA margin | 6.2% | 8.8% | +2.6 pp |
| Net margin | -1.6% | 1.4% | +3.0 pp |
EBITDA +36% despite falling revenue — margin driven by lower selling expenses
In Q1 2026, VseInstrumenti's revenue amounted to RUB 39,023.6 million, down 4.1% year-on-year. At the same time, EBITDA grew 36.0% to RUB 3,417.0 million, with EBITDA margin expanding from 6.2% to 8.8%.
The main driver of margin expansion was lower selling expenses: they decreased from RUB 10,708.0 million to RUB 9,965.8 million year-on-year. In particular, employee compensation and social contributions fell from RUB 5,327.8 million to RUB 4,722.1 million, and material costs from RUB 318.3 million to RUB 132.6 million. This offset the negative impact of lower revenue on operating profit.
Net profit turned positive after a loss a year ago — helped by lower finance costs
Net profit for Q1 2026 amounted to RUB 552.9 million versus a loss of RUB 669.6 million a year earlier. Net margin improved from -1.6% to 1.4%.
The key factor was lower net finance costs: they decreased from RUB 1,748.0 million to RUB 998.9 million. Interest expense on loans and borrowings fell from RUB 1,425.1 million to RUB 505.3 million, reflecting lower debt and, likely, lower rates. Also, there was no foreign exchange loss this quarter, which a year ago was RUB 338.4 million (within finance income).
Debt reduced by RUB 1.8 billion in the quarter — to RUB 11,479.8 million
Net debt as of March 31, 2026 stood at RUB 11,479.8 million, down RUB 1.8 billion from end-2025 (RUB 13,300.8 million). Over the last 12 months, debt decreased by RUB 18.1 billion.
Net debt to EBITDA for the last 12 months is 0.72x. This is a moderate level, leaving room for dividends and investments. Operating cash flow for the quarter was RUB 2,005.4 million, which financed capital expenditures of RUB 336.1 million and partially repaid debt.
Dividend of RUB 7 per share yields 10.1% — above our fair yield of 7%
Over the last 12 months, the company paid dividends of RUB 7 per share, providing a yield of 10.1% at the current price. Our model's next payout estimate is also RUB 7 per share, implying a forward yield of 10.1%.
This is notably above our fair yield of 7% for this issuer. The implied payout ratio is 0.94 of profit — the company distributes almost all earnings as dividends, which may limit growth opportunities but is attractive for income-oriented shareholders.
Valuation: EV/EBITDA 2.6x vs 3-year average 5.0x — shares trade at a discount to history
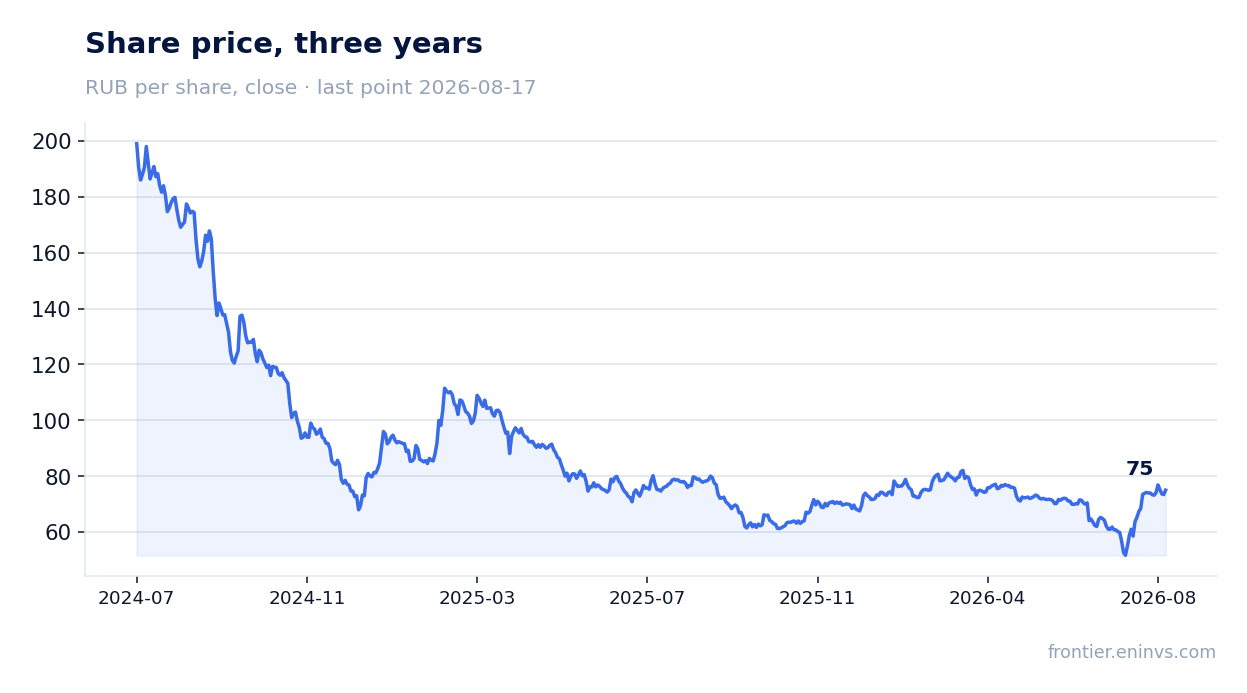
As of August 17, 2026, VseInstrumenti shares trade at an EV/EBITDA of 2.6x (based on LTM EBITDA), significantly below the three-year average of 5.0x. P/E LTM is 7.6x, and ROE is 39.1%.
Since the report release (July 28), shares have risen 14.9%, but still trade at a discount to their own history. Market capitalization is RUB 35,095 million, which, given LTM EBITDA of RUB 18,367.1 million, looks conservative if the company can maintain margins at current levels.
Valuation on the latest reported figures
| Metric | Value |
|---|---|
| Market cap | 35.1 bn ₽ |
| P/E (LTM) | 7.6 |
| EV/EBITDA (LTM) | 2.6 |
| P/B | 6.02 |
| Net debt / EBITDA (LTM) | 0.72 |
| Operating cash flow (LTM) | 15.7 bn |
| ROE | 39.1% |
| Dividend yield (12m) | 4.3% |
| EV/EBITDA, 3-year average | 5.0 |
Bottom line
The strong point of the report is EBITDA growth of 36% despite falling revenue, achieved through strict cost control. Net profit turned positive, debt continues to decline, and a dividend yield of 10.1% looks attractive. However, the revenue decline is a warning sign: the company has not yet found new growth drivers. The question for shareholders is whether management can sustain margins once cost cuts are exhausted.
Open the company's financial profile VSEH →
See also: market overview · valuation map · stock screeners