Whoosh: revenue up 3.6% but a RUB 1.77 bn loss consumed almost all equity
On 27 August Whoosh released its H1 2026 results. Revenue rose 3.6% year on year to RUB 5,564.2 mn, EBITDA fell 4.2% to RUB 967.8 mn, and the net loss reached RUB 1,765.6 mn. With a market capitalisation of RUB 3,775.9 mn and EV/EBITDAC LTM of 5.35, the share looks neutral: operating cash flow is positive, but net debt at 3.87 EBITDA LTM and no dividend leave little room for optimism.
Key takeaways
— Revenue grew just 3.6% while EBITDA fell 4.2% – margin compressed to 17.4%
— The RUB 1,765.6 mn loss almost entirely consumed equity, which shrank to RUB 2,319.1 mn
— Operating cash flow of RUB 301.8 mn is positive, but interest payments absorb RUB 1,324.1 mn
— Net debt at 3.87 EBITDA LTM against a market cap of RUB 3,775.9 mn – debt is 3.6 times the company's value
— No dividends were paid over the last 12 months, and none are planned for this year
— EV/EBITDAC LTM of 5.35 does not look stretched, but the loss and debt outweigh it
Attractiveness
Key figures, RUB bn
| Metric | H1 2025 | H1 2026 | Change |
|---|---|---|---|
| Revenue | 5.37 | 5.56 | +3.6% |
| EBITDA | 1.01 | 0.97 | -4.2% |
| Operating profit | -0.61 | -0.41 | — |
| Net profit | -1.89 | -1.77 | — |
| Operating cash flow | 0.16 | 0.30 | +91.2% |
| Capex | 2.41 | 0.62 | -74.3% |
| EBITDA margin | 18.8% | 17.4% | -1.4 pp |
| Net margin | -35.2% | -31.7% | +3.5 pp |
Revenue grew just 3.6% while EBITDA fell 4.2% – margin compressed to 17.4%
In H1 2026 Whoosh's revenue reached RUB 5,564.2 mn, up 3.6% year on year. Growth was modest given the seasonal factor: most rides occur from May to September, and even in this period the company faced adverse weather and regulatory restrictions in its cities of operation, as stated in the report.
EBITDA fell 4.2% to RUB 967.8 mn, and the EBITDA margin dropped to 17.4% from 18.8% a year earlier. The margin contraction occurred as commercial, general and administrative expenses rose to RUB 1,124.1 mn from RUB 941.0 mn a year earlier. Cost of sales declined to RUB 4,356.4 mn from RUB 4,708.1 mn, but this was not enough to keep operating profit positive.
The operating loss amounted to RUB 410.7 mn, an improvement from a loss of RUB 608.6 mn a year earlier. However, the net loss remained significant at RUB 1,765.6 mn, though smaller than last year's RUB 1,892.9 mn. The main pressure on the net result came from financial expenses of RUB 1,363.1 mn, which were almost unchanged year on year.
The RUB 1,765.6 mn loss almost entirely consumed equity, which shrank to RUB 2,319.1 mn
The net loss for H1 2026 was RUB 1,765.6 mn. This caused equity to shrink to RUB 2,319.1 mn as of 30 June 2026 from RUB 4,001.3 mn as of 31 December 2025. Retained earnings turned negative at minus RUB 583.7 mn.
Loss per share was RUB 15.90 versus RUB 17.17 a year earlier. The reduction in loss came mainly from lower cost of sales, but it did not offset higher administrative expenses and high financial expenses.
Equity now stands at only RUB 2.3 bn against assets of RUB 21.3 bn. Net debt at 3.87 EBITDA LTM and negative retained earnings create a risk of further capital erosion if losses continue.
Operating cash flow of RUB 301.8 mn is positive, but interest payments absorb RUB 1,324.1 mn
Operating cash flow for H1 2026 was RUB 301.8 mn, better than last year's RUB 157.8 mn. However, this flow was generated mainly by depreciation of RUB 1,264.7 mn and a decrease in inventories of RUB 244.1 mn, not by profit.
Interest paid amounted to RUB 1,324.1 mn, significantly exceeding operating cash flow. The company is forced to finance interest payments through new borrowings: proceeds from loans and bonds in the half-year reached RUB 3,057.6 mn.
Capital expenditures in H1 2026 were RUB 618.7 mn, well below last year's RUB 2,411.4 mn. The reduction in fixed asset investments is part of the margin improvement programme, but it also limits future growth.
Net debt at 3.87 EBITDA LTM against a market cap of RUB 3,775.9 mn – debt is 3.6 times the company's value
Net debt as of 30 June 2026 was RUB 13,793.1 mn. The net debt to EBITDA LTM ratio is 3.87. This is a high level for a company generating a net loss. Market capitalisation is only RUB 3,775.9 mn, meaning debt is 3.6 times the company's value.
Since the start of the year net debt has barely changed: from RUB 14.0 bn on 31 December 2025 to RUB 13.8 bn on 30 June 2026. Over the last 12 months net debt rose from RUB 12.2 bn on 30 June 2025 to RUB 13.8 bn on 30 June 2026.
The report notes that the group has refinancing options under a bond programme of up to RUB 30 bn. After the reporting date the company redeemed the ВУШ-001Р-02 bond series for RUB 4,000.0 mn. This reduces short-term pressure but does not solve the high debt burden.
No dividends were paid over the last 12 months, and none are planned for this year
No dividends were paid over the last 12 months. In 2024 the company paid RUB 2.11 per share, which at an ex-date price of RUB 146.72 gave a yield of 1.4%. In 2023 the payout was RUB 10.25 per share with a yield of 4.6%.
The fair yield for the company, in our estimate, is 7.0%. At the current price of RUB 41.98 this implies a dividend of about RUB 2.94 per share. However, with a loss in H1 2026 and negative retained earnings, a dividend this year is unlikely.
The CBR key rate is 14.0%. A yield of 7.0% is below the rate, making the dividend scenario unattractive even if payouts resume. Until the company returns to profit, dividends will remain in question.
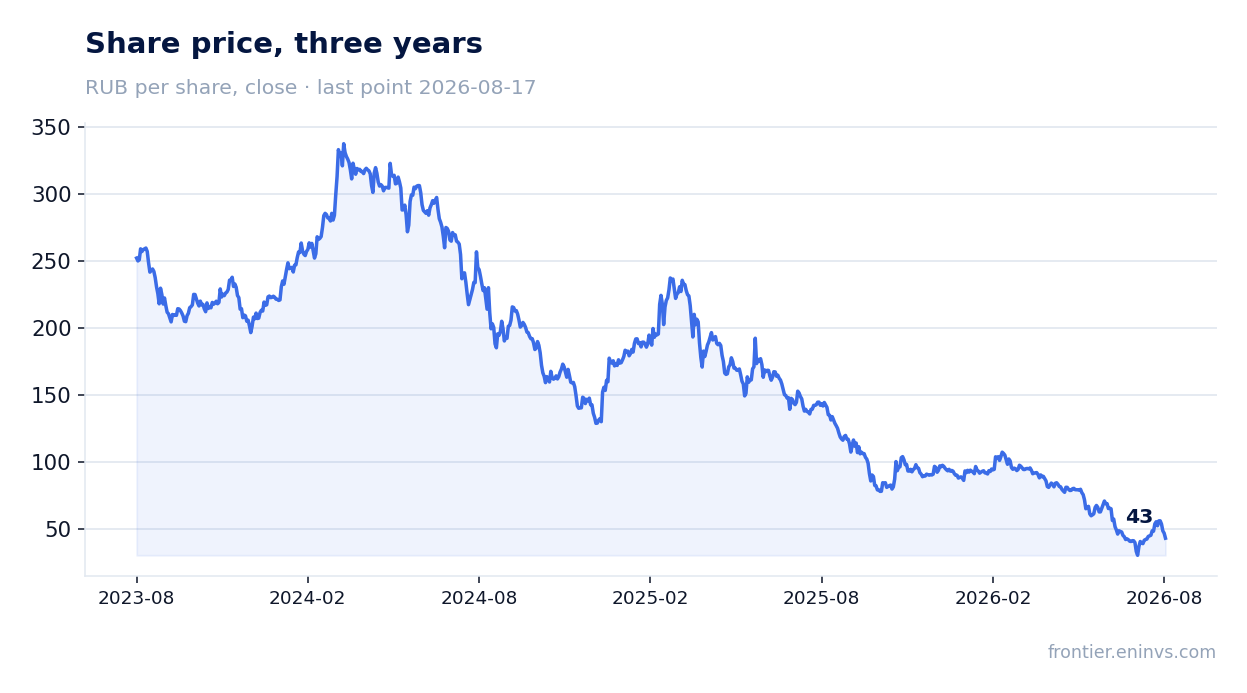
EV/EBITDAC LTM of 5.35 does not look stretched, but the loss and debt outweigh it
EV/EBITDAC LTM is 5.35, below EV/EBITDA LTM of 4.99. The difference is explained by capitalised development costs: EBITDAC LTM is RUB 3,284.2 mn versus EBITDA LTM of RUB 3,563.0 mn. For a company that capitalises development, EV/EBITDAC is the more honest multiple, and it does not look stretched.
However, the valuation does not account for the loss and debt. With a market cap of RUB 3,775.9 mn and net debt of RUB 13,793.1 mn, EV is about RUB 17.6 bn. That is 5.35 times EBITDAC LTM, but 4.6 times LTM revenue of RUB 12,700.0 mn.
Comparing the current multiple with its own three-year history is impossible because the FACTS do not contain historical values. But even without that comparison, it is clear that the market values the company based on high debt and losses, not operating efficiency.
Valuation on the latest reported figures
| Metric | Value |
|---|---|
| Market cap | 3.78 bn ₽ |
| EV/EBITDA (LTM) | 5.0 |
| EV/EBITDAC (EBITDA less capitalised development) | 5.3 |
| P/B | 0.94 |
| Net debt / EBITDA (LTM) | 3.87 |
| Operating cash flow (LTM) | -2.79 bn |
| ROE | -111.7% |
Dividend per share, ₽, and yield at the ex-date
| Year paid | Dividend | Yield |
|---|---|---|
| 2023 | 10.25 | 4.6% |
| 2024 | 2.11 | 1.4% |
Bottom line
Whoosh ended H1 2026 with a loss of RUB 1,765.6 mn, which almost entirely consumed equity. Revenue grew only 3.6% while EBITDA fell 4.2% – the margin compressed to 17.4%. Operating cash flow is positive, but interest payments of RUB 1,324.1 mn exceed it. Net debt at 3.87 EBITDA LTM and no dividends make the share unattractive for income-oriented investors. At the current price of RUB 41.98 and EV/EBITDAC LTM of 5.35, the valuation does not look stretched, but the loss and debt outweigh it.
Open the company's financial profile WUSH →
See also: market overview · valuation map · stock screeners