X5 Retail: revenue grows 10.5%, but net profit falls 28.4% — 33.6% dividend yield does not mask the earnings quality question

On August 13, 2026, X5 Retail reported H1 2026 results: revenue grew 10.5% to RUB 2,480.5 bn, EBITDA rose 8.7%, but net profit fell 28.4% to RUB 33.6 bn. At the current price, the share looks rather attractive: EV/EBITDA multiple (2.5x) is below its own three-year average (2.6x), the dividend yield of 33.6% is more than 1.5 times the fair yield of 22.6%, and the portal's model implies +56% upside.
Key takeaways
— H1 revenue grew 10.5%, but Q2 growth slowed to 11.3% from 20.7% a year earlier
— H1 EBITDA margin fell 0.1 pp to 5.7% — cost growth ate part of operational efficiency
— H1 net profit fell 28.4% — despite operating profit rising 31.2%, finance costs and taxes were the main drag
— Net debt at end-H1 stood at RUB 228.5 bn, with net debt/EBITDA LTM at 0.86x
— Dividend over the last 12 months was RUB 613 per share, a yield of 33.6% versus a fair 22.6%
— H1 capex was RUB 93.4 bn — the company continues to actively expand its network
— The portal's model implies +56% upside to fair value
Attractiveness
Key figures, RUB bn
| Metric | H1 2025 | H1 2026 | Change |
|---|---|---|---|
| Revenue | 2 244 | 2 481 | +10.5% |
| EBITDA | 130 | 141 | +8.7% |
| Operating profit | 112 | 125 | +10.9% |
| Net profit | 48.1 | 34.5 | -28.4% |
| Operating cash flow | 75.5 | 109 | +44.4% |
| Capex | 89.8 | 75.7 | -15.7% |
| EBITDA margin | 5.8% | 5.7% | -0.1 pp |
| Net margin | 2.1% | 1.4% | -0.7 pp |
H1 revenue grew 10.5%, but Q2 growth slowed to 11.3% from 20.7% a year earlier
In H1 2026, X5 Retail's revenue reached RUB 2,480.5 bn, up 10.5% year-on-year. The main driver remains the retail chain: Pyaterochka sales rose to RUB 1,909.0 bn, Perekrestok to RUB 281.0 bn, and Chizhik to RUB 251.6 bn. X5 Digital grew 26.6% and now contributes 7.5% of consolidated revenue.
However, momentum is slowing: in Q2 2026, growth was 11.3% versus 20.7% a year earlier. Net retail sales grew 10.8% — slower than total revenue, indicating faster growth in the wholesale/B2B segment. The company continues to expand its network: selling space increased 8.0%, and LFL sales rose 6.1%.
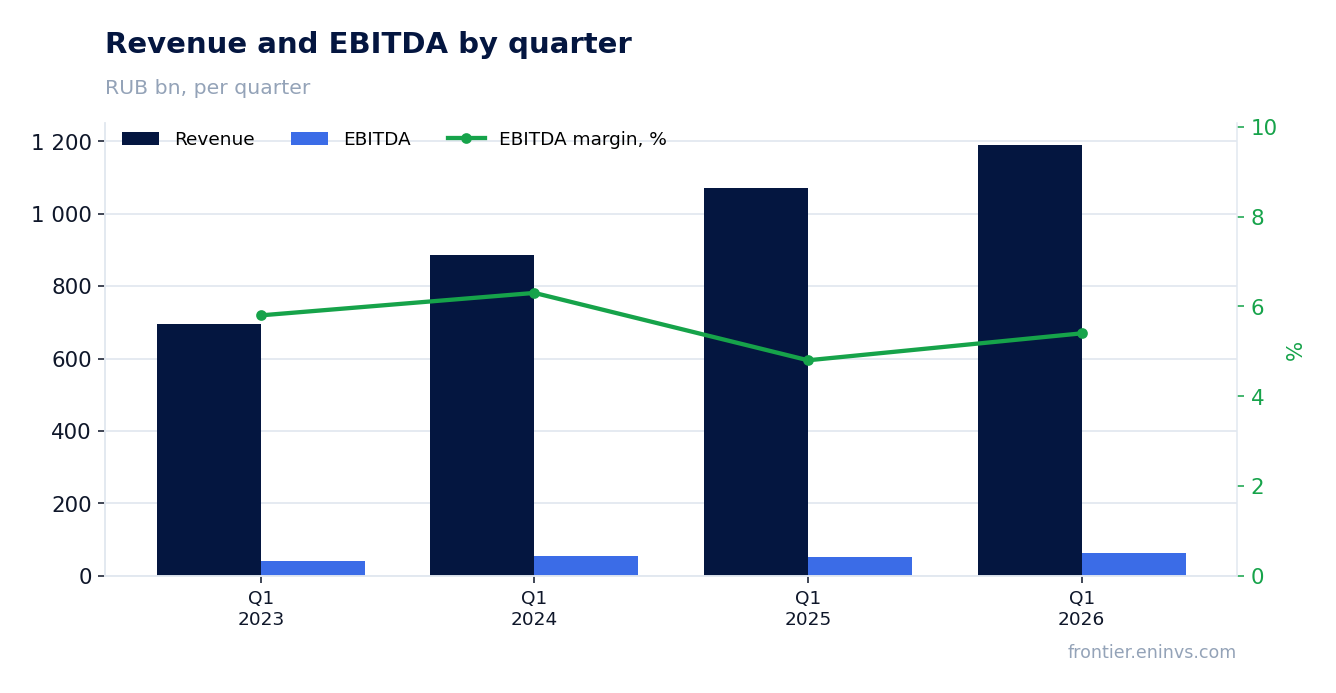
H1 EBITDA margin fell 0.1 pp to 5.7% — cost growth ate part of operational efficiency
EBITDA for H1 2026 was RUB 264.4 bn (LTM), and for the reported period RUB 141.5 bn (calculated: 264.4 – 122.9). The EBITDA margin fell 0.1 pp to 5.7% from 5.8% a year earlier. At the same time, gross margin rose 0.74 pp to 24.1%, indicating sustained pricing power.
The decline in EBITDA margin despite higher gross margin points to pressure from selling and administrative expenses. The company continues to invest in network expansion and digital projects, increasing operating costs. In Q2 2026, EBITDA grew 25.8% to RUB 64.3 bn, but the margin remained under pressure.
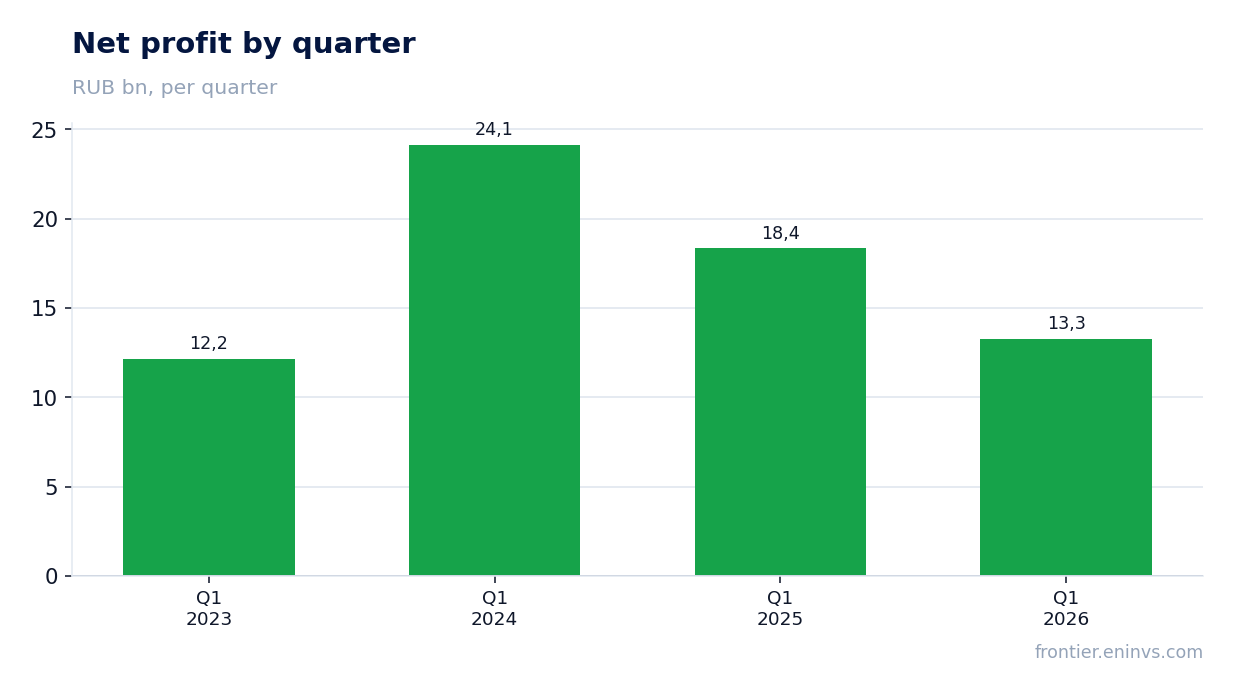
H1 net profit fell 28.4% — despite operating profit rising 31.2%, finance costs and taxes were the main drag
Net profit for H1 2026 was RUB 33.6 bn, down 28.4% year-on-year. Operating profit rose 31.2%, so the decline occurred below the operating line. The main factors were finance costs and taxes, although the company did not disclose a detailed bridge.
In Q2 2026, net profit was RUB 13.3 bn — down 27.6% from Q2 2025. High interest rates are pressuring net profit: the weighted average effective rate on borrowings for H1 was 16.54% per annum, lower than 20.72% a year earlier but still significant. Net margin fell to 1.4% from 2.1%.
Net debt at end-H1 stood at RUB 228.5 bn, with net debt/EBITDA LTM at 0.86x
As of June 30, 2026, X5 Retail's net debt was RUB 228.5 bn, down RUB 24.8 bn from the previous reporting date but up RUB 52.3 bn year-on-year. Net debt/EBITDA LTM stood at 0.86x, a moderate level for a retail chain.
The company complies with loan covenants: net debt/EBITDA pre-IFRS 16 is 1.08x versus a maximum of 4.00x. The debt portfolio is diversified: bonds and bilateral ruble loans. Interest expenses for H1 were RUB 57.6 bn on leases and RUB 57.6 bn on borrowings (calculated).
Dividend over the last 12 months was RUB 613 per share, a yield of 33.6% versus a fair 22.6%
Over the last 12 months, X5 Retail paid RUB 613 per share, providing a dividend yield of 33.6% versus a fair yield of 22.6%. The portal's model estimates the next dividend at RUB 613 per share, implying a forward yield of 33.6%.
The payout ratio is 0.86 of profit — the company distributes almost all net profit to shareholders. However, no new dividend was announced in the H1 2026 report; the last payment was in late 2025. At the current price, the dividend yield significantly exceeds the fair level, making the share attractive for income investors.
H1 capex was RUB 93.4 bn — the company continues to actively expand its network
Adjusted capex for H1 2026 was RUB 93.4 bn, down 6% from RUB 99.3 bn a year earlier. The bulk of investment went to the Pyaterochka segment — RUB 49.1 bn — and other segments — RUB 31.2 bn.
The company continues to expand its network: as of June 30, 2026, it operated 30,604 stores. Selling space grew 8.0% year-on-year. Capex is funded by operating cash flow, which over the last 12 months was RUB 237.9 bn, providing headroom for further growth.
The portal's model implies +56% upside to fair value
Our fundamental value-creation model, based on EBITDA growth and the target multiple, estimates X5 Retail's upside potential at +56% to fair value. This is the portal's own calculation, not market consensus or a target price.
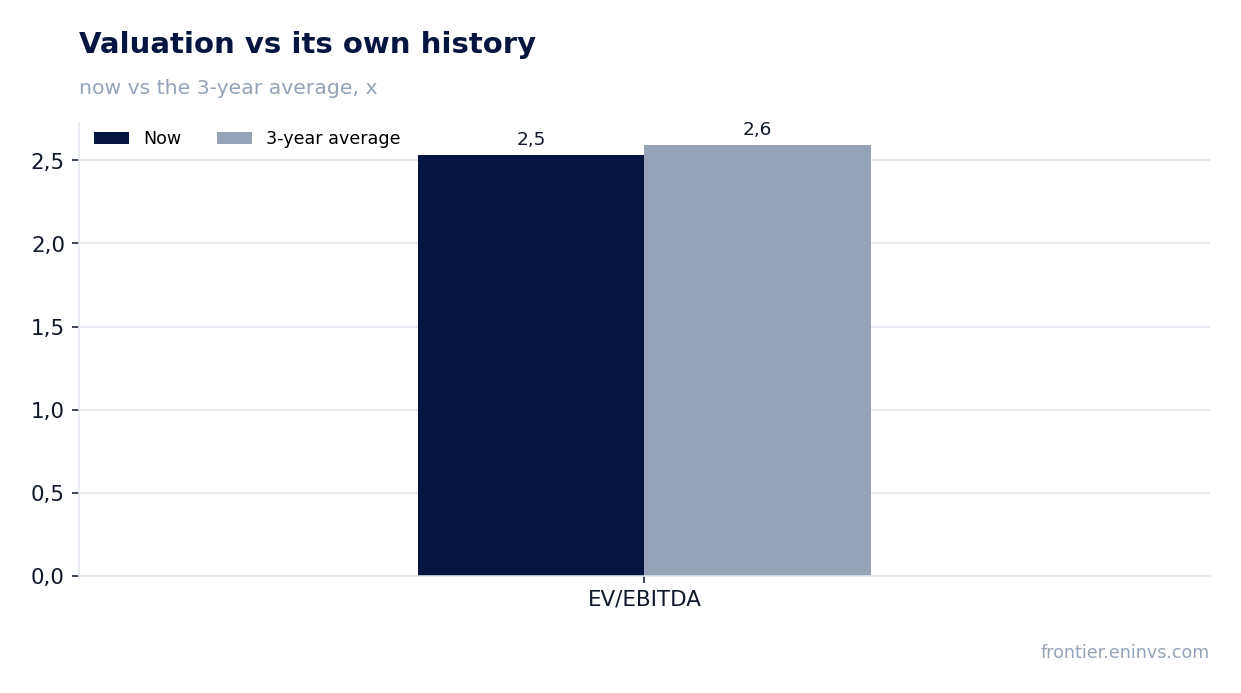
At the current market cap of RUB 442.7 bn and EV/EBITDA LTM of 2.5x, the share trades below its own three-year average (2.6x). P/E LTM is 5.5x, also indicating undervaluation. The share is held in our model strategies: RU AI conviction (Claude), RU AI long-short (market-neutral), and RU Growth-potential (quality).
Valuation on the latest reported figures
| Metric | Value |
|---|---|
| Market cap | 443 bn ₽ |
| P/E (LTM) | 5.5 |
| EV/EBITDA (LTM) | 2.5 |
| P/B | 4.57 |
| Net debt / EBITDA (LTM) | 0.86 |
| Operating cash flow (LTM) | 271 bn |
| ROE | 80.9% |
| Dividend yield (12m) | 33.8% |
| EV/EBITDA, 3-year average | 2.6 |
Bottom line
X5 Retail demonstrates steady revenue and operating profit growth, but net profit is falling due to finance costs and taxes. The company maintains a high dividend yield of 33.6% and a moderate debt level (0.86x EBITDA LTM). The share trades below its own three-year multiple, and the portal's model implies +56% upside. The key question for holders is whether the company can restore net profit as rates decline, and whether slowing growth will lead to dividend cuts. At the current price, the share looks rather attractive.
Open the company's financial profile X5 →
See also: market overview · valuation map · stock screeners