AbbVie Inc.: double-digit revenue growth, but the valuation is already above its own history

In its Q3 2026 report, AbbVie Inc. posted revenue of $17,404 million, up 10.3% year on year. The growth rate was roughly the same as in Q2 2026, when it stood at 10.2%. Over the trailing twelve months, revenue reached $66,000 million, net profit $6,310 million, and EBITDA $23,061 million. At the same time, the LTM EV/EBITDA multiple is 25.1, 35% above its own three-year average of 18.6. On the portal's model, the upside to fair value is -2%. Against this backdrop the share looks neutral: the business is growing steadily, but that growth is already priced in.
Key takeaways
— Q3 revenue grew 10.3% year on year, and the pace was roughly unchanged from Q2
— Over the trailing twelve months net profit was $6,310 million on revenue of $66,000 million, implying a modest net margin
— Leverage at 2.48x EBITDA is moderate, but the direction of change cannot be assessed from the available data
— A dividend yield of 2.35% is modest for a company with this revenue momentum
— The EV/EBITDA multiple of 25.1 is 35% above its own three-year average of 18.6
— On the portal's model the share trades 2% above fair value
Attractiveness
Key figures, USD bn
| Metric | Q3 2025 | Q3 2026 | Change |
|---|---|---|---|
| Revenue | 15.8 | 17.4 | +10.3% |
| EBITDA | 4.00 | — | — |
| Operating profit | 1.90 | — | — |
| Net profit | 0.19 | — | — |
| Operating cash flow | 7.02 | — | — |
| Capex | 0.38 | — | — |
| EBITDA margin | 25.3% | — | — |
| Net margin | 1.2% | — | — |
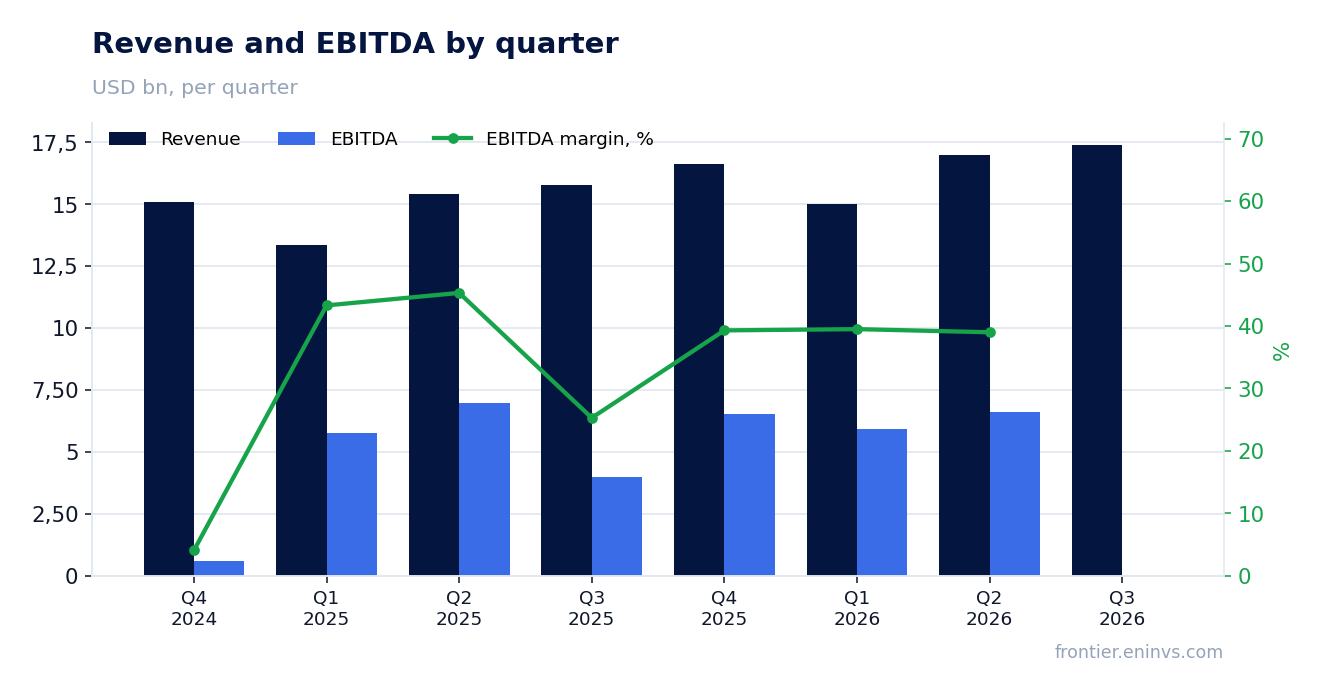
Q3 revenue grew 10.3% year on year, and the pace was roughly unchanged from Q2
Q3 2026 revenue came in at $17,404 million, up 10.3% from Q3 2025. In Q2 the growth rate was 10.2%, so the pace was roughly unchanged. The company has now delivered double-digit growth for two consecutive quarters.
For context, revenue grew 12.4% in Q1 2026 and 10.0% in Q4 2025. Growth remains steady, but there is no acceleration. Over the trailing twelve months revenue reached $66,000 million.
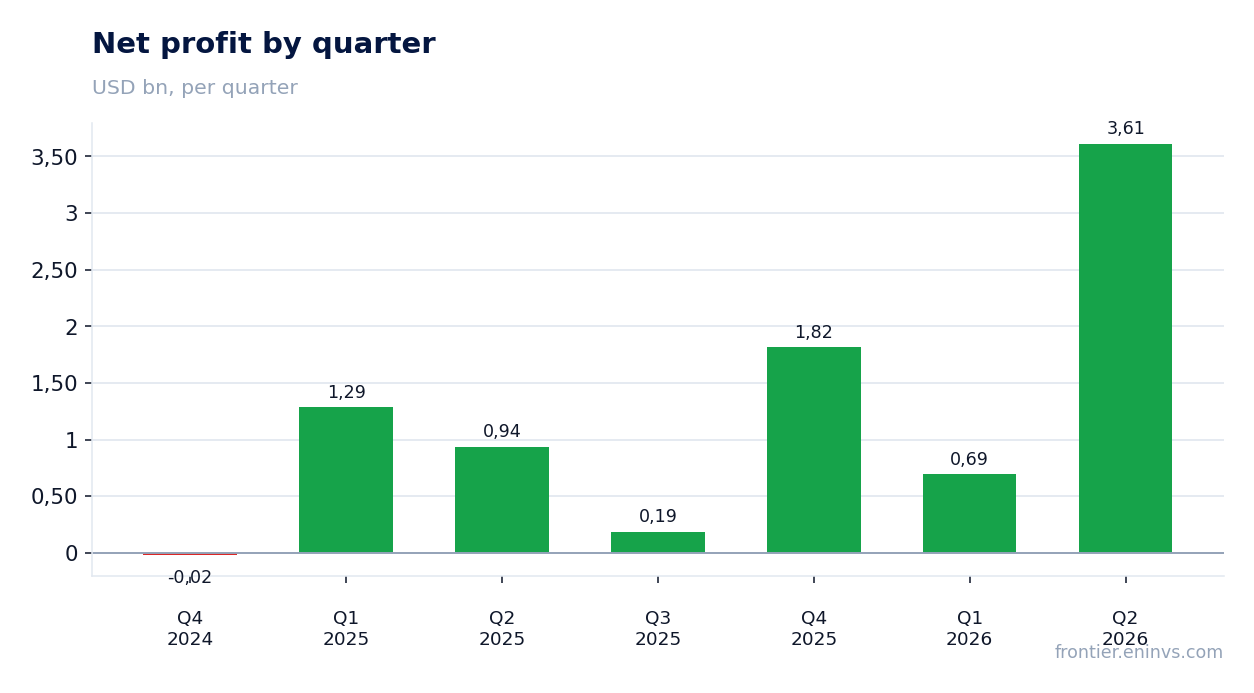
Over the trailing twelve months net profit was $6,310 million on revenue of $66,000 million, implying a modest net margin
Over the trailing twelve months net profit was $6,310 million on revenue of $66,000 million. That implies a net margin of about 9.6%, which is modest for a company of this revenue scale.
EBITDA for the same period was $23,061 million, or about 35% of revenue. The gap between EBITDA and net profit is significant, pointing to substantial charges below the operating line – interest, depreciation and taxes. The Q3 2026 report does not disclose profit figures, so only the trailing twelve-month data can be used.
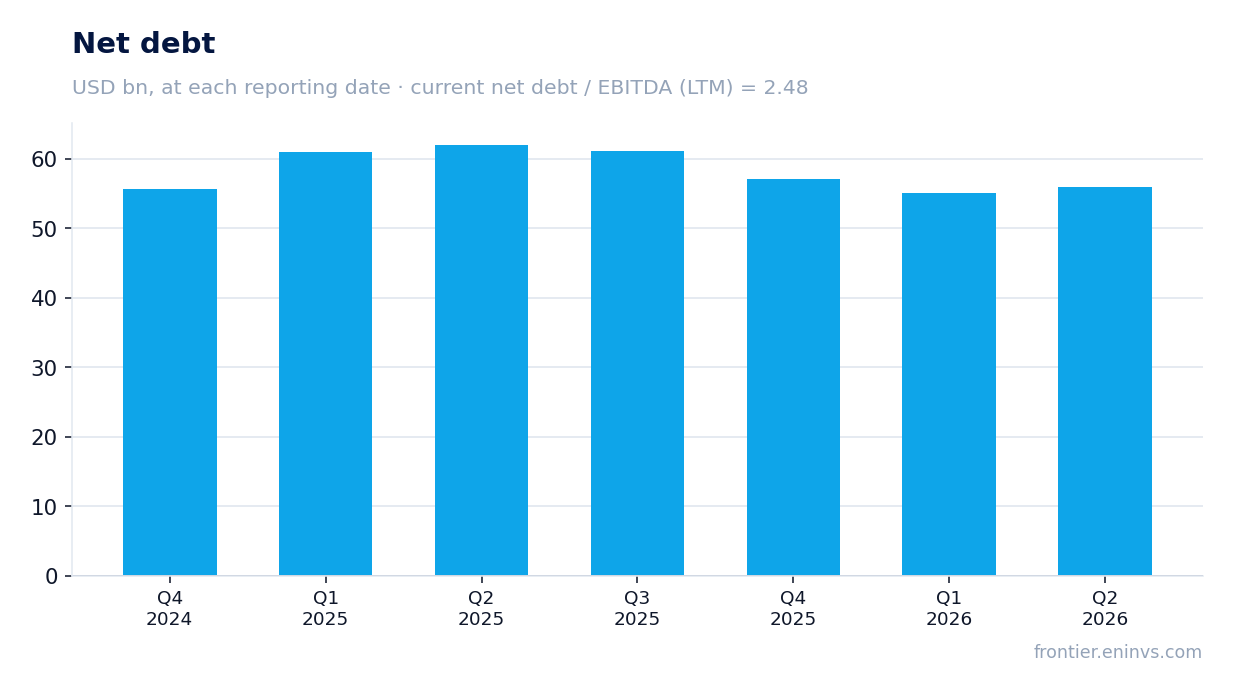
Leverage at 2.48x EBITDA is moderate, but the direction of change cannot be assessed from the available data
Net debt at the latest balance-sheet date was $57,094 million, equivalent to 2.48x trailing twelve-month EBITDA. That is a moderate level for a company with this operating profit.
The facts do not include an earlier value for this ratio, so it is impossible to judge whether leverage is rising or falling. The absolute level of net debt alone does not answer that question.
A dividend yield of 2.35% is modest for a company with this revenue momentum
The trailing twelve-month dividend yield is 2.35%. With a market capitalisation of about $522,840 million, that corresponds to payouts of roughly $12,300 million a year.
For a company growing at a double-digit pace, that yield looks modest. It does not compensate for the risk associated with the high valuation. The facts do not specify what was paid last year or what to expect this year, so no dividend forecast can be made.
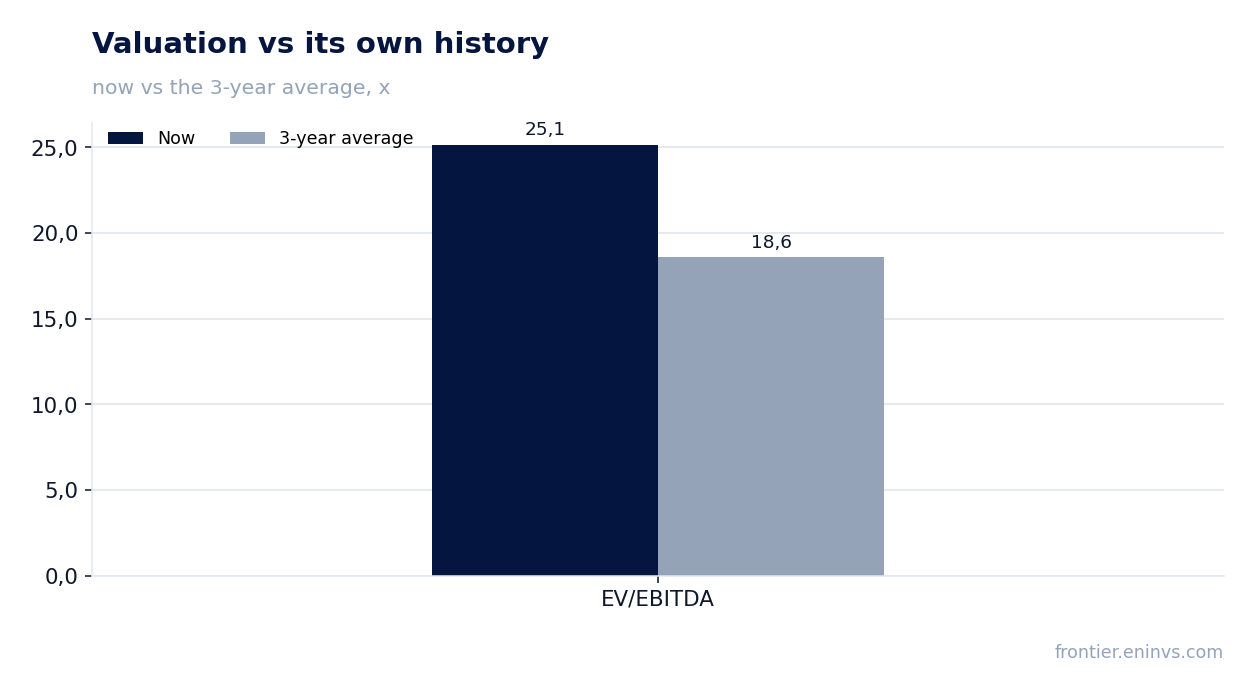
The EV/EBITDA multiple of 25.1 is 35% above its own three-year average of 18.6
The trailing twelve-month EV/EBITDA is 25.1, while its own three-year average is 18.6. The share trades 35% above its historical valuation.
The trailing twelve-month P/E reaches 82.9, reflecting low net profit relative to market capitalisation. Return on equity is negative at -56.0%. Taken together, these figures suggest the market is paying for future growth rather than current earnings.
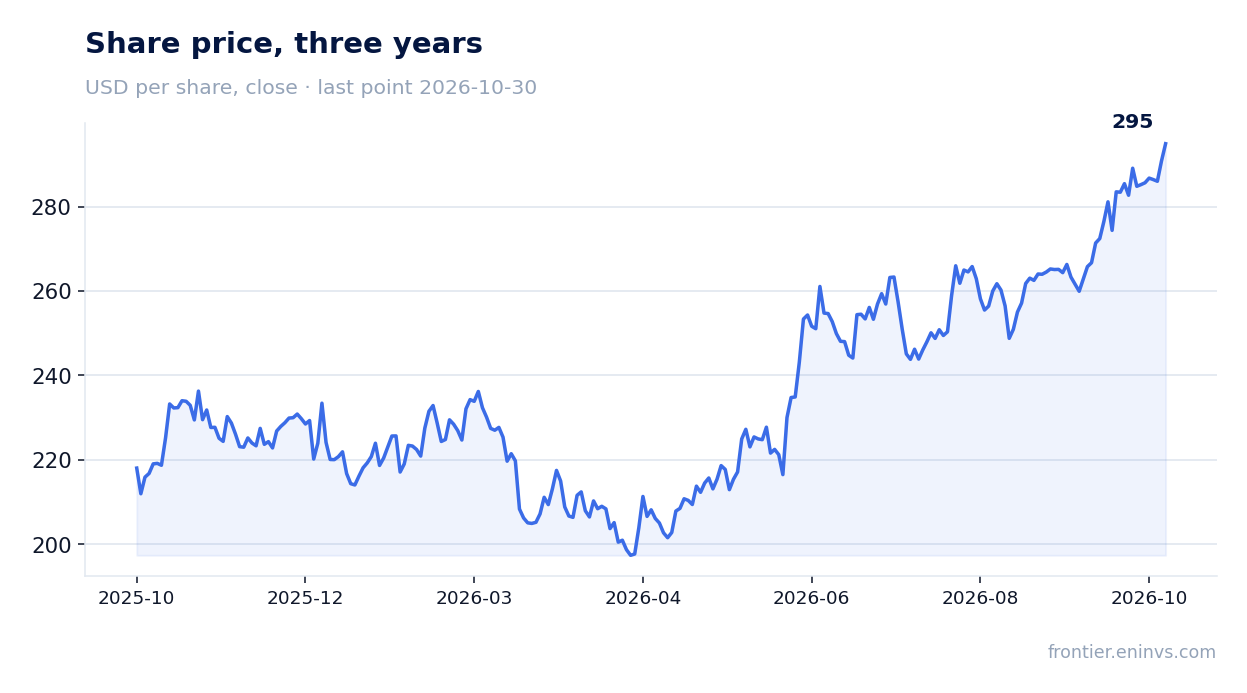
On the portal's model the share trades 2% above fair value
On the portal's model, which compares EBITDA growth with the target multiple and market capitalisation, the upside to fair value is -2%. In other words, the current price is close to the model's estimate.
This is not a consensus forecast or a target price, but the output of our own model. It is consistent with the conclusion that the share is fairly valued or slightly above fair value.
Valuation on the latest reported figures
| Metric | Value |
|---|---|
| Market cap | 523 bn USD |
| P/E (LTM) | 82.9 |
| EV/EBITDA (LTM) | 25.1 |
| Net debt / EBITDA (LTM) | 2.48 |
| ROE | -56.0% |
| Dividend yield (12m) | 2.3% |
| EV/EBITDA, 3-year average | 18.6 |
Bottom line
The strong point of the report is steady double-digit revenue growth: 10.3% in Q3 with the pace roughly unchanged from Q2. The weak point is the valuation: EV/EBITDA at 25.1 is 35% above its own three-year average, and on the portal's model the share trades 2% above fair value. Trailing twelve-month net profit was $6,310 million on revenue of $66,000 million, implying a modest margin. The dividend yield of 2.35% is modest. The question for a holder now is whether the company can sustain its growth rate to justify the current valuation. Verdict – neutral.
Open the company's financial profile ABBV →
See also: market overview · valuation map · stock screeners