Axcelis Technologies: revenue accelerated to +11.3%, but profit leans on a tax benefit and one-offs
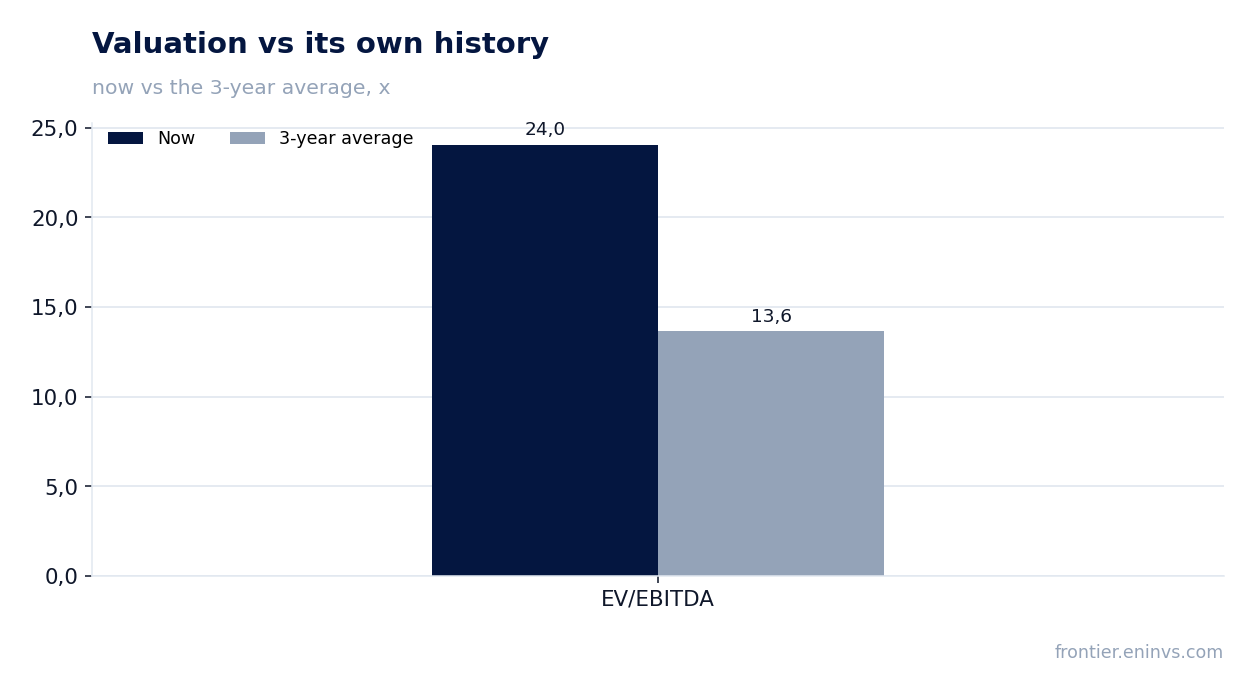
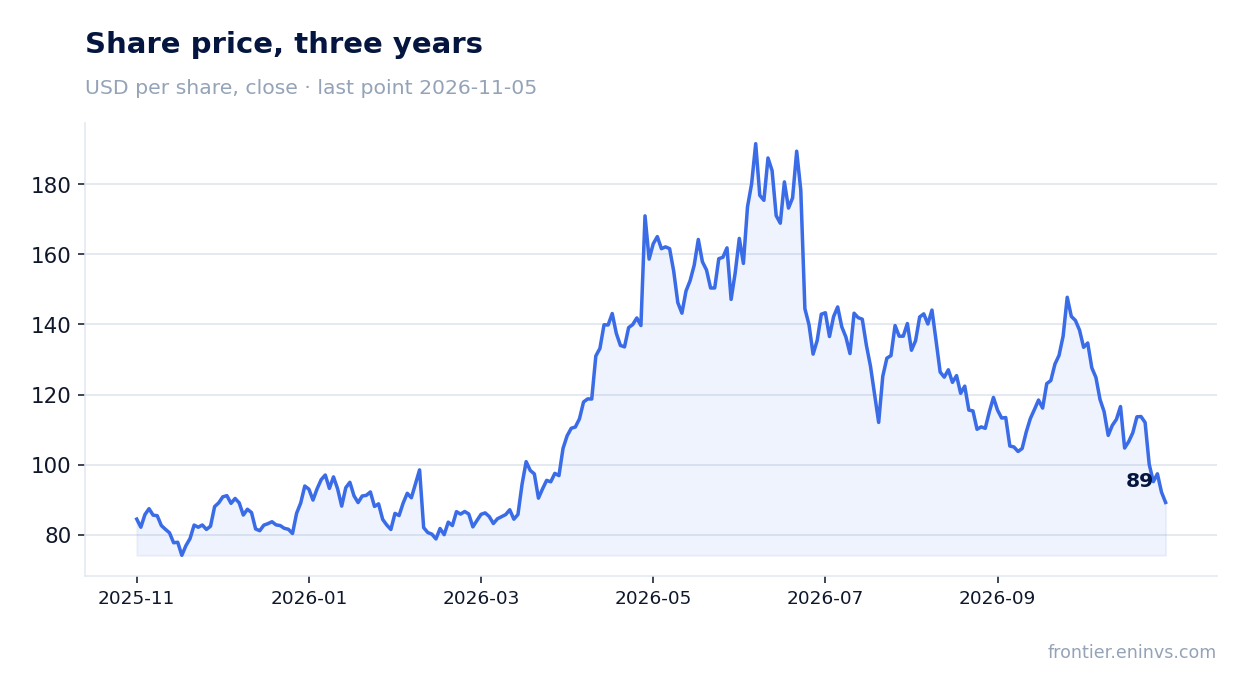
On 5 November Axcelis Technologies reported third-quarter 2026 results: revenue of $237.8 million, up 11.3% year on year versus +10.6% a quarter earlier, EBITDA of $31.8 million (+8.5%) and net income of $37.8 million (+45.3%). Profit outgrew revenue not through operations: the tax line turned positive at $1.8 million and one-off items sit inside the result. The share lost 3.2% after the release, and at the current price it looks rather unattractive: EV/EBITDA of 24.0 against its own three-year average of 13.6, with the portal's model pointing to minus 4% to fair value.
Key takeaways
— Revenue accelerated to +11.3% on systems and record service, not on price
— EBITDA margin slipped to 13.4% on FX losses inside cost of revenue
— Net income +45.3% rests on a tax benefit and one-offs, not on operations
— Operating cash flow of $40.2 million against $2.5 million capex – cash exists, but inventory growth absorbs it
— Net debt is negative, yet cash fell from -$0.8 billion to -$0.1 billion over the quarter
— EV/EBITDA of 24.0 versus its own three-year average of 13.6 – the stock is 76% above its own history
— Fourth-quarter guidance of $275 million sets up growth but does not answer the price question
Attractiveness
Key figures, USD bn
| Metric | Q3 2025 | Q3 2026 | Change |
|---|---|---|---|
| Revenue | 0.21 | 0.24 | +11.3% |
| EBITDA | 0.03 | 0.03 | +8.5% |
| Operating profit | 0.03 | 0.03 | +9.3% |
| Net profit | 0.03 | 0.04 | +45.3% |
| Operating cash flow | 0.05 | 0.04 | -11.3% |
| Capex | 0.00 | 0.00 | +24.3% |
| EBITDA margin | 13.7% | 13.4% | -0.3 pp |
| Net margin | 12.2% | 15.9% | +3.7 pp |
Revenue accelerated to +11.3% on systems and record service, not on price
Third-quarter 2026 revenue came in at $237.8 million, up 11.3% year on year and faster than the 10.6% of the second quarter. The acceleration starts from a low base: in the third quarter of 2025 revenue was falling 16.7%, so the current growth is a recovery rather than a new level.
CEO Russell Low names the drivers directly: sequential growth in systems revenue and another quarterly record in the CS I service business. He also points to a strong increase in bookings and a broadening recovery across Memory, Power and General Mature. That confirms growth comes from volumes and installed-base loading, not from pricing.
For a holder, the growth is still quarterly rather than an annual trend: nine months of 2026 delivered $651.9 million against $600.7 million a year earlier. The gap between the quarterly and nine-month dynamics shows how weak the first quarter of 2026 was, with revenue of $199.0 million.
EBITDA margin slipped to 13.4% on FX losses inside cost of revenue
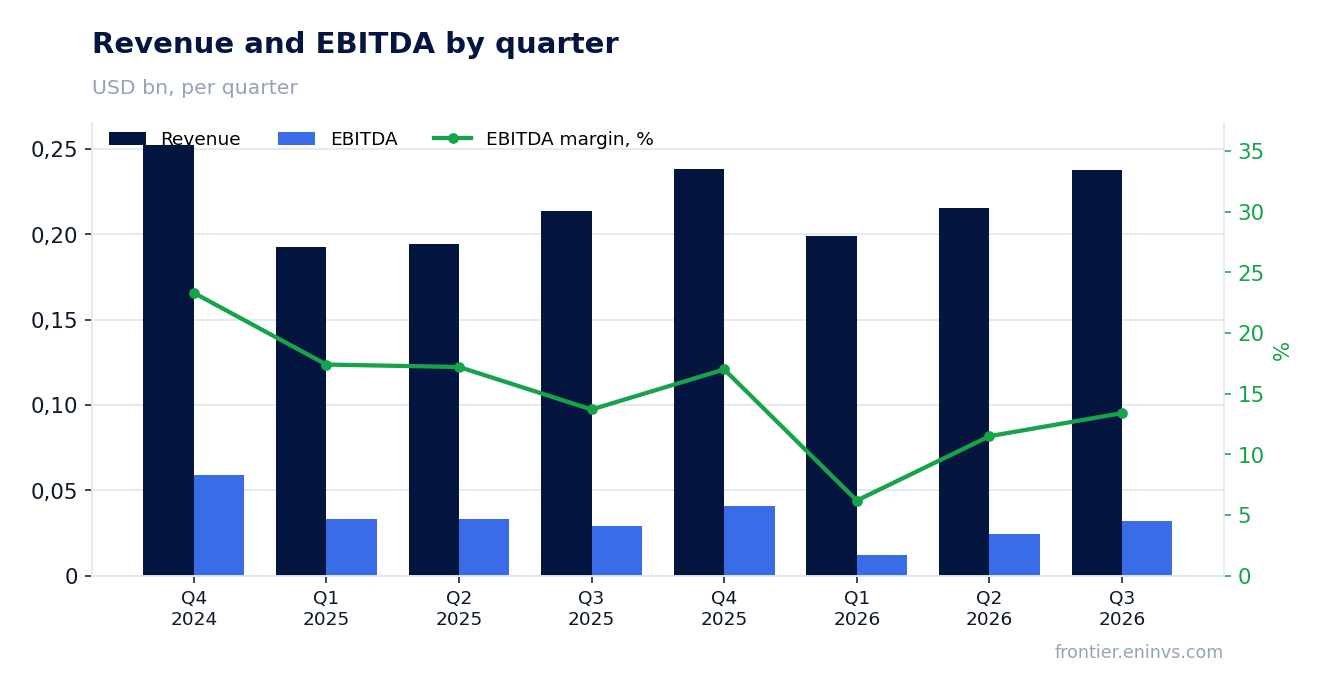
Third-quarter 2026 EBITDA was $31.8 million, up 8.5% year on year, slower than revenue. The EBITDA margin came to 13.4% against 13.7% a year earlier. GAAP gross margin fell to 41.0% from 41.6% even as revenue rose 11.3%.
Interim CFO David Ryzhik names the cause: foreign-exchange headwinds hit gross margin. Cost of revenue rose to $140.4 million from $124.8 million, faster than revenue, so operating leverage did not work. GAAP operating income still rose to $27.3 million from $25.0 million, but the operating margin slipped to 11.5% from 11.7%.
Adjusted EBITDA in the release is $44.0 million at an 18.5% margin, but it strips out $6.5 million of stock-based compensation and $5.0 million of Veeco merger costs. For judging cash generation, the unadjusted $31.8 million matters more, and it grows slower than revenue.
Net income +45.3% rests on a tax benefit and one-offs, not on operations
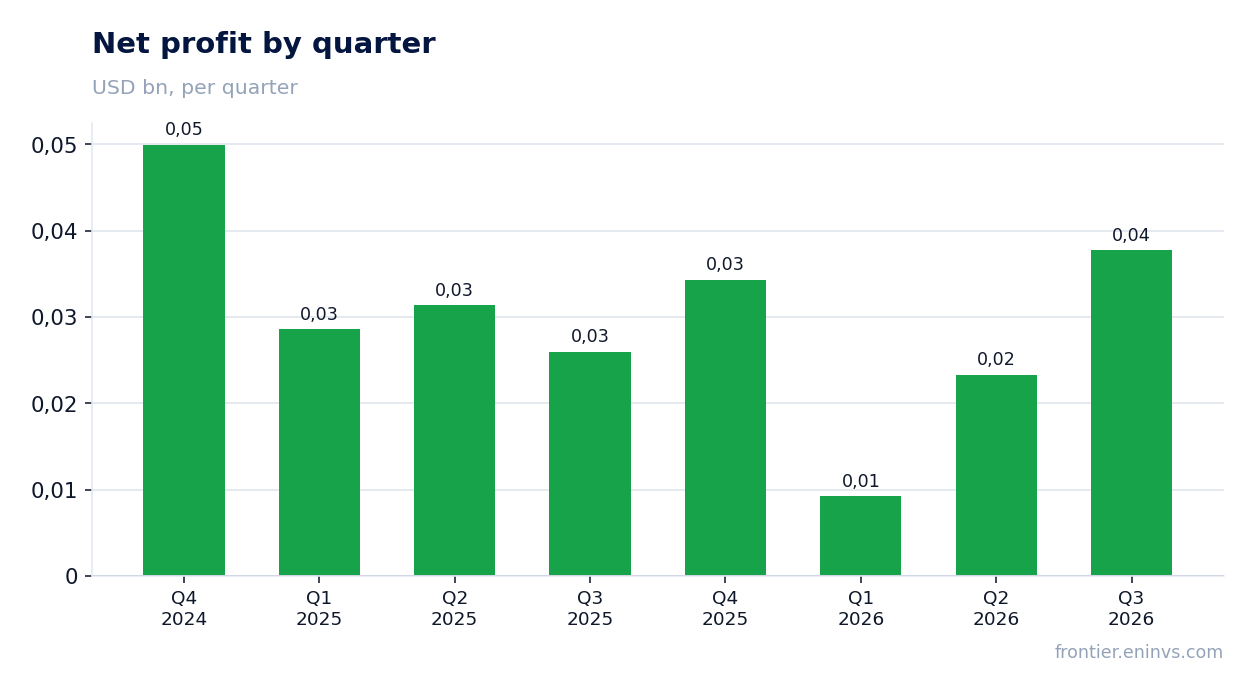
Third-quarter 2026 net income was $37.8 million against $26.0 million a year earlier, up 45.3%. Operating income over the same period rose only to $27.3 million from $25.0 million, roughly 9%. The gap between the two rates is not explained by the business.
The release shows where the difference came from: the tax line turned positive at $1.8 million against a $4.2 million charge a year earlier, and it contains one-off tax-audit items of $9.3 million within adjusted profit. Other income rose to $8.7 million from $5.1 million, helped by interest on cash and a $0.8 million Other item.
Strip those effects out and adjusted net income was $39.2 million against $37.9 million a year earlier, growth of about 3.5%. That is the real earnings rate, and it is more modest than the headline 45.3%. Adjusted earnings per share came to $1.26 against $1.21.
Operating cash flow of $40.2 million against $2.5 million capex – cash exists, but inventory growth absorbs it
Third-quarter 2026 operating cash flow was $40.2 million, below the $45.4 million of a year earlier even as revenue grew. Capital expenditure came to $2.5 million, so free cash flow before dividends and buybacks remains solid. Over nine months of 2026 operating cash flow was $76.7 million against $124.9 million a year earlier.
The gap to profit is working capital: inventories rose to $376.3 million from $329.0 million at the end of 2025, and prepaid and other current assets to $88.9 million from $66.8 million. The company is building stock ahead of a demand recovery, and that ties up cash.
Capex is small – $7.9 million over nine months – so the question is not investment but how quickly inventory turns into revenue. Fourth-quarter guidance of $275 million assumes the stock starts working.
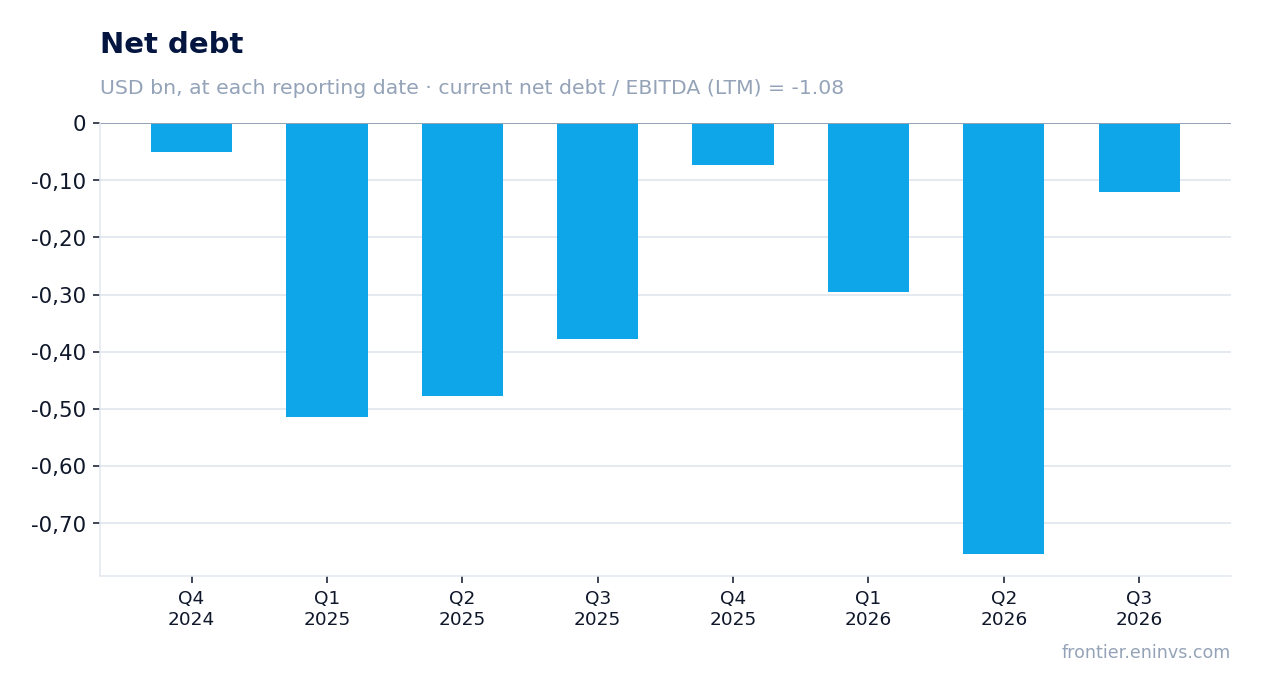
Net debt is negative, yet cash fell from -$0.8 billion to -$0.1 billion over the quarter
Net debt at 30 September 2026 was -$120.9 million, meaning the company holds more cash than it owes. Net debt to EBITDA over the trailing twelve months is -1.08, a negative level. There is no conventional debt burden.
The move within the quarter should be read by balance-sheet dates: from -$0.8 billion on 30 June 2026 to -$0.1 billion on 30 September 2026, a change of +$0.6 billion. Over the year, from -$0.4 billion on 30 September 2025, the change is +$0.3 billion. Cash went into inventory and receivables, not into debt.
Interest income for the quarter was $7.4 million against $5.5 million a year earlier, interest expense $2.0 million against $1.3 million. Even with less cash, interest stays positive and supports profit. Liquidity – $190.8 million of cash and $281.6 million of short-term investments – covers current liabilities of $248.4 million with room to spare.
EV/EBITDA of 24.0 versus its own three-year average of 13.6 – the stock is 76% above its own history
At the current price, trailing-twelve-month EV/EBITDA is 24.0, while its own three-year average is 13.6. The stock trades 76% above its own history. Trailing P/E is 26.3 and market capitalisation is $2.75 billion.
The high multiple rests on profit that over the last twelve months came to $104.6 million on revenue of $890.2 million and EBITDA of $111.5 million. But last quarter's profit was partly one-off, and EBITDA grows slower than revenue, so the multiple's denominator is not catching up with the price.
The portal's model, which weighs EBITDA growth against a target multiple and market cap, points to -4% to fair value. That is not a consensus or a target price but our own estimate. It says the market has already priced in a recovery the company is only beginning to show.
Fourth-quarter guidance of $275 million sets up growth but does not answer the price question
The company guides fourth-quarter 2026 revenue to about $275 million, GAAP earnings per share to about $1.15 and adjusted EPS to about $1.50. That is above the $238.3 million of the fourth quarter of 2025 and above the just-reported $237.8 million.
The guidance rests on the bookings growth Low describes and on record service. If delivered, full-year revenue would exceed $900 million, and loading the inventory that rose to $376.3 million would speed up operating cash flow. That is the main argument that current growth is not a one-off.
The risk is elsewhere: adjusted EPS of $1.50 against GAAP of $1.15 means $0.35 per share comes from stock-based compensation and Veeco merger costs. Those items will not disappear quickly, so the gap between adjusted and real profit will persist into the next report.
Valuation on the latest reported figures
| Metric | Value |
|---|---|
| Market cap | 2.75 bn USD |
| P/E (LTM) | 26.3 |
| EV/EBITDA (LTM) | 24.0 |
| P/B | 2.66 |
| Net debt / EBITDA (LTM) | -1.08 |
| Operating cash flow (LTM) | 0.07 bn |
| ROE | 13.9% |
| EV/EBITDA, 3-year average | 13.6 |
Bottom line
The strong part of the report is revenue: $237.8 million and acceleration to 11.3% on systems and record service, plus guidance of $275 million for the fourth quarter. The weak part is earnings quality: 45.3% growth rests on a tax benefit and one-offs, while adjusted profit rose about 3.5%. EBITDA margin slipped to 13.4%, cash went into inventory, and although net debt is negative, cash fell from -$0.8 billion to -$0.1 billion over the quarter. The real question for a holder is price: EV/EBITDA of 24.0 against its own three-year average of 13.6, with the portal's model pointing to minus 4% to fair value. The verdict is rather unattractive: growth exists, but the multiple has already paid for it.
Open the company's financial profile ACLS →
See also: market overview · valuation map · stock screeners