AEHR TEST SYSTEMS: revenue tripled, but the cash has not followed yet

On 25 September AEHR TEST SYSTEMS reported results for the third quarter of 2026: revenue of 33.0 million dollars, operating profit of 6.047 million, net profit of 7.181 million, with operating cash flow of minus 3.054 million. Revenue grew 200.8% year on year, and the net margin rose from minus 19.0% to 21.8%. The stock is nonetheless expensive against its own history, and the portal's model puts it 6% below fair value, so the share looks neutral: a strong report is already in the price, and cash flow is not keeping up with profit.
Key takeaways
— Revenue tripled to 33.0 million dollars, and almost all of it landed in a single quarter
— Operating profit of 6.047 million appeared after losses in every earlier quarter of the series
— Net profit of 7.181 million came in above operating profit, and the gap did not come from the core business
— There is profit but no cash: operating flow for the quarter was minus 3.054 million
— Net debt remains negative, meaning there is more cash on the balance sheet than debt
— The stock is expensive against its own history: EV/EBITDA averaged 50.2 over three years
— The portal's model puts the share 6% below fair value, and the market has already sold it off
Attractiveness
Key figures, USD bn
| Metric | Q3 2025 | Q3 2026 | Change |
|---|---|---|---|
| Revenue | 0.01 | 0.03 | +200.8% |
| EBITDA | -0.00 | — | — |
| Operating profit | -0.00 | 0.01 | to profit |
| Net profit | -0.00 | 0.01 | to profit |
| Operating cash flow | -0.00 | -0.00 | — |
| Capex | 0.00 | — | — |
| EBITDA margin | -26.7% | — | — |
| Net margin | -19.0% | 21.8% | +40.8 pp |
Revenue tripled to 33.0 million dollars, and almost all of it landed in a single quarter
Revenue for the third quarter of 2026 was 33.0 million dollars against 10.969 million a year earlier, a rise of 200.8%. This is not a gradual improvement but a jump: in the previous quarter of the series revenue was 18.835 million, and the entire increase fell into the reported period.
That profile is typical for an equipment supplier: revenue depends on the shipping schedule and on recognition under specific contracts rather than on even demand. A quarter with a large delivery therefore looks like a spike, and the next one may return to a normal level.
For an investor this means the annual growth rate of a single quarter says nothing about the trend. The reported period can only be compared with the same quarter a year earlier, which gives 200.8%; there is no basis for carrying that speed into future periods.
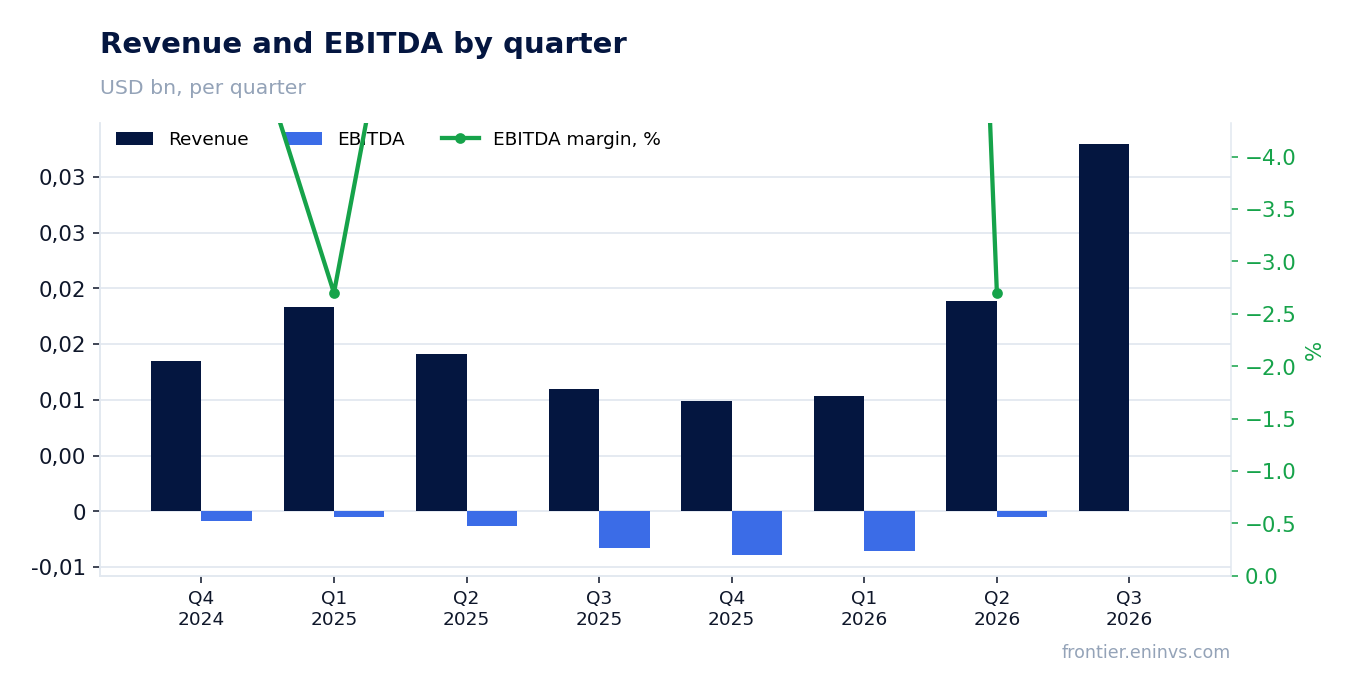
Operating profit of 6.047 million appeared after losses in every earlier quarter of the series
Operating profit for the reported quarter was 6.047 million dollars. In earlier quarters of the series the result was negative: minus 4.229 million in the first quarter of 2026, minus 1.206 million in the second, minus 4.648 million in the fourth quarter of 2025.
The reversal is explained by volume: at revenue of 33.0 million the fixed costs that produced a loss at revenue near 10 million are covered. This is operating leverage in its purest form – not a cut in expenses but the loading of an existing base.
The flip side is that leverage works both ways. If the next quarter returns to revenue of around 10–18 million, operating profit will come under pressure again, because the cost base will not shrink along with shipments.
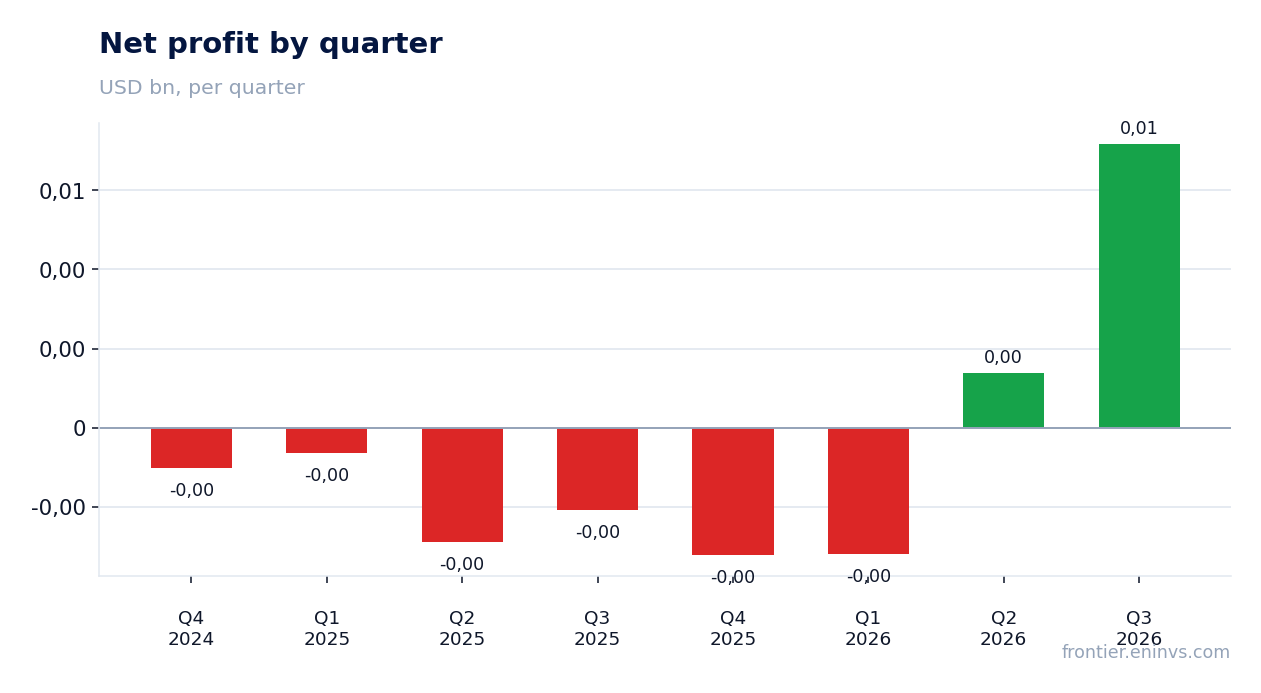
Net profit of 7.181 million came in above operating profit, and the gap did not come from the core business
Net profit for the quarter was 7.181 million dollars against operating profit of 6.047 million. The excess of 1.134 million means that below the operating line the company received more than it paid out in interest and taxes.
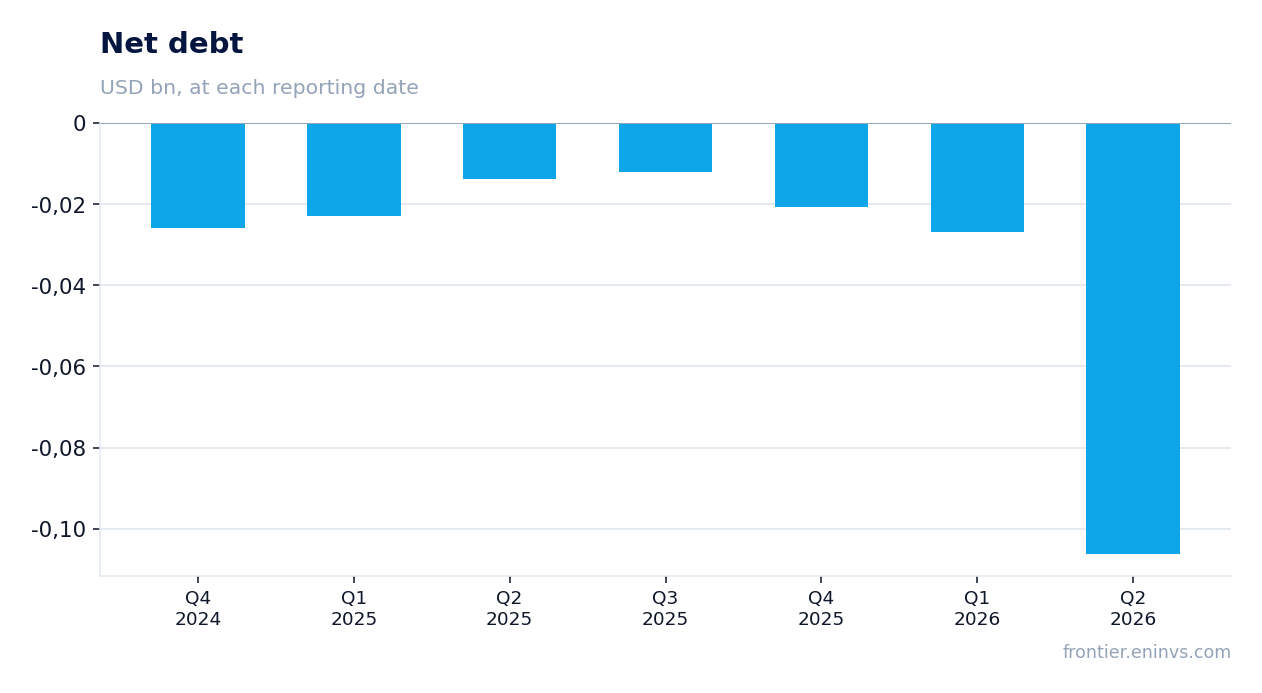
The company has negative net debt: on the latest annual balance sheet it stood at minus 27.029 million, meaning cash exceeds liabilities. Interest on such a balance works in the company's favour rather than against it, which explains part of the gap.
For judging the durability of profit, the operating level matters: 6.047 million is what the core business earned. Net profit is above it, and in a repeat quarter with lower revenue it will compress faster than operating profit.
There is profit but no cash: operating flow for the quarter was minus 3.054 million
Operating cash flow for the reported quarter was minus 3.054 million dollars against net profit of 7.181 million. A gap of more than 10 million means the profit settled in working capital rather than arriving in the account.
For an equipment supplier this is a normal picture: a shipment is recognised in revenue before the buyer pays, and receivables and possibly inventory for future deliveries grow in between. The report gives no breakdown, so only the fact itself can be stated: cash left the working capital during the quarter.
The practical conclusion is that a strong profit report is not backed by an inflow of funds. Until the flow turns, the company is financing growth from accumulated cash rather than from current operations.
Net debt remains negative, meaning there is more cash on the balance sheet than debt
On the latest annual balance sheet net debt was minus 27.029 million dollars: the company holds more cash than it owes. That is a cushion allowing it to survive a quarter of negative operating flow without raising financing.
This cushion also explains part of net profit: interest on a positive balance works in the company's favour. But the cushion is not unlimited, and if the outflow of 3 million a quarter repeats it will shrink.
It is worth remembering separately that negative net debt is neither profit nor a permanent safety margin. It is a cash balance spent on working capital and capital expenditure, and its movement matters more than the level itself.
The stock is expensive against its own history: EV/EBITDA averaged 50.2 over three years
The three-year average EV/EBITDA is 50.2. That is a high bar in itself, and it shows the market has long valued the company not on current profit but on expectations of future growth.
Market capitalisation is 1,577.0 million dollars, while ROE is 13.0%. The combination of a high valuation and a moderate return on equity means the price already discounts a strong scenario.
The portal's model, which sets EBITDA growth against a target multiple, puts the share 6% below fair value. That is not a market consensus but our own estimate, and it says the upside at the current price is exhausted.
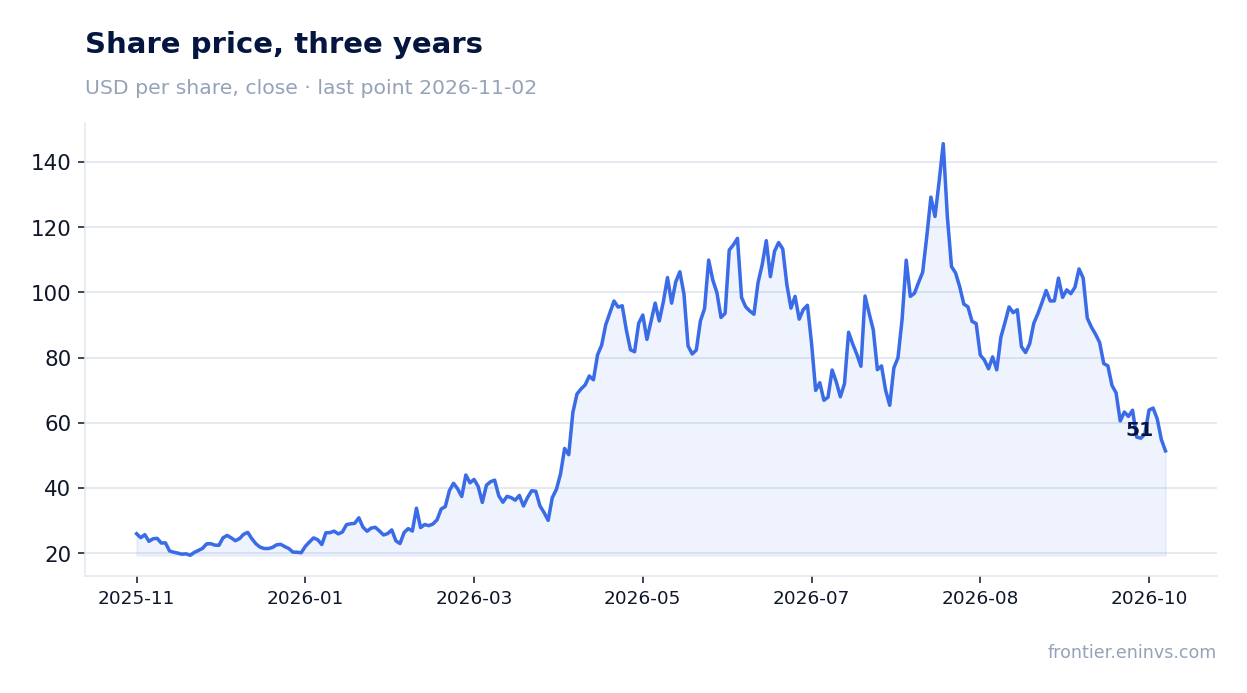
The portal's model puts the share 6% below fair value, and the market has already sold it off
The share closed at 54.89 dollars before the report and lost 6.3% on the day of release. Since then, by 2 November 2026, the decline has held at the same level – 6.3%.
The reaction shows the market expected more: with revenue growth of 200.8% and a net margin of 21.8%, the stock still fell. The reason is that profit is not backed by cash flow, and the valuation was already high.
Valuation on the latest reported figures
| Metric | Value |
|---|---|
| Market cap | 1.58 bn USD |
| P/B | 7.18 |
| ROE | 13.0% |
Bottom line
The strong side of the report is that revenue grew 200.8% to 33.0 million and operating profit reached 6.047 million after losses in earlier quarters. The weak side is that profit did not turn into cash: operating flow was minus 3.054 million, and net profit of 7.181 million partly rests on interest from the cash cushion. The real question for a holder now is not the pace of growth but whether cash flow turns positive and whether loading holds at the level of the reported quarter. With a valuation above its own three-year history and minus 6% on the portal's model, the share looks neutral.
Open the company's financial profile AEHR →
See also: market overview · valuation map · stock screeners