ADVANCED MICRO DEVICES INC: revenue up 44.7%, but a one-off warrant charge ate the profit growth
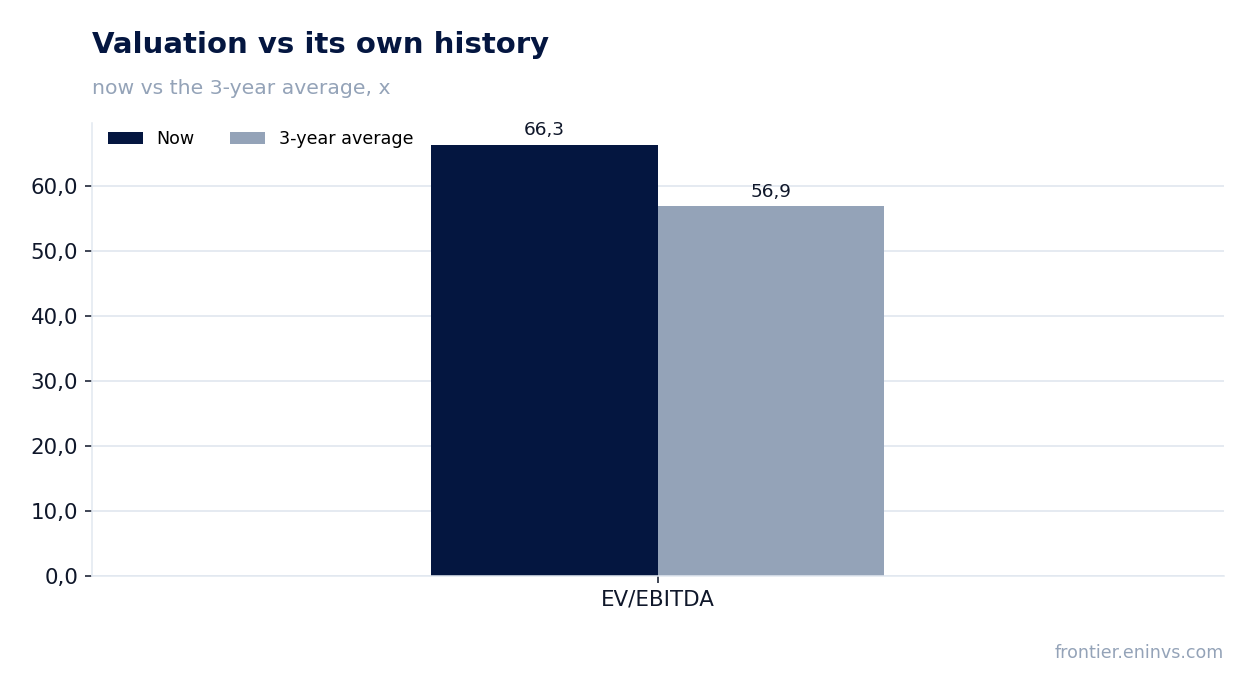
On November 3, ADVANCED MICRO DEVICES INC reported third-quarter 2026 results. Revenue reached $13,377 million (+44.7% year over year), adjusted EBITDA was $4,162 million (31.1% margin), and net income was $2,428 million (+95.3%). The report is strong on revenue and margin, but at 66.3x EV/EBITDA the stock trades above its own three-year average, so at the current price it looks rather attractive only on the portal's model, not on the multiple.
Key takeaways
— Revenue of $13,377 million was carried by the data center segment, which nearly doubled
— EBITDA margin rose to 31.1% on scale, not on a one-off cut in costs
— Net income rose 95.3%, but $1,097 million of it was eaten by warrant remeasurement
— Free cash flow fell to $554 million on inventory and receivables build
— Debt rose to $7,079 million, but net debt remains negative
— EV/EBITDA of 66.3x is 17% above its own three-year average
— The portal's model implies 18% upside to fair value
Attractiveness
Key figures, USD bn
| Metric | Q3 2025 | Q3 2026 | Change |
|---|---|---|---|
| Revenue | 9.25 | 13.4 | +44.7% |
| EBITDA | 1.83 | 4.16 | +127.2% |
| Operating profit | 1.27 | 2.83 | +123.0% |
| Net profit | 1.24 | 2.43 | +95.3% |
| Operating cash flow | 2.16 | 1.20 | -44.3% |
| Capex | 0.26 | — | — |
| EBITDA margin | 19.8% | 31.1% | +11.3 pp |
| Net margin | 13.4% | 18.2% | +4.8 pp |
Revenue of $13,377 million was carried by the data center segment, which nearly doubled
Third-quarter 2026 revenue was $13,377 million, up 44.7% year over year. Growth decelerated from 50.1% in the second quarter but remains very high.
The main driver was the data center segment: revenue reached $8,546 million, nearly doubling year over year. The company attributes this to demand for EPYC processors and the launch of Instinct MI450 GPUs.
The client and gaming segment brought in $3,722 million, down 8% year over year. Client revenue rose 7% to $2,949 million, while gaming fell 40% to $773 million on lower semi-custom and graphics sales.
The embedded segment grew 29% to $1,109 million. Almost all of the revenue increase therefore came from data centers, while gaming remains the weak spot.
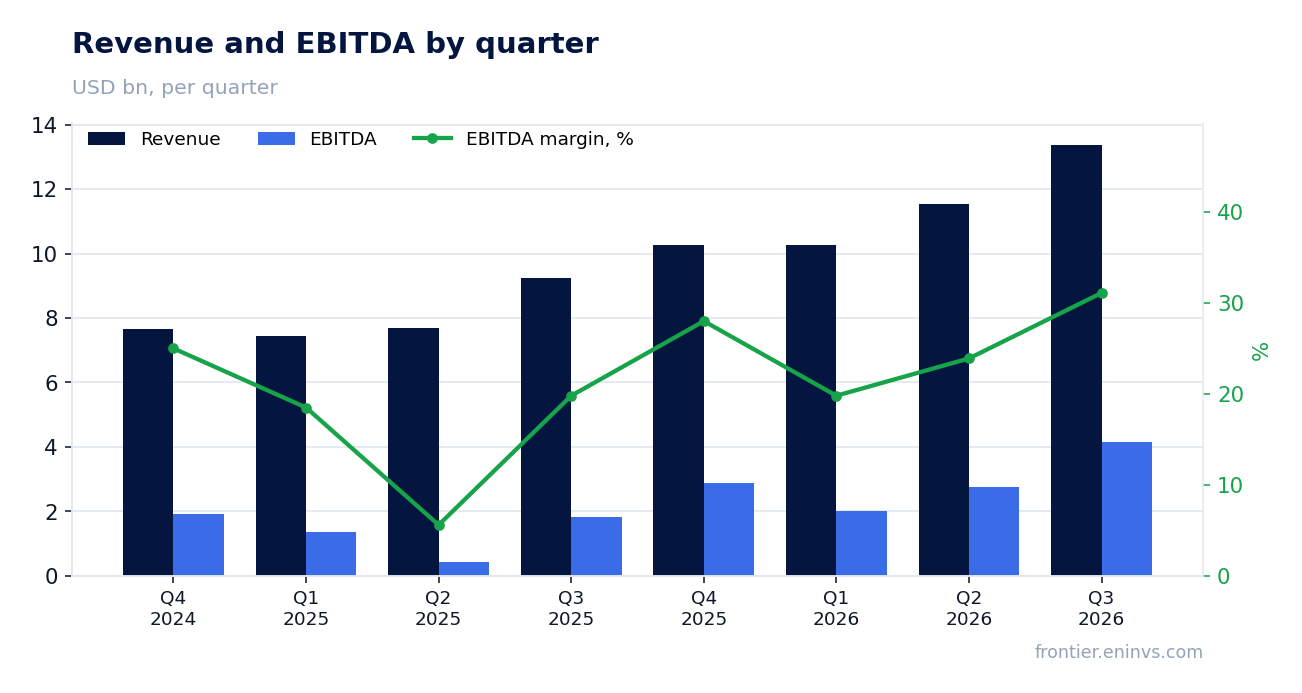
EBITDA margin rose to 31.1% on scale, not on a one-off cut in costs
Adjusted EBITDA was $4,162 million, with a margin of 31.1% versus 19.8% a year earlier. Such margin expansion on 44.7% revenue growth points to strong operating leverage.
GAAP gross margin rose to 54% from 52%, and non-GAAP to 56% from 54%. Operating expenses grew 25%, slower than revenue, which drove the margin expansion.
GAAP operating income was $2,832 million versus $1,270 million a year earlier. Operating margin rising to 21% from 14% confirms the improvement is not due to one-off items.
Within costs, research and development rose to $2,803 million from $2,139 million. The company continues to invest in new products, which limits further margin expansion.
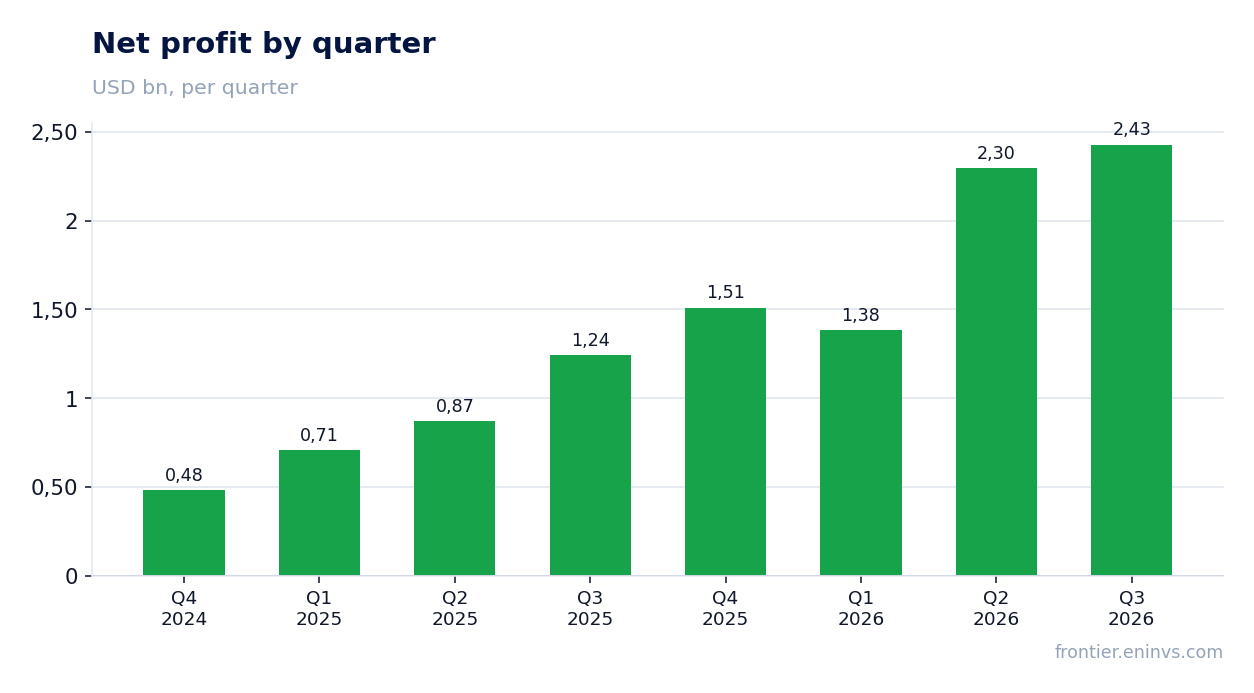
Net income rose 95.3%, but $1,097 million of it was eaten by warrant remeasurement
GAAP net income was $2,428 million versus $1,243 million a year earlier, up 95.3%. However, the report contains a large one-off item – a $1,097 million change in the fair value of warrants, which reduced profit.
Excluding this item, non-GAAP net income would have been $3,471 million, and diluted EPS $2.09 versus $1.20 a year earlier. Non-GAAP EPS growth of 74% reflects the underlying business.
There is also a tax benefit: instead of an expense, income tax provided a $555 million benefit. This is another one-off factor that inflated net income.
Thus, the reported 95.3% net income growth looks impressive, but a significant part of it is due to non-operating items – warrant remeasurement and the tax line.
Free cash flow fell to $554 million on inventory and receivables build
Operating cash flow for the quarter was $1,202 million versus $2,159 million a year earlier. Free cash flow was $554 million versus $1,530 million a year earlier.
The reason is a significant working capital outflow: inventories rose by $2,995 million and receivables by $1,928 million. The company is building inventory ahead of expected shipment acceleration in the fourth quarter.
Capital expenditures rose to $648 million from $258 million a year earlier. The capex increase is tied to production expansion, including for new Helios and Venice products.
Free cash flow remains positive, but its fall to $554 million against net income of $2,428 million shows that profit is not yet fully converting into cash.
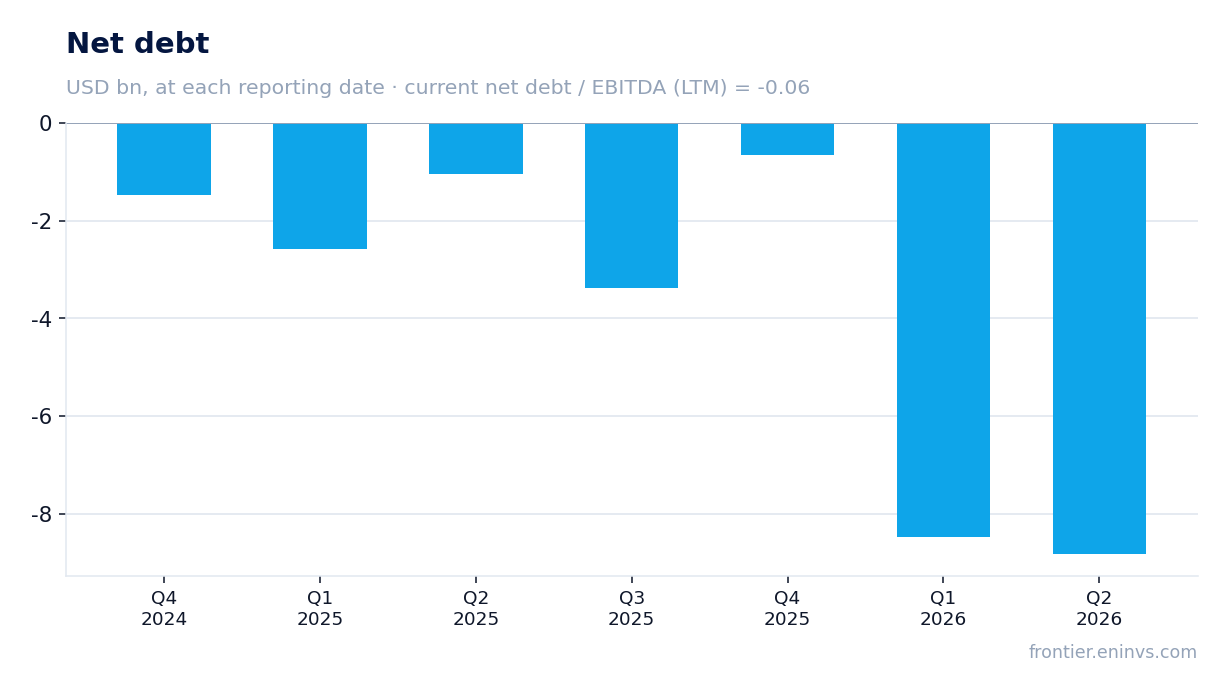
Debt rose to $7,079 million, but net debt remains negative
Total debt at quarter-end was $7,079 million versus $3,226 million a quarter earlier. The increase is due to $4,726 million in debt issuance.
At the same time, cash and short-term investments were $15,776 million, so net debt remains negative. Net debt to LTM EBITDA is minus 0.06.
Interest expense rose to $62 million from $37 million a year earlier but remains insignificant relative to EBITDA. Leverage is not a risk for the company.
The company also repurchased $221 million of shares over nine months, supporting earnings per share.
EV/EBITDA of 66.3x is 17% above its own three-year average
On LTM EV/EBITDA the company trades at 66.3x, 17% above its own three-year average of 56.9x. The stock is more expensive than usual on this multiple.
P/E LTM is 104.1x, reflecting low net income due to one-off items. On non-GAAP earnings the multiple would be significantly lower.
Revenue growth decelerated from 50.1% in the second quarter to 44.7% in the third but remains high. The company expects growth to accelerate in the fourth quarter to about 66% year over year.
The valuation looks high, but if the forecast for accelerating growth materialises, the current multiple may prove justified.
The portal's model implies 18% upside to fair value
According to the portal's model, which compares EBITDA growth with a target multiple and market capitalisation, the upside to fair value is 18%.
This is the portal's own estimate, not a market consensus or a target price. It is based on expectations of further EBITDA growth and the current multiple being maintained.
The share is held in the portal's live model strategies: US GARP + acceleration and US Tech / AI leaders. This is a fact, not an argument for the verdict.
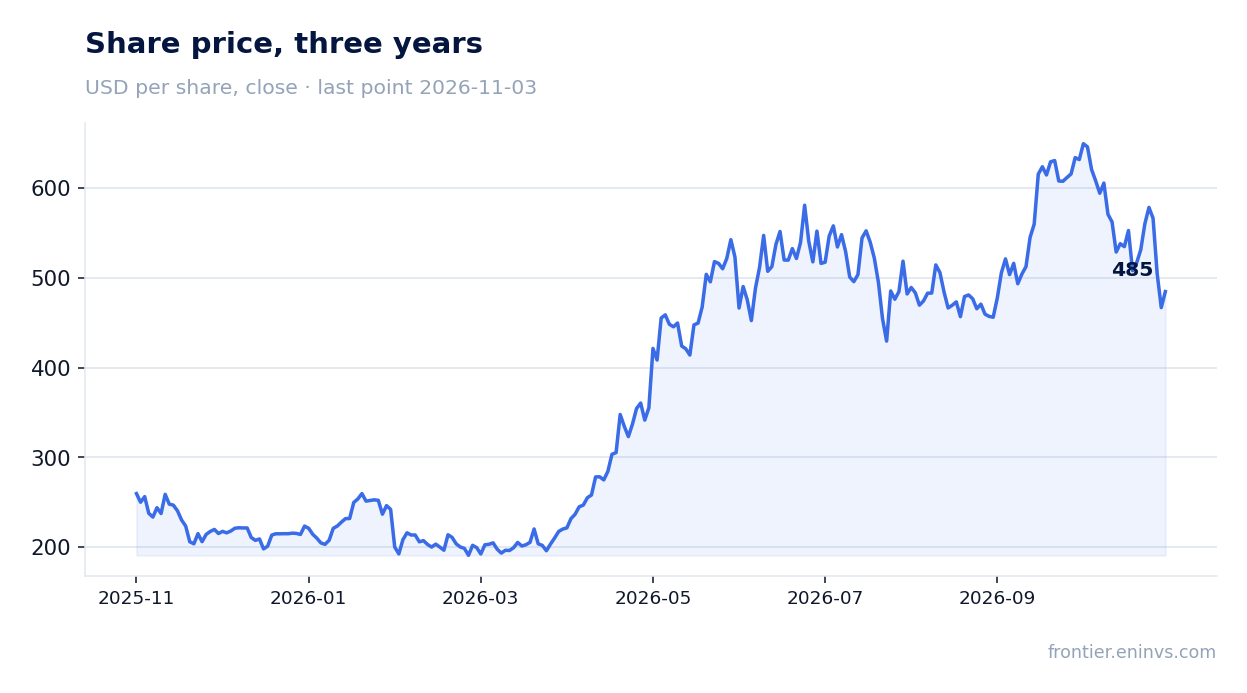
Since the report was published, the share has risen 3.8%, and from the start of the year to November 3 it is also up 3.8%.
Valuation on the latest reported figures
| Metric | Value |
|---|---|
| Market cap | 793 bn USD |
| P/E (LTM) | 104.1 |
| EV/EBITDA (LTM) | 66.3 |
| P/B | 12.59 |
| Net debt / EBITDA (LTM) | -0.06 |
| Operating cash flow (LTM) | 9.12 bn |
| ROE | 14.3% |
| EV/EBITDA, 3-year average | 56.9 |
Bottom line
The third-quarter 2026 report is strong on revenue and margin: revenue rose 44.7% to $13,377 million, EBITDA rose 127.2% to $4,162 million. However, a significant part of net income growth is due to one-off items – warrant remeasurement and a tax benefit. Free cash flow fell to $554 million on inventory and receivables build. EV/EBITDA of 66.3x is above its own three-year average, but the portal's model implies 18% upside. The verdict is rather attractive: strong operating growth and low leverage outweigh the high valuation, but confirmation requires a fourth quarter with accelerating revenue and recovering cash flow.
Open the company's financial profile AMD →
See also: market overview · valuation map · stock screeners