AMAZON COM INC: revenue growth slowed to 12.1% and profit fell below last year's for the first time in a year
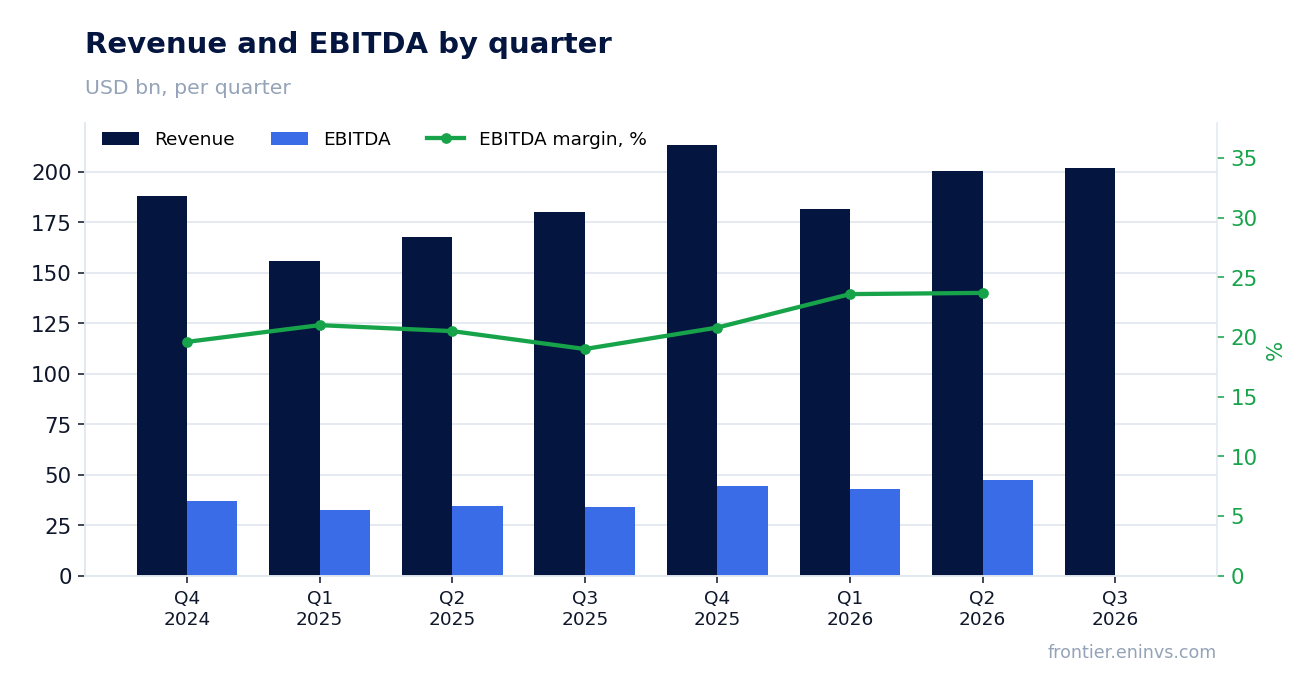
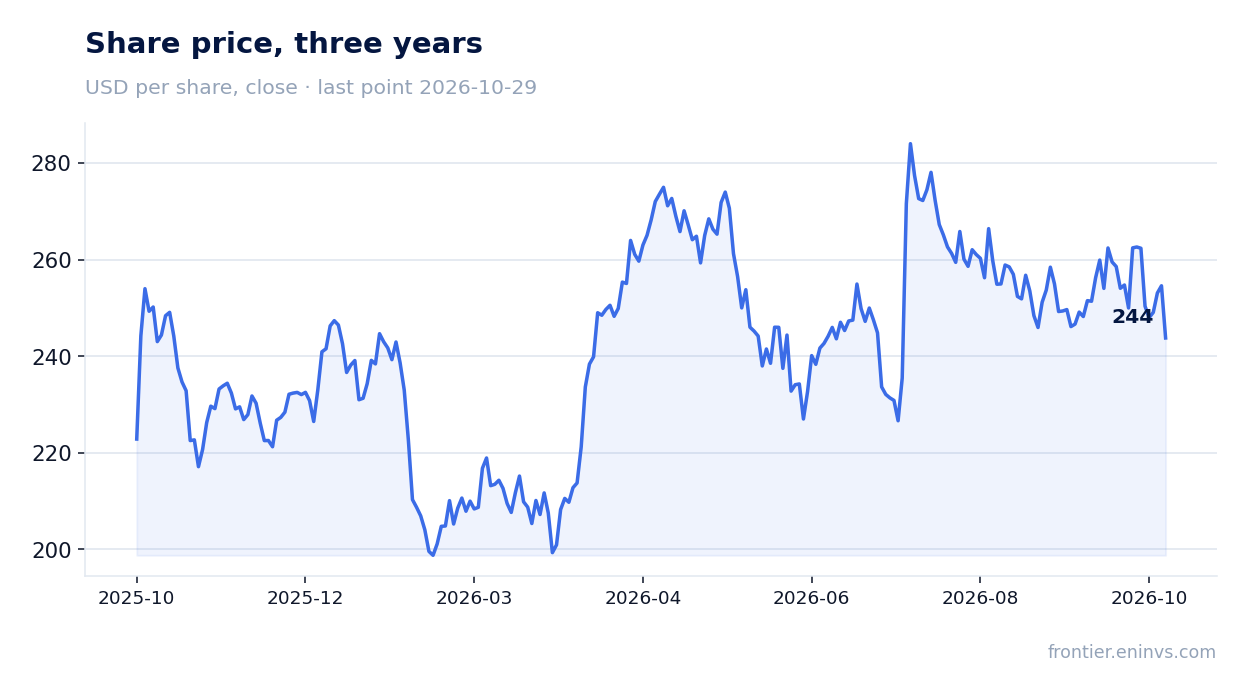
On 29 October AMAZON COM INC reported results for the third quarter of 2026. Revenue came in at $201.9 bn, up 12.1% year on year, operating profit at $28.1 bn, and net profit at $20.7 bn, down 2.4% from a year earlier. Revenue growth decelerated from 19.6% in the second quarter, and the net margin fell from 11.8% to 10.2%. At an EV/EBITDA of 15.9 against its own three-year average of 19.2 the share looks cheaper than its history, and the portal's model puts upside to fair value at +24%, so at the current price the stock is rather attractive.
Key takeaways
— Revenue grew 12.1% year on year, slower than the 19.6% a quarter earlier
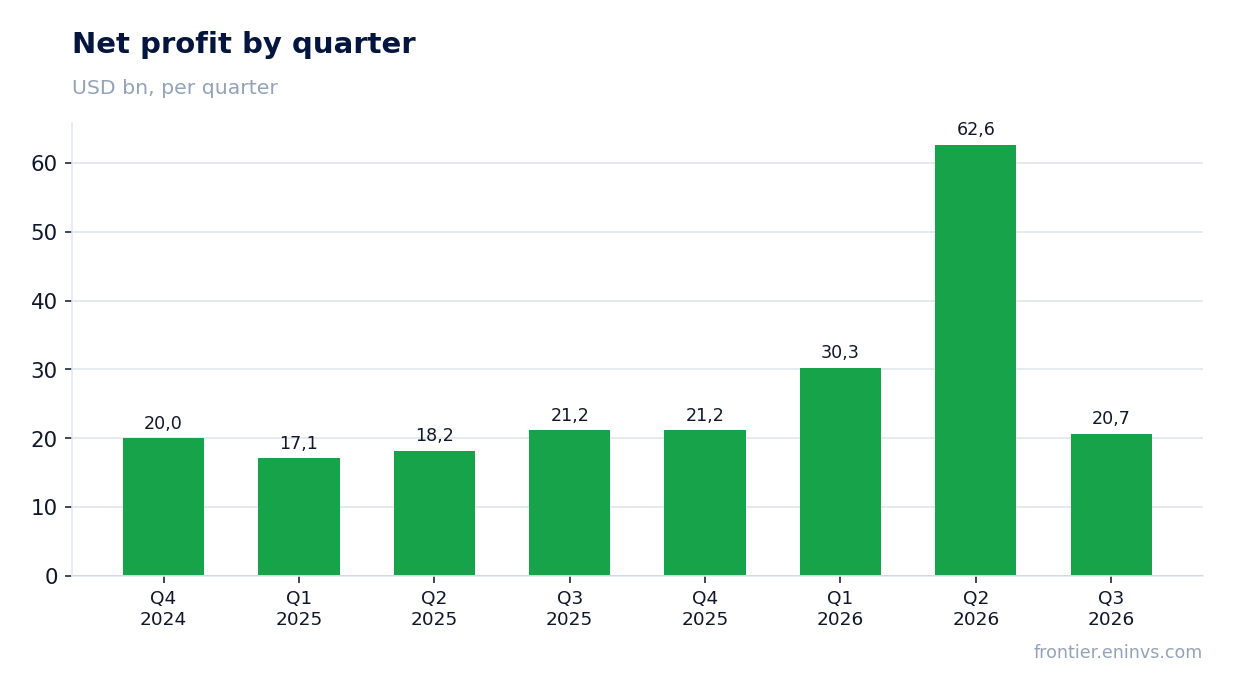
— Net profit fell 2.4% and the margin dropped from 11.8% to 10.2%
— Operating profit rose to $28.1 bn on revenue of $201.9 bn
— Operating cash flow of $42.4 bn covers capex from prior quarters
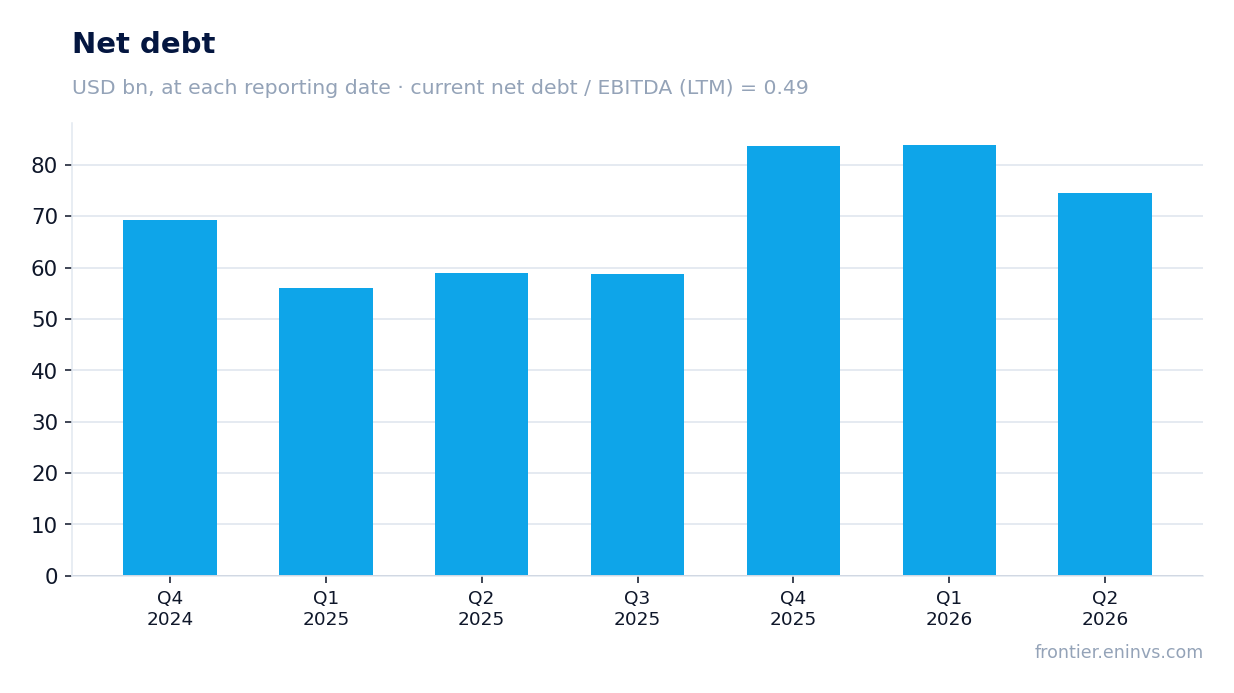
— Leverage at 0.49x LTM EBITDA remains moderate
— EV/EBITDA of 15.9 is 17% below its own three-year average of 19.2
— The portal's model puts upside to fair value at +24%
Attractiveness
Key figures, USD bn
| Metric | Q3 2025 | Q3 2026 | Change |
|---|---|---|---|
| Revenue | 180 | 202 | +12.1% |
| EBITDA | 34.2 | — | — |
| Operating profit | 17.4 | 28.1 | +61.2% |
| Net profit | 21.2 | 20.7 | -2.4% |
| Operating cash flow | 35.5 | 42.4 | +19.4% |
| Capex | 35.1 | — | — |
| EBITDA margin | 19.0% | — | — |
| Net margin | 11.8% | 10.2% | -1.6 pp |
Revenue grew 12.1% year on year, slower than the 19.6% a quarter earlier
In the third quarter of 2026 AMAZON COM INC revenue came to $201.9 bn, 12.1% more than a year earlier. A quarter earlier growth was 19.6%, so the dynamics slowed noticeably. The deceleration followed a strong second quarter, when revenue reached $200.6 bn.
Over the trailing twelve months revenue amounted to $797.5 bn. This is the base for valuation multiples and leverage. The slowdown in the reported quarter matters because the company is working from a high base, and each percentage point of growth is now harder to achieve.
Net profit fell 2.4% and the margin dropped from 11.8% to 10.2%
Net profit for the third quarter of 2026 was $20.7 bn, 2.4% less than a year earlier. The net margin fell to 10.2% from 11.8% in the third quarter of 2025. Lower profit on higher revenue means costs grew faster than income.
Operating profit, however, rose to $28.1 bn, so the pressure on the bottom line arose below the operating line. The facts do not disclose the reasons for this move, and it is not worth guessing. For a holder what matters is the fact itself: profit fell below last year's for the first time in a year.
Operating profit rose to $28.1 bn on revenue of $201.9 bn
Operating profit in the third quarter of 2026 was $28.1 bn against $17.4 bn a year earlier. That is growth of more than one and a half times, achieved on revenue growth of 12.1%. The operating margin therefore widened.
Rising operating profit on slowing revenue suggests the company is controlling operating costs better. The operating result remains the main source of profit, and its dynamics matter more than fluctuations in the net line.
Operating cash flow of $42.4 bn covers capex from prior quarters
Operating cash flow in the third quarter of 2026 was $42.4 bn, above the $35.5 bn of a year earlier. Over the trailing twelve months the flow reached $168.3 bn. This is a solid base for financing investment.
Capex for the third quarter is not disclosed in the facts, but in the previous quarter it was $54.2 bn and in the first quarter $44.2 bn. The company invests heavily, and operating flow still covers these outlays. The ratio of cash flow to capex remains key for free cash flow.
Leverage at 0.49x LTM EBITDA remains moderate
Net debt at the latest annual balance sheet was $83.6 bn, and the ratio of net debt to trailing-twelve-month EBITDA was 0.49. That is a low level for a company of this scale. The figure is given as a level, not as a trend.
EBITDA over the trailing twelve months was $169.5 bn. On such a base debt is serviced easily, and leverage is not a constraint on investment or buybacks. For a holder this means financial risk remains low.
EV/EBITDA of 15.9 is 17% below its own three-year average of 19.2
The trailing-twelve-month EV/EBITDA multiple is 15.9, while its own three-year average is 19.2. The share trades 17% below its historical valuation on this multiple. This suggests the market is pricing in more modest expectations than the three-year average.
The trailing-twelve-month P/E is 19.4, and return on equity is 14.2%. The combination of a moderate P/E and low leverage makes the valuation reasonable. The comparison with history on EV/EBITDA is the only valid one in the facts, and it favours the share.
The portal's model puts upside to fair value at +24%
On the portal's model, which compares EBITDA growth with the target multiple and market capitalisation, the upside of the share to fair value is +24%. This is our own estimate, not a market consensus. It rests on current profit dynamics and valuation.
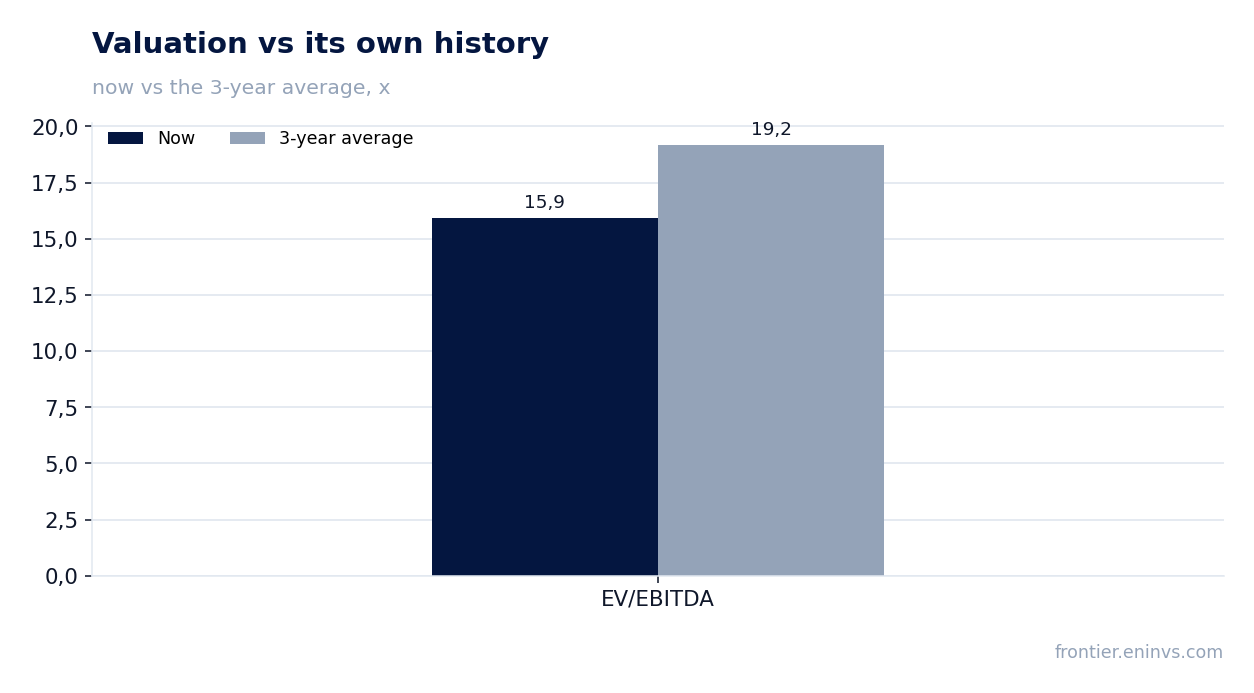
Since the report was published the share has lost 4.2%, and the same amount from the release to 29 October. The market reacted to slower revenue and lower profit. Yet the EV/EBITDA valuation remains below its historical level, which is what creates the model upside.
Valuation on the latest reported figures
| Metric | Value |
|---|---|
| Market cap | 2 616 bn USD |
| P/E (LTM) | 19.4 |
| EV/EBITDA (LTM) | 15.9 |
| P/B | 6.36 |
| Net debt / EBITDA (LTM) | 0.49 |
| Operating cash flow (LTM) | 168 bn |
| ROE | 14.2% |
| EV/EBITDA, 3-year average | 19.2 |
Bottom line
The strong side of the report remains operating profit, which rose to $28.1 bn, and cash flow of $42.4 bn that covers investment. The weak spot is the slowdown in revenue to 12.1% and the 2.4% decline in net profit, which pulled the margin down to 10.2%. Leverage at 0.49x LTM EBITDA poses no risk. The EV/EBITDA valuation is 17% below its own history, and the portal's model shows +24% upside. At the current price the share is rather attractive, but confirmation requires seeing revenue growth and the net margin recover in the next quarter.
Open the company's financial profile AMZN →
See also: market overview · valuation map · stock screeners