Arista Networks, Inc.: revenue up 58.5%, the fastest since the IPO, but the valuation leaves no room for error

On 3 November Arista Networks, Inc. reported results for the third quarter of 2026. Revenue came in at $3,657.6 million, operating profit at $1,642.4 million, and net profit at $1,560.4 million. Year over year revenue grew 58.5% and net profit 82.9%, while the net margin rose to 42.7% from 37.0% a year earlier. The share looks attractive on the portal's model, which implies +21% upside to fair value, but the EV/EBITDA multiple of 40.4 is in line with its own three-year history, so the verdict is 'rather attractive' rather than 'attractive'.
Key takeaways
— Revenue grew 58.5% year over year in the third quarter – an acceleration from 37.7% in the second quarter and the fastest pace since the IPO
— The operating margin rose to 44.9% from 42.4% because revenue grew faster than research and development spending
— Net profit rose 82.9% not only on operations: $134.5 million came from gains on strategic investments
— The company sits on a net cash cushion of $1,904.3 million, with net debt to EBITDA at minus 0.36
— The EV/EBITDA multiple of 40.4 is in line with its own three-year average of 39.8, meaning the market already values the company at its historical standard
— Guidance for the fourth quarter is revenue of $3.9–4.0 billion and an operating margin of 48–49%, implying further growth but at a slower pace than in the third quarter
Attractiveness
Key figures, USD bn
| Metric | Q3 2025 | Q3 2026 | Change |
|---|---|---|---|
| Revenue | 2.31 | 3.66 | +58.5% |
| EBITDA | 1.00 | — | — |
| Operating profit | 0.98 | 1.64 | +67.9% |
| Net profit | 0.85 | 1.56 | +82.9% |
| Operating cash flow | 1.27 | — | — |
| Capex | 0.03 | — | — |
| EBITDA margin | 43.4% | — | — |
| Net margin | 37.0% | 42.7% | +5.7 pp |
Revenue grew 58.5% year over year in the third quarter – an acceleration from 37.7% in the second quarter and the fastest pace since the IPO
Revenue for the third quarter of 2026 was $3,657.6 million, up 58.5% from a year earlier. In the second quarter growth was 37.7%, so the pace accelerated. The company itself calls this the highest year-over-year growth since its IPO.
Product revenue reached $3,190.0 million versus $1,911.7 million a year earlier, while service revenue was $467.6 million versus $396.6 million. The main contribution comes from equipment sales rather than services, which fits the phase of active deployment of AI networks.
Quarter over quarter revenue grew 20.5%. The step from $3,035.7 million in the second quarter to $3,657.6 million in the third indicates that demand is not slowing and that contracts with large customers are being executed faster than expected.
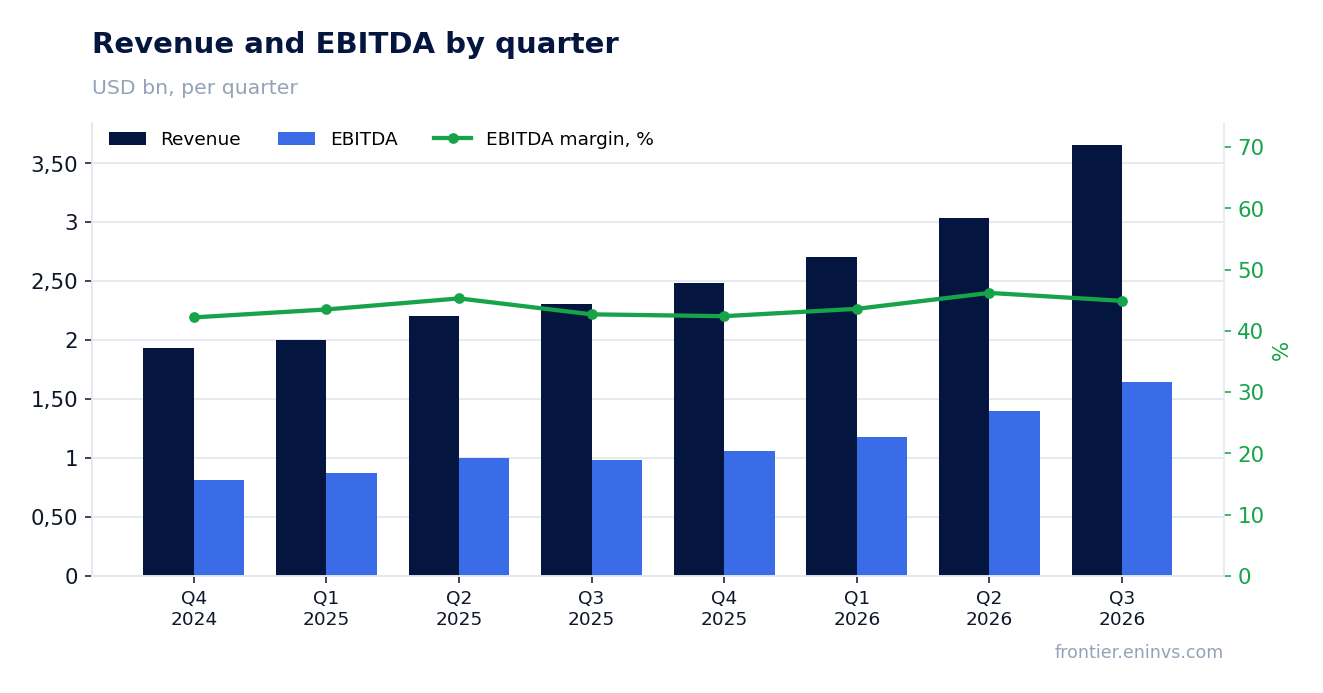
The operating margin rose to 44.9% from 42.4% because revenue grew faster than research and development spending
Operating profit for the third quarter was $1,642.4 million versus $978.2 million a year earlier, and the operating margin was 44.9% versus 42.4%. Gross margin slipped to 63.6% from 64.6%, but this was offset by savings on operating expenses.
Research and development spending rose to $486.9 million from $326.0 million, but its share of revenue fell because revenue itself grew faster. Sales and marketing was almost flat at $156.6 million versus $151.2 million, while general and administrative costs were $39.8 million versus $34.8 million.
As a result, operating profit grew faster than revenue: 67.9% versus 58.5%. This indicates that the company is gaining operating leverage rather than simply growing sales through discounts.
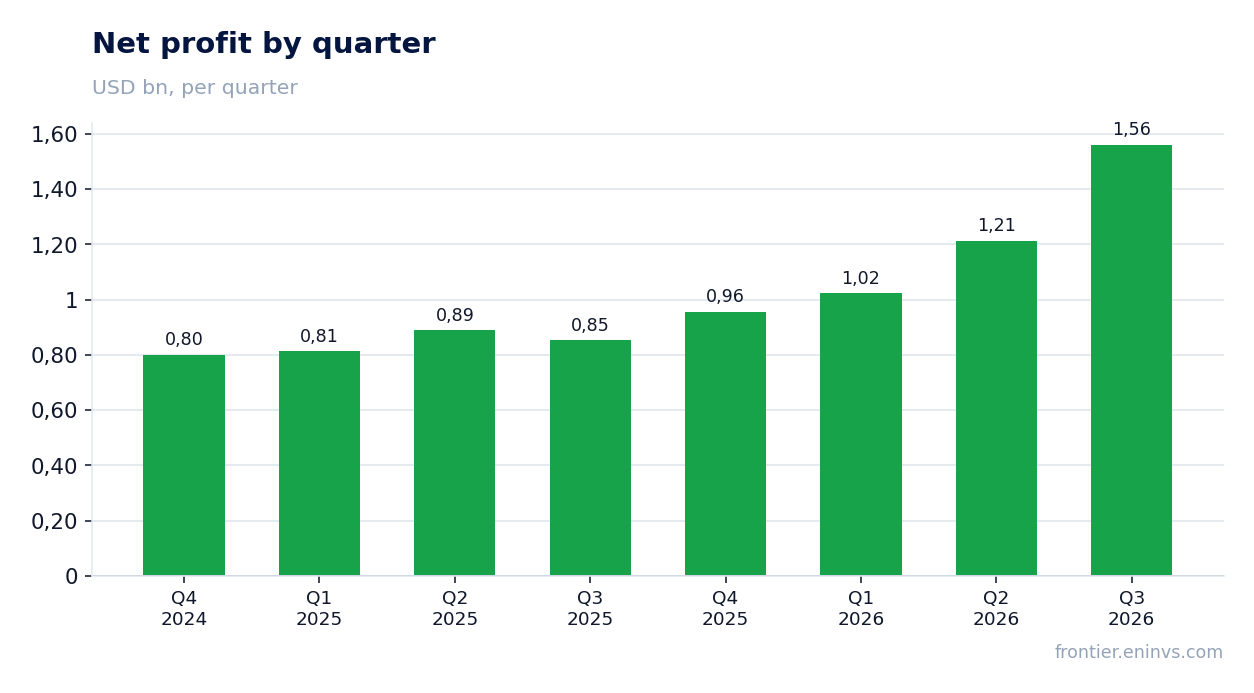
Net profit rose 82.9% not only on operations: $134.5 million came from gains on strategic investments
Net profit for the third quarter was $1,560.4 million versus $853.0 million a year earlier, up 82.9%. The net margin rose to 42.7% from 37.0%.
The report discloses that $134.5 million came from gains on strategic investments, which were absent a year earlier. Without this line profit would have been lower, though still a record. This is a one-off item that should not be carried into future quarters.
Operating profit grew 67.9%, meaning core operations delivered most of the increase. One-off gains added to the net profit growth rate but were not its only cause.
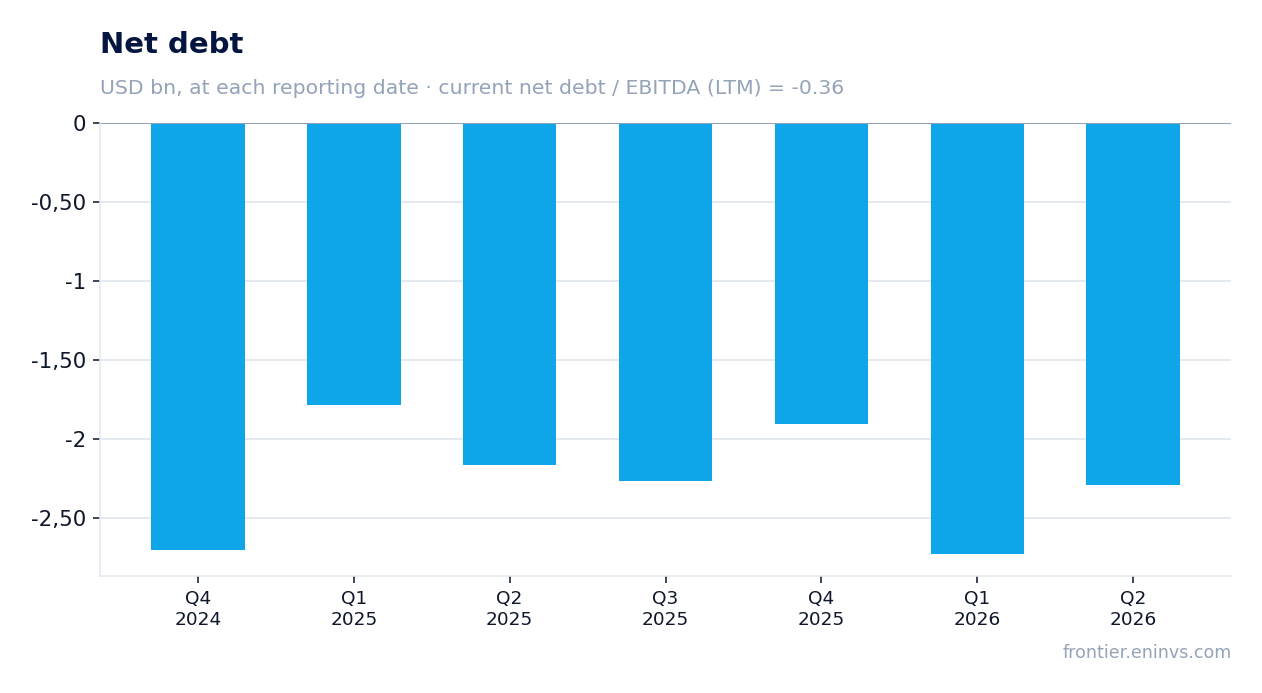
The company sits on a net cash cushion of $1,904.3 million, with net debt to EBITDA at minus 0.36
Net debt at the latest annual balance sheet is minus $1,904.3 million, meaning cash and marketable securities exceed debt obligations. The net debt to EBITDA ratio for the trailing twelve months is minus 0.36.
Cash and equivalents at 30 September 2026 were $2,288.1 million, and marketable securities were $12,070.9 million. The company has no long-term debt, and operating cash flow for the nine months reached $3,977.4 million.
This cushion allows the company to fund working capital growth and capital expenditure without borrowing. Capital expenditure for the nine months was $184.9 million, insignificant relative to operating cash flow.
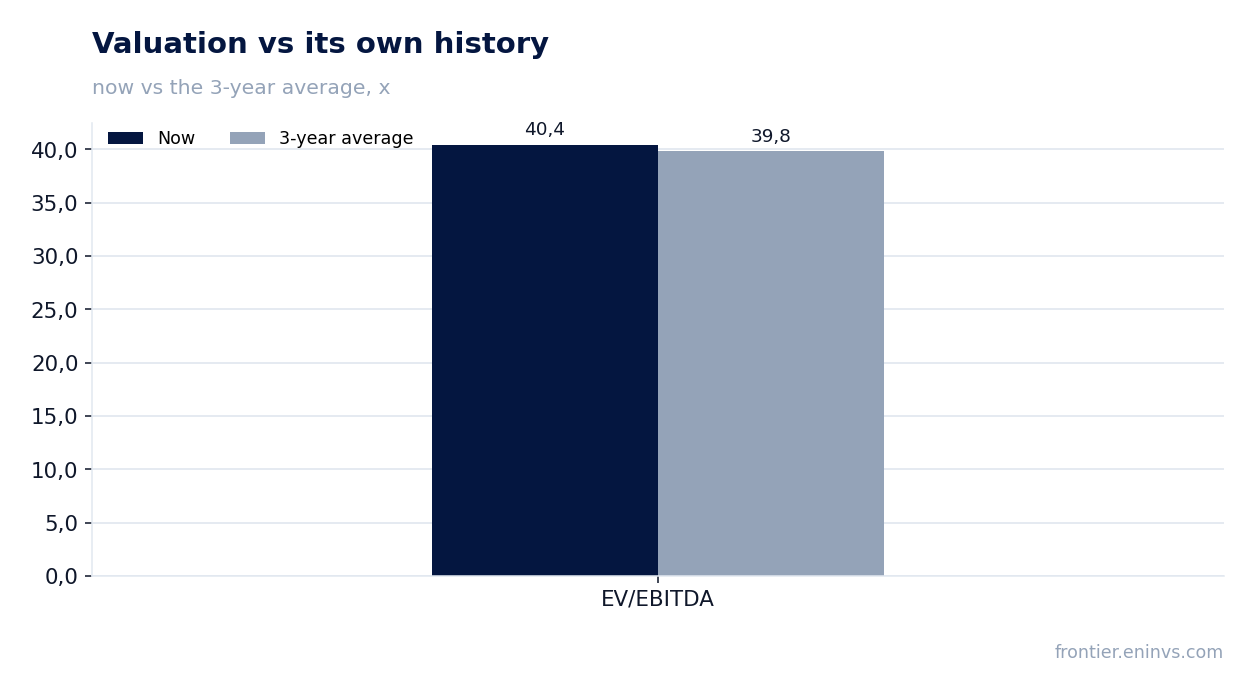
The EV/EBITDA multiple of 40.4 is in line with its own three-year average of 39.8, meaning the market already values the company at its historical standard
EV/EBITDA for the trailing twelve months is 40.4, while the three-year average is 39.8. The difference is within 1%, meaning the stock trades in line with its own history, neither above nor below it.
P/E for the trailing twelve months is 45.5. With a market capitalisation of $216,422.5 million and trailing twelve-month EBITDA of $5,305.9 million, the valuation looks high in absolute terms, but it matches the growth rates the company is delivering.
On the portal's model, fair value implies +21% upside to the current price. This estimate is based on EBITDA growth and a target multiple, not on market consensus.
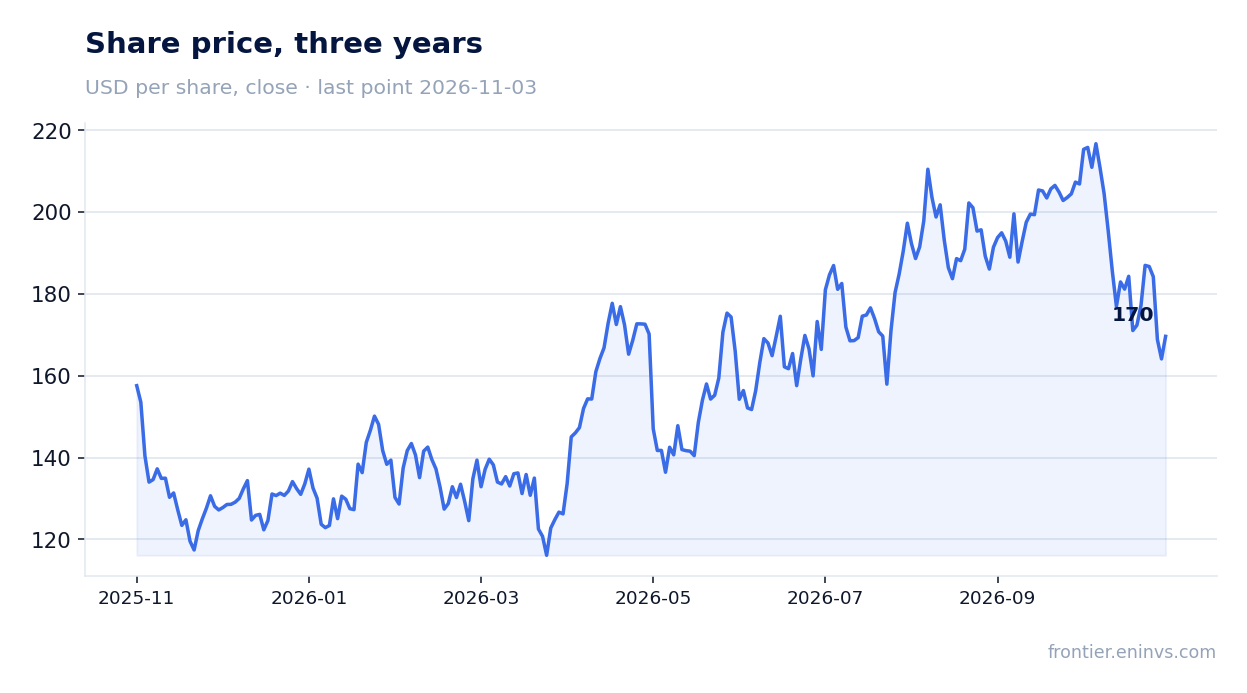
Guidance for the fourth quarter is revenue of $3.9–4.0 billion and an operating margin of 48–49%, implying further growth but at a slower pace than in the third quarter
The company guides fourth-quarter 2026 revenue to $3.9–4.0 billion. That is above the $3,657.6 million of the third quarter, but the year-over-year growth rate will be slower than 58.5% because the year-earlier base was already high.
Non-GAAP operating margin is guided at 48–49% versus 49.1% in the third quarter. This is a slight decline, but it indicates the company does not expect further margin expansion in the near term.
Diluted earnings per share guidance is $1.26–1.30 versus $1.20 in the third quarter. If the company lands at the top of the range, annual profit growth will remain high but will decelerate relative to the quarter.
Valuation on the latest reported figures
| Metric | Value |
|---|---|
| Market cap | 216 bn USD |
| P/E (LTM) | 45.5 |
| EV/EBITDA (LTM) | 40.4 |
| P/B | 17.50 |
| Net debt / EBITDA (LTM) | -0.36 |
| ROE | 40.0% |
| EV/EBITDA, 3-year average | 39.8 |
Bottom line
The quarter is genuinely strong: revenue grew 58.5%, the operating margin rose to 44.9%, and net profit increased 82.9%. However, part of this growth is one-off investment gains of $134.5 million, and fourth-quarter guidance implies a slower pace. The stock trades in line with its own three-year EV/EBITDA history, and the portal's model implies +21% upside, but the margin of safety is thin. The verdict is 'rather attractive': the company is growing faster than the market and has no debt, but the valuation already reflects much of the good news.
Open the company's financial profile ANET →
See also: market overview · valuation map · stock screeners