APA Corporation: oil up a third, but the company earned 11% more than prices alone implied
Contents

On 7 October APA Corporation released preliminary third-quarter 2026 results. The average Brent price for the quarter was 91.3 dollars against 68 dollars a year earlier (+34.2%), WTI – 85.4 dollars (+31.7%). At year-ago volumes and costs, our calculation shows those prices would have produced revenue of 2,575.3 million dollars and EBITDA of 1,683.9 million; actual revenue was 2,769 million (+7.5% versus the calculation) and EBITDA 1,869 million (+11.0%). One-off items lifted the result above the price-implied level: a net gain on oil and gas purchases and sales of 190 million dollars, including 8 million of realised gains on commodity derivatives. Our verdict: rather unattractive – on the portal's spot model the share stands 67% above fair value. Our view: the share is rather unattractive at the current price; upside on the portal model -67%.
Our view: is there upside
Our view in numbers
| Metric | Our read |
|---|---|
| Verdict | Rather unattractive |
| Upside on the portal model | -67% |
| How the model works | spot model: EBITDA re-priced to current commodity prices at the target EV/EBITDA, against market cap |
| EV/EBITDA now and 3-year average | 3.0 vs 3.0 – in line with its history |
| Dividend yield, 12m | 2.2% |
| Net debt / EBITDA | 0.62 – low leverage |
| Strongest case for | The company earned EBITDA of 1,869 million against a calculated 1,683.9 million, 11.0% more than prices alone implied, while debt at 0.62 LTM EBITDA remains moderate. |
| Strongest case against | On the portal's spot model the share stands 67% above fair value, and the EV/EBITDA multiple of 3.0 offers no discount to the three-year average of 2.96. |
| What would change the view | The verdict would improve with sustained production growth lifting annual EBITDA above 7,673.2 million, or with Brent falling below 80 dollars, which would lower fair value further. |
Key takeaways
— Oil rose by a third while US gas fell – the price backdrop was mixed
— Our calculation shows prices implied EBITDA of 1,683.9 million, but the company earned 1,869 million – one-off items made the difference
— Revenue accelerated from +9.0% in the second quarter to +30.9% in the third, but this is a low-base effect
— EBITDA margin rose to 67.5% from 63.0%, and net profit more than tripled to 698 million
— Debt at 0.62 LTM EBITDA is moderate, but the dividend yield is only 2.2%
— The EV/EBITDA multiple of 3.0 matches its own three-year average – the market gives neither a discount nor a premium
— On the portal's spot model the share stands 67% above fair value
Key figures, USD bn
| Metric | Q3 2025 | Q3 2026 | Change |
|---|---|---|---|
| Revenue | 2.12 | 2.77 | +30.9% |
| EBITDA | 1.33 | 1.87 | +40.3% |
| Operating profit | 0.77 | 1.31 | +71.2% |
| Net profit | 0.20 | 0.70 | +240.5% |
| Operating cash flow | 1.46 | 1.38 | -5.8% |
| Capex | 0.72 | 0.64 | -10.4% |
| EBITDA margin | 63.0% | 67.5% | +4.5 pp |
| Net margin | 9.7% | 25.2% | +15.5 pp |
Oil rose by a third while US gas fell – the price backdrop was mixed
The average Brent price in the third quarter of 2026 was 91.3 dollars per barrel against 68 dollars a year earlier, up 34.2%. WTI rose 31.7% to 85.4 dollars. Against the previous quarter both benchmarks fell: Brent by 5.6%, WTI by 7.9%.
US gas moved the other way: Henry Hub averaged 2.893 dollars per MMBtu against 3.083 dollars a year earlier, down 6.2%. Gas accounts for 19% of revenue in the portal's model, Brent for 55% and WTI for 14%, so the oil rally outweighed the gas decline.
Brent now stands at 92.3 dollars, 1.1% above the reported-quarter average, and Henry Hub at 3.31 dollars, 14.4% above. For fourth-quarter revenue this is support rather than pressure.
Commodity prices: period average and now
| Benchmark | Year ago | Q3 2026 | YoY | Spot 2026-11-11 |
|---|---|---|---|---|
| Brent, USD | 68,0 | 91,3 | +34,2% | 92,3 |
| Henry Hub, USD | 3,08 | 2,89 | -6,2% | 3,31 |
| WTI, USD | 64,9 | 85,4 | +31,7% | 86,6 |
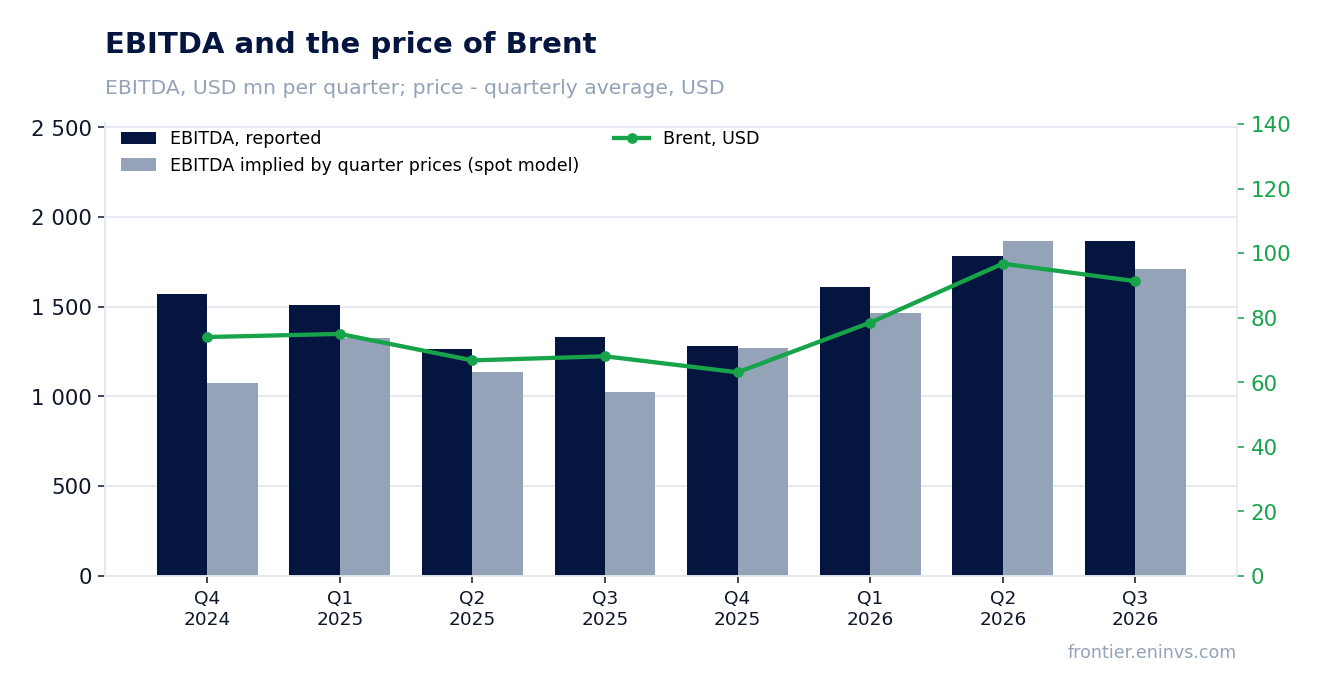
Our calculation shows prices implied EBITDA of 1,683.9 million, but the company earned 1,869 million – one-off items made the difference
Holding third-quarter 2025 volumes and non-commodity costs and substituting only the reported quarter's prices gives revenue of 2,575.3 million dollars and EBITDA of 1,683.9 million. Actual revenue reached 2,769 million, 7.5% above the calculation, and EBITDA 1,869 million, 11.0% above.
One-off items from the release explain part of the gap. The net gain on oil and gas purchases and sales before tax was 190 million dollars, including 8 million of realised gains on commodity derivatives. Dry hole costs before tax were 25 million. Both items sit above operating income and are inside our EBITDA.
A second yardstick is the portal's spot model: from the average of the previous four quarters re-priced to this period's prices it expected EBITDA of 1,709.1 million and revenue of 2,431.1 million. Actuals beat it by 9.4% on EBITDA and 13.9% on revenue. In the four preceding quarters the deviation was +29.8%, +1.1%, +9.9% and -4.6%, so the model systematically understates the company.
Realisation ran at a discount to benchmarks: our calculation puts the average realised price at 0.96 of the benchmark average. That capped revenue, but one-off items more than offset the discount.
What the prices implied and what the company earned
| Base (Q3 2025) | Implied at period prices | Reported | Reported vs implied | |
|---|---|---|---|---|
| Revenue, USD mn | 2 115 | 2 575 | 2 769 | +7,5% |
| EBITDA, USD mn | 1 332 | 1 684 | 1 869 | +11,0% |
| EBITDA, portal spot model, USD mn | — | 1 709 | 1 869 | +9,4% |
Revenue and EBITDA by quarter
| Period | Measure | bn USD |
|---|---|---|
| Q4 2024 | Revenue | 2.714 |
| Q1 2025 | Revenue | 2.636 |
| Q2 2025 | Revenue | 2.178 |
| Q3 2025 | Revenue | 2.115 |
| Q4 2025 | Revenue | 2.022 |
| Q1 2026 | Revenue | 2.261 |
| Q2 2026 | Revenue | 2.373 |
| Q3 2026 | Revenue | 2.769 |
| Q4 2024 | EBITDA | 1.57 |
| Q1 2025 | EBITDA | 1.508 |
| Q2 2025 | EBITDA | 1.267 |
| Q3 2025 | EBITDA | 1.332 |
| Q4 2025 | EBITDA | 1.284 |
| Q1 2026 | EBITDA | 1.608 |
| Q2 2026 | EBITDA | 1.784 |
| Q3 2026 | EBITDA | 1.869 |
EBITDA margin
| Period | Measure | % |
|---|---|---|
| Q4 2024 | EBITDA margin | 57.8 |
| Q1 2025 | EBITDA margin | 57.2 |
| Q2 2025 | EBITDA margin | 58.2 |
| Q3 2025 | EBITDA margin | 63.0 |
| Q4 2025 | EBITDA margin | 63.5 |
| Q1 2026 | EBITDA margin | 71.1 |
| Q2 2026 | EBITDA margin | 75.2 |
| Q3 2026 | EBITDA margin | 67.5 |
Revenue accelerated from +9.0% in the second quarter to +30.9% in the third, but this is a low-base effect
Third-quarter revenue was 2,769 million dollars, 30.9% above a year earlier. In the second quarter growth was 9.0%, so this is an acceleration. But the base was low: in the third quarter of 2025 revenue fell 16.4% and in the fourth 25.5%.
Against the previous quarter revenue rose from 2,373 million to 2,769 million. At second-quarter volumes and costs, our calculation shows this period's prices would have produced 2,269.7 million, so actual revenue is 22.0% above the calculation. Volumes and one-off items, not price, made the difference: prices fell quarter on quarter.
The acceleration is arithmetic from a low base and one-off income, not a durable improvement in sales. The base gets even lower next quarter: fourth-quarter 2025 revenue was 2,022 million.
Production, realised price and unit cost (company release)
| Metric | Year ago | Reported period | YoY |
|---|---|---|---|
| Oil, United States (before hedges), $ per bbl | — | 87,50 | — |
| Oil, International (before hedges), $ per bbl | — | 98,50 | — |
| NGL, United States (before hedges), $ per bbl | — | 26,00 | — |
EBITDA margin rose to 67.5% from 63.0%, and net profit more than tripled to 698 million
Reported-quarter EBITDA was 1,869 million dollars against 1,332 million a year earlier, up 40.3%. The EBITDA margin rose to 67.5% from 63.0%. Operating profit was 1,313 million and depreciation, depletion and amortisation 556 million.
Net profit reached 698 million against 205 million a year earlier, up 240.5%. The net margin was 25.2% against 9.7%. The same one-off items sit in profit: the 190 million gain on oil and gas purchases and sales, including 8 million on derivatives, and 25 million of dry hole costs.
General and administrative expenses were about 115 million dollars, of which 56 million was stock-based compensation, most of it reflecting the mark-to-market of APA's share price during the quarter. It is an accounting charge, not a cash outflow, but it weighs on profit.
The margin rise while prices fell quarter on quarter comes from one-off income and the cost structure, not from better price realisation.
Debt at 0.62 LTM EBITDA is moderate, but the dividend yield is only 2.2%
Net debt at 30 September 2026 was 4,274 million dollars against LTM EBITDA of 6,889.6 million, or 0.62 LTM EBITDA. That is a moderate level for a producer. Operating cash flow in the reported quarter was 1,376 million and capital expenditure 644 million, so free cash flow before dividends was positive.
The company repurchased 10.5 million shares at an average price of 42.78 dollars in the third quarter. Against a market capitalisation of 15,149 million dollars this is meaningful price support, but it competes with dividends for cash flow.
The trailing twelve-month dividend yield is 2.2%. At the current price and LTM profit of 2,170 million the payout is moderate. For a producer with a reserve life of 6.6 years, the dividend is not the main argument for the share.
Valuation vs its own history
now vs the 3-year average
| Period | Measure | × |
|---|---|---|
| EV/EBITDA | Now | 2.9653644899883718 |
| EV/EBITDA | 3-year average | 2.96153985187782 |
The EV/EBITDA multiple of 3.0 matches its own three-year average – the market gives neither a discount nor a premium
EV/EBITDA LTM is 3.0 against a three-year average of 2.96, so the share is valued in line with its own history. P/E LTM is 6.98. Return on equity is 39.3%.
On the portal's spot model at today's prices annual EBITDA would be 7,673.2 million against LTM 6,545 million, 17.2% higher. EV/EBITDA at current prices is 2.5 and net debt to EBITDA 0.56. The market is already pricing in higher earnings than past prices delivered.
On the portal's model the share's fair value is 67% below the current price. This is our own calculation, not a consensus. It rests on current prices and a target multiple, and it drives the verdict.
Share price, three years
close, last point 2026-11-10
| Period | Measure | USD per share |
|---|---|---|
| 2025-11-11 | Closing price | 24.59000015258789 |
| 2025-11-12 | Closing price | 23.889999389648438 |
| 2025-11-13 | Closing price | 24.690000534057617 |
| 2025-11-14 | Closing price | 24.790000915527344 |
| 2025-11-17 | Closing price | 24.3799991607666 |
| 2025-11-18 | Closing price | 24.920000076293945 |
| 2025-11-19 | Closing price | 24.049999237060547 |
| 2025-11-20 | Closing price | 23.3799991607666 |
| 2025-11-21 | Closing price | 23.950000762939453 |
| 2025-11-24 | Closing price | 24.40999984741211 |
| 2025-11-25 | Closing price | 24.079999923706055 |
| 2025-11-26 | Closing price | 24.670000076293945 |
| 2025-11-28 | Closing price | 24.969999313354492 |
| 2025-12-01 | Closing price | 25.280000686645508 |
| 2025-12-02 | Closing price | 25.450000762939453 |
| 2025-12-03 | Closing price | 26.950000762939453 |
| 2025-12-04 | Closing price | 26.709999084472656 |
| 2025-12-05 | Closing price | 27.100000381469727 |
| 2025-12-08 | Closing price | 26.139999389648438 |
| 2025-12-09 | Closing price | 26.389999389648438 |
| 2025-12-10 | Closing price | 26.31999969482422 |
| 2025-12-11 | Closing price | 25.950000762939453 |
| 2025-12-12 | Closing price | 25.93000030517578 |
| 2025-12-15 | Closing price | 25.270000457763672 |
| 2025-12-16 | Closing price | 23.959999084472656 |
| 2025-12-17 | Closing price | 24.6299991607666 |
| 2025-12-18 | Closing price | 23.809999465942383 |
| 2025-12-19 | Closing price | 24.1200008392334 |
| 2025-12-22 | Closing price | 24.40999984741211 |
| 2025-12-23 | Closing price | 24.360000610351562 |
| 2025-12-24 | Closing price | 24.360000610351562 |
| 2025-12-26 | Closing price | 24.18000030517578 |
| 2025-12-29 | Closing price | 24.3799991607666 |
| 2025-12-30 | Closing price | 24.700000762939453 |
| 2025-12-31 | Closing price | 24.459999084472656 |
| 2026-01-02 | Closing price | 25.360000610351562 |
| 2026-01-05 | Closing price | 24.469999313354492 |
| 2026-01-06 | Closing price | 23.8799991607666 |
| 2026-01-07 | Closing price | 23.389999389648438 |
| 2026-01-08 | Closing price | 25.3700008392334 |
| 2026-01-09 | Closing price | 25.200000762939453 |
| 2026-01-12 | Closing price | 24.920000076293945 |
| 2026-01-13 | Closing price | 25.719999313354492 |
| 2026-01-14 | Closing price | 26.690000534057617 |
| 2026-01-15 | Closing price | 26.010000228881836 |
| 2026-01-16 | Closing price | 25.780000686645508 |
| 2026-01-20 | Closing price | 25.350000381469727 |
| 2026-01-21 | Closing price | 26.540000915527344 |
| 2026-01-22 | Closing price | 25.549999237060547 |
| 2026-01-23 | Closing price | 25.799999237060547 |
| 2026-01-26 | Closing price | 25.399999618530273 |
| 2026-01-27 | Closing price | 25.829999923706055 |
| 2026-01-28 | Closing price | 26.010000228881836 |
| 2026-01-29 | Closing price | 26.260000228881836 |
| 2026-01-30 | Closing price | 26.40999984741211 |
| 2026-02-02 | Closing price | 25.889999389648438 |
| 2026-02-03 | Closing price | 26.459999084472656 |
| 2026-02-04 | Closing price | 27.3799991607666 |
| 2026-02-05 | Closing price | 26.479999542236328 |
| 2026-02-06 | Closing price | 27.459999084472656 |
| 2026-02-09 | Closing price | 27.489999771118164 |
| 2026-02-10 | Closing price | 27.450000762939453 |
| 2026-02-11 | Closing price | 28.260000228881836 |
| 2026-02-12 | Closing price | 26.920000076293945 |
| 2026-02-13 | Closing price | 27.920000076293945 |
| 2026-02-17 | Closing price | 27.34000015258789 |
| 2026-02-18 | Closing price | 28.610000610351562 |
| 2026-02-19 | Closing price | 29.079999923706055 |
| 2026-02-20 | Closing price | 29.059999465942383 |
| 2026-02-23 | Closing price | 28.719999313354492 |
| 2026-02-24 | Closing price | 28.6200008392334 |
| 2026-02-25 | Closing price | 27.84000015258789 |
| 2026-02-26 | Closing price | 29.100000381469727 |
| 2026-02-27 | Closing price | 30.3700008392334 |
| 2026-03-02 | Closing price | 31.690000534057617 |
| 2026-03-03 | Closing price | 31.850000381469727 |
| 2026-03-04 | Closing price | 31.100000381469727 |
| 2026-03-05 | Closing price | 32.380001068115234 |
| 2026-03-06 | Closing price | 32.68000030517578 |
| 2026-03-09 | Closing price | 32.59000015258789 |
| 2026-03-10 | Closing price | 31.81999969482422 |
| 2026-03-11 | Closing price | 32.970001220703125 |
| 2026-03-12 | Closing price | 33.61000061035156 |
| 2026-03-13 | Closing price | 34.470001220703125 |
| 2026-03-16 | Closing price | 34.540000915527344 |
| 2026-03-17 | Closing price | 35.869998931884766 |
| 2026-03-18 | Closing price | 36.61000061035156 |
| 2026-03-19 | Closing price | 38.060001373291016 |
| 2026-03-20 | Closing price | 39.11000061035156 |
| 2026-03-23 | Closing price | 39.029998779296875 |
| 2026-03-24 | Closing price | 40.79999923706055 |
| 2026-03-25 | Closing price | 41.31999969482422 |
| 2026-03-26 | Closing price | 42.79999923706055 |
| 2026-03-27 | Closing price | 44.38999938964844 |
| 2026-03-30 | Closing price | 43.7400016784668 |
| 2026-03-31 | Closing price | 42.439998626708984 |
| 2026-04-01 | Closing price | 41.349998474121094 |
| 2026-04-02 | Closing price | 42.040000915527344 |
| 2026-04-06 | Closing price | 43.02000045776367 |
| 2026-04-07 | Closing price | 42.959999084472656 |
| 2026-04-08 | Closing price | 38.75 |
| 2026-04-09 | Closing price | 38.970001220703125 |
| 2026-04-10 | Closing price | 38.630001068115234 |
| 2026-04-13 | Closing price | 39.4900016784668 |
| 2026-04-14 | Closing price | 37.029998779296875 |
| 2026-04-15 | Closing price | 36.599998474121094 |
| 2026-04-16 | Closing price | 37.900001525878906 |
| 2026-04-17 | Closing price | 35.7400016784668 |
| 2026-04-20 | Closing price | 35.970001220703125 |
| 2026-04-21 | Closing price | 37.599998474121094 |
| 2026-04-22 | Closing price | 38.060001373291016 |
| 2026-04-23 | Closing price | 38.65999984741211 |
| 2026-04-24 | Closing price | 37.72999954223633 |
| 2026-04-27 | Closing price | 38.43000030517578 |
| 2026-04-28 | Closing price | 38.650001525878906 |
| 2026-04-29 | Closing price | 40.31999969482422 |
| 2026-04-30 | Closing price | 40.72999954223633 |
| 2026-05-01 | Closing price | 40.130001068115234 |
| 2026-05-04 | Closing price | 42.02000045776367 |
| 2026-05-05 | Closing price | 41.47999954223633 |
| 2026-05-06 | Closing price | 38.29999923706055 |
| 2026-05-07 | Closing price | 36.2400016784668 |
| 2026-05-08 | Closing price | 35.560001373291016 |
| 2026-05-11 | Closing price | 36.70000076293945 |
| 2026-05-12 | Closing price | 37.09000015258789 |
| 2026-05-13 | Closing price | 36.970001220703125 |
| 2026-05-14 | Closing price | 37.11000061035156 |
| 2026-05-15 | Closing price | 38.97999954223633 |
| 2026-05-18 | Closing price | 40.150001525878906 |
| 2026-05-19 | Closing price | 40.90999984741211 |
| 2026-05-20 | Closing price | 39.31999969482422 |
| 2026-05-21 | Closing price | 38.34000015258789 |
| 2026-05-22 | Closing price | 38.79999923706055 |
| 2026-05-26 | Closing price | 37.5 |
| 2026-05-27 | Closing price | 36.619998931884766 |
| 2026-05-28 | Closing price | 36.529998779296875 |
| 2026-05-29 | Closing price | 36.43000030517578 |
| 2026-06-01 | Closing price | 37.75 |
| 2026-06-02 | Closing price | 37.810001373291016 |
| 2026-06-03 | Closing price | 38.33000183105469 |
| 2026-06-04 | Closing price | 38.220001220703125 |
| 2026-06-05 | Closing price | 36.56999969482422 |
| 2026-06-08 | Closing price | 37.65999984741211 |
| 2026-06-09 | Closing price | 36.61000061035156 |
| 2026-06-10 | Closing price | 38.0 |
| 2026-06-11 | Closing price | 36.779998779296875 |
| 2026-06-12 | Closing price | 37.02000045776367 |
| 2026-06-15 | Closing price | 34.77000045776367 |
| 2026-06-16 | Closing price | 34.2599983215332 |
| 2026-06-17 | Closing price | 33.93000030517578 |
| 2026-06-18 | Closing price | 33.029998779296875 |
| 2026-06-22 | Closing price | 34.20000076293945 |
| 2026-06-23 | Closing price | 34.220001220703125 |
| 2026-06-24 | Closing price | 33.33000183105469 |
| 2026-06-25 | Closing price | 33.41999816894531 |
| 2026-06-26 | Closing price | 33.0099983215332 |
| 2026-06-29 | Closing price | 32.959999084472656 |
| 2026-06-30 | Closing price | 32.56999969482422 |
| 2026-07-01 | Closing price | 31.8700008392334 |
| 2026-07-02 | Closing price | 32.36000061035156 |
| 2026-07-06 | Closing price | 32.459999084472656 |
| 2026-07-07 | Closing price | 34.0 |
| 2026-07-08 | Closing price | 35.060001373291016 |
| 2026-07-09 | Closing price | 33.290000915527344 |
| 2026-07-10 | Closing price | 33.439998626708984 |
| 2026-07-13 | Closing price | 34.66999816894531 |
| 2026-07-14 | Closing price | 34.529998779296875 |
| 2026-07-15 | Closing price | 34.27000045776367 |
| 2026-07-16 | Closing price | 34.279998779296875 |
| 2026-07-17 | Closing price | 35.220001220703125 |
| 2026-07-20 | Closing price | 34.84000015258789 |
| 2026-07-21 | Closing price | 35.77000045776367 |
| 2026-07-22 | Closing price | 36.18000030517578 |
| 2026-07-23 | Closing price | 36.41999816894531 |
| 2026-07-24 | Closing price | 36.150001525878906 |
| 2026-07-27 | Closing price | 34.7400016784668 |
| 2026-07-28 | Closing price | 34.93000030517578 |
| 2026-07-29 | Closing price | 36.70000076293945 |
| 2026-07-30 | Closing price | 36.33000183105469 |
| 2026-07-31 | Closing price | 37.31999969482422 |
| 2026-08-03 | Closing price | 36.869998931884766 |
| 2026-08-04 | Closing price | 35.79999923706055 |
| 2026-08-05 | Closing price | 34.65999984741211 |
| 2026-08-06 | Closing price | 36.529998779296875 |
| 2026-08-07 | Closing price | 37.630001068115234 |
| 2026-08-10 | Closing price | 41.02000045776367 |
| 2026-08-11 | Closing price | 40.619998931884766 |
| 2026-08-12 | Closing price | 39.970001220703125 |
| 2026-08-13 | Closing price | 40.0 |
| 2026-08-14 | Closing price | 40.470001220703125 |
| 2026-08-17 | Closing price | 41.58000183105469 |
| 2026-08-18 | Closing price | 42.369998931884766 |
| 2026-08-19 | Closing price | 43.45000076293945 |
| 2026-08-20 | Closing price | 44.38999938964844 |
| 2026-08-21 | Closing price | 43.38999938964844 |
| 2026-08-24 | Closing price | 42.959999084472656 |
| 2026-08-25 | Closing price | 41.349998474121094 |
| 2026-08-26 | Closing price | 41.189998626708984 |
| 2026-08-27 | Closing price | 42.380001068115234 |
| 2026-08-28 | Closing price | 42.540000915527344 |
| 2026-08-31 | Closing price | 43.150001525878906 |
| 2026-09-01 | Closing price | 44.29999923706055 |
| 2026-09-02 | Closing price | 44.70000076293945 |
| 2026-09-03 | Closing price | 44.18000030517578 |
| 2026-09-04 | Closing price | 42.77000045776367 |
| 2026-09-08 | Closing price | 43.54999923706055 |
| 2026-09-09 | Closing price | 44.84000015258789 |
| 2026-09-10 | Closing price | 44.529998779296875 |
| 2026-09-11 | Closing price | 44.72999954223633 |
| 2026-09-14 | Closing price | 45.029998779296875 |
| 2026-09-15 | Closing price | 47.40999984741211 |
| 2026-09-16 | Closing price | 44.790000915527344 |
| 2026-09-17 | Closing price | 45.459999084472656 |
| 2026-09-18 | Closing price | 44.869998931884766 |
| 2026-09-21 | Closing price | 43.810001373291016 |
| 2026-09-22 | Closing price | 42.29999923706055 |
| 2026-09-23 | Closing price | 43.70000076293945 |
| 2026-09-24 | Closing price | 43.68000030517578 |
| 2026-09-25 | Closing price | 42.7400016784668 |
| 2026-09-28 | Closing price | 42.33000183105469 |
| 2026-09-29 | Closing price | 42.189998626708984 |
| 2026-09-30 | Closing price | 41.540000915527344 |
| 2026-10-01 | Closing price | 43.34000015258789 |
| 2026-10-02 | Closing price | 43.68000030517578 |
| 2026-10-05 | Closing price | 43.849998474121094 |
| 2026-10-06 | Closing price | 44.099998474121094 |
| 2026-10-07 | Closing price | 43.810001373291016 |
| 2026-10-08 | Closing price | 45.470001220703125 |
| 2026-10-09 | Closing price | 45.880001068115234 |
| 2026-10-12 | Closing price | 46.84000015258789 |
| 2026-10-13 | Closing price | 48.0099983215332 |
| 2026-10-14 | Closing price | 47.369998931884766 |
| 2026-10-15 | Closing price | 47.22999954223633 |
| 2026-10-16 | Closing price | 49.150001525878906 |
| 2026-10-19 | Closing price | 49.7599983215332 |
| 2026-10-20 | Closing price | 49.900001525878906 |
| 2026-10-21 | Closing price | 49.630001068115234 |
| 2026-10-22 | Closing price | 49.439998626708984 |
| 2026-10-23 | Closing price | 51.900001525878906 |
| 2026-10-26 | Closing price | 51.65999984741211 |
| 2026-10-27 | Closing price | 50.790000915527344 |
| 2026-10-28 | Closing price | 51.11000061035156 |
| 2026-10-29 | Closing price | 51.5099983215332 |
| 2026-10-30 | Closing price | 52.81999969482422 |
| 2026-11-02 | Closing price | 48.81999969482422 |
| 2026-11-03 | Closing price | 47.77000045776367 |
| 2026-11-04 | Closing price | 44.4900016784668 |
| 2026-11-05 | Closing price | 43.47999954223633 |
| 2026-11-06 | Closing price | 44.630001068115234 |
| 2026-11-09 | Closing price | 44.54999923706055 |
| 2026-11-10 | Closing price | 45.119998931884766 |
On the portal's spot model the share stands 67% above fair value
The portal's spot model re-prices EBITDA to current prices and a target multiple. At today's prices it puts fair value 67% below the market. That is the main argument against the share.
The EV/EBITDA multiple of 3.0 against a three-year average of 2.96 says the market gives no discount to its own history. LTM profit was earned at lower prices than today's, and the model already reflects higher EBITDA.
The share barely reacted to the release: -0.7% on the day and +2.3% from the release to 10 November. The market did not read the one-off gains as a durable improvement.
Valuation on the latest reported figures
| Metric | Value |
|---|---|
| Market cap | 15.1 bn USD |
| P/E (LTM) | 7.0 |
| EV/EBITDA (LTM) | 3.0 |
| P/B | 2.16 |
| Net debt / EBITDA (LTM) | 0.62 |
| Operating cash flow (LTM) | 4.44 bn |
| ROE | 39.3% |
| Dividend yield (12m) | 2.2% |
| EV/EBITDA, 3-year average | 3.0 |
Net profit by quarter
| Period | Measure | bn USD |
|---|---|---|
| Q4 2024 | Net profit | 0.274 |
| Q1 2025 | Net profit | 0.347 |
| Q2 2025 | Net profit | 0.603 |
| Q3 2025 | Net profit | 0.205 |
| Q4 2025 | Net profit | 0.279 |
| Q1 2026 | Net profit | 0.446 |
| Q2 2026 | Net profit | 0.747 |
| Q3 2026 | Net profit | 0.698 |
Bottom line
What was genuinely strong is that the company earned more than prices alone implied: EBITDA of 1,869 million against a calculated 1,683.9 million. But one-off items made the difference – the 190 million gain on oil and gas purchases and sales, including 8 million on derivatives. The revenue acceleration to +30.9% is a low-base effect, not durable growth. Debt at 0.62 LTM EBITDA is moderate and the 2.2% dividend yield is modest. Our verdict: rather unattractive – on the portal's spot model the share stands 67% above fair value. Our view: the share is rather unattractive at the current price; upside on the portal model -67%.